


Women of childbearing age are at greater risk of adverse health outcomes than other population groups because of the increased physiological demands of pregnancy and lactation( Reference Chauliac and Masse-Raimbault 1 ). Good nutrition prior to conception and during pregnancy is therefore an essential component in achieving a healthy pregnancy and birth outcome. Nutritional intake is highly dependent on economic status, social and ethnic/cultural environment and personal habits( Reference Kontic-Vucinic, Sulovic and Radunovic 2 ).
Compromised nutrient intakes during the ‘critical windows’ of preconception and conception can adversely influence pregnancy outcome, increase risk for birth defects, alter the nutrient composition of breast milk, condition infants and children to altered growth trajectories and predispose them to chronic diseases in later life( Reference Kontic-Vucinic, Sulovic and Radunovic 2 – Reference Li, Kaur and Choi 6 ). Carmichael and co-workers showed that adequate periconception intakes of folate, vitamin B12, vitamin B6 and riboflavin were associated with decreased risk of neural tube defects among Californian women( Reference Carmichael, Yang and Shaw 7 ). Zhang’s group showed that Chinese women of childbearing age with inadequate micronutrient status had a higher risk of birth defects( Reference Zhang, Zhang and Lin 3 ), and Yin and colleagues showed that maternal intake of Mg during the third trimester of pregnancy was predictive of bone mineral density at age 16 years( Reference Yin, Dwyer and Riley 8 ). Moreover, in populations where Fe deficiency is prevalent, children born to women receiving micronutrient supplementation score better in tests of intellectual function, e.g. working memory and fine motor control( Reference Christian, Murray-Kolb and Khatry 9 ).
To date, we have little understanding of nutrient adequacy among women of childbearing age within the USA. To help address this gap, we analysed nutrient intakes from foods and dietary supplements by age, ethnicity and poverty–income ratio (PIR), an index of socio-economic status. We also examined currently available nutrient biomarker data for certain key nutrients as an indicator of long-term dietary exposures, nutrient bioavailability and in vivo utilization. This information is relevant for several reasons: (i) there is a growing incidence of metabolic complications during pregnancy, e.g. gestational diabetes, pre-eclampsia and preterm deliveries; (ii) there is accumulating evidence that maternal body weight gain and nutrient intakes prior to and during pregnancy are important predictors of body weight gain and composition, as well as of the incidence of chronic disease during infancy and childhood; and (iii) there are concerns about diet quality within this vulnerable group( Reference Krebs-Smith, Guenther and Subar 10 ).
Therefore, our goal was threefold: (i) to conduct a comprehensive analysis of nutrient intakes from foods in women of childbearing age (19–30 years and 31–50 years), based on the National Health and Nutrition Examination Survey (NHANES) database, and also examine their patterns of dietary supplement use; (ii) to understand if ethnicity and income differentially influence nutrient intakes among them; and (iii) to report the prevalence of low nutrient biomarker concentrations in blood, as an index of nutritional adequacy.
Methods
Data sources
Dietary interview data from the 2003–2008 NHANES were used to assess nutrient intakes from foods( 11 – 13 ). Briefly, NHANES collects data using interviews, physical and health examinations, and questionnaires. In addition to medical and dental examinations, physiological measurements and laboratory tests, a 24 h dietary recall is administered. The dietary recalls are conducted in English or Spanish in study participants who are 12 years and older. Three to ten days later, all participants are asked to complete a second 24 h dietary recall interview by telephone.
Study population
Since the average age of mothers at the time of first birth in the USA is 25·2 years and less than 10 % of children are born to females under 19 years of age( Reference Martin, Hamilton and Ventura 14 ), we have defined women of childbearing age according to the single Dietary Reference Intake (DRI) nutrient requirements established for women 19–50 years of age( 15 ). Data were selected for all female adult participants with complete and reliable dietary records in the age range 19–50 years. Pregnant and lactating females were excluded from this analysis. This population of women was stratified by relevant DRI age groups nearest reproductive ages (19–30 years or 31–50 years)( 15 ), ethnicity (using the US census categories of White, Mexican American or African American) and PIR. The PIR is the ratio of household income to the poverty threshold after accounting for inflation and family size( Reference Ogden, Lamb and Carroll 16 ). The PIR is used to determine eligibility for means-tested government-sponsored assistance programmes relevant for women, particularly the Special Supplemental Nutrition Program for Women, Infants, and Children (WIC)( Reference DeNavas-Walt, Proctor and Smith 17 ). For the current analysis, we have used a PIR of 1·85, or income that is 185 % of the poverty threshold applied by the Food and Nutrition Service. The PIR was stratified as either ≤1·85 or >1·85. Participants who had completed both non-consecutive 24 h dietary intake measurements were included in the study (n 3641). The study was conducted according to the guidelines laid down in the Declaration of Helsinki. All participants provided informed consent and the National Center for Health Statistics Research Ethics Review Board (Hyattsville, MD, USA) approved the NHANES protocol.
Estimation of nutrient intakes from foods
Nutrient intakes from foods were estimated as described in the 2011 publication by Fulgoni et al.( Reference Fulgoni, Keast and Bailey 18 ). The National Cancer Institute’s method was used to create usual intakes, percentiles and probabilities of meeting the DRI for twenty-four macro- and micronutrients( 19 – 22 ). The one-part National Cancer Institute model was used to determine usual intakes( Reference Tooze, Kipnis and Buckman 23 ). Models contained a dichotomous variable to delineate day of the week of dietary recall (weekend/weekday) and recall day (day 1 or day 2). Usual intake statistics including means and percentiles of intake and probabilities of meeting or exceeding the DRI for micronutrients were determined using the probability cut-point method( Reference Fulgoni, Keast and Bailey 18 , Reference Tooze, Kipnis and Buckman 23 ).
Estimation of nutrient intakes from dietary supplements
To provide an overview of the contribution of dietary supplements to nutrient intakes, summary data from NHANES 2009–2010 of the nutrients of concern for supplement users and supplement non-users for Whites, Hispanics and African Americans were extracted and converted to percentage of the Estimated Average Requirement (EAR) for each nutrient( 24 ).
Biochemical indicators of diet and nutrition
NHANES, which is conducted by the Centers for Disease Control and Prevention, collected the blood specimens through venepuncture from a representative sample of the US population (n ~14 500) during 2003–2006. The Centers for Disease Control and Prevention also conducted the laboratory analyses for fifty-eight biochemical indicators, including selected water-soluble vitamins, fat-soluble vitamins and nutrients, and trace elements. Biochemical data relevant for the current analysis were available for vitamins A, C, E, Fe and folate. The data were grouped by age, gender and ethnicity and presented as geometric mean, which provides a better estimate of central tendency, except for vitamin C which showed a symmetric distribution( 25 ).
A further analysis was done to determine the effect of intake on biochemical markers for vitamins C, Fe and folate, as it appeared that certain subgroups were at increased risk of deficiency for these vitamins. Only these nutrients were examined due to the limited number of biochemical indicators of nutrient status examined. The population of women of childbearing age was divided into deciles according to intake and the proportion deficient was determined for each decile using serum vitamin C <11·4 µmol/l, serum ferritin <15 ng/ml and red-blood-cell folate <906 nmol/l as long-term markers of vitamin status. Daly et al. found that folate levels above 906 nmol/l offered the greatest reduction in neural tube defects in women of childbearing age( Reference Daly, Mills and Molloy 26 ). Decile medians were plotted against the proportion deficient. Due to the small sample size used for biochemical analyses, only the effect of age was investigated.
Statistical analyses
SAS version 9·3 and SUDAAN version 10·0 statistical software packages were used to generate weighted means, usual intakes and percentiles. Percentages of the population were compared using a Z statistic. Linear regression models were used to assess interaction between ethnicity and PIR, reporting a Wald F statistic for significance tests. Student’s t test (two-sided, assuming equal variances) was used to compare mean intakes between the two age groups using summary data with Minitab Student Release 14 (2004).
Some controversy exists concerning when to use a Bonferroni correction for multiple comparisons within a data set. Although the current analysis is exploratory, and many feel a correction factor may incorrectly dismiss a significant difference when there is one because of the conservative nature of correcting for type 1 errors, we have chosen to also include this correction factor in order to highlight those significant differences that were strongest. With twenty-four comparisons, the conservative P value of significance would then be (0·05/24) =0·002( Reference Shaffer 27 ). P values of less than 0·05 but greater than 0·002 were considered to be borderline significant.
Results
Of the 3641 women included in the dietary analysis data set, 1560 were White, 889 were African Americans and 761 were Mexican Americans. When divided by age, 1376 were aged 19–30 years and 2265 were aged 31–50 years.
Nutrient intakes by age
Overall, younger women of childbearing age (19–30 years) had poorer intakes from foods of most nutrients, with significantly lower differences observed for carbohydrate, fibre and vitamin D at P<0·05 and for vitamin A, riboflavin, choline, K and Mg at P<0·002 with the Bonferroni correction (Table 1).
Table 1 Comparison of usual daily nutrient intakes from foods between women aged 19–30 years and 31–50 years, National Health and Nutrition Examination Survey, 2003–2008
DFE, dietary folate equivalents; RAE, retinol activity equivalents.
Nutrient intakes by ethnicity
Among 19–30-year-old females, the intakes of the following nutrients from food were significantly different when stratified by ethnicity: folate, vitamin B6, vitamin E, thiamin, P, K and Cu at P<0·05; and fibre, vitamin A, riboflavin, Ca and Mg at P<0·002 (Table 2). A similar pattern was apparent for the 31–50-year-old group, with significant differences observed for folate, thiamin, Fe, Cu and Se intakes at P<0·05; and for fibre, vitamin C, riboflavin, Ca, P, K and Mg intakes at P<0·002 (Table 3). African-American women typically had the lowest intakes of these nutrients, exceptions were that Mexican Americans had the lowest intake of vitamin K and White females had the lowest intake of vitamin C (Tables 2 and 3).
Table 2 Comparison of usual daily nutrient intakes from foods* by ethnicity for women aged 19–30 years, National Health and Nutrition Examination Survey, 2003–2008
DFE, dietary folate equivalents; RAE, retinol activity equivalents.
Table 3 Comparison of usual daily nutrient intakes from foods* by ethnicity for women aged 31–50 years, National Health and Nutrition Examination Survey, 2003–2008
DFE, dietary folate equivalents; RAE, retinol activity equivalents.
Nutrient intakes by poverty–income ratio
There were no significant differences found in nutrient intakes from foods by PIR in women aged 19–30 years, except for a minor increase in thiamin intakes in the higher income group that did not affect the low percentage of women not meeting the EAR (data not shown). In the older age group, significantly higher intakes for all nutrients except carbohydrate, vitamin C, vitamin D and choline were found in women with a higher PIR (Table 4). Choline intakes were borderline significantly lower in the lower income group.
Table 4 Comparison of usual daily nutrient intakes from foods* by poverty–income ratio (PIR) for women aged 31–50 years, National Health and Nutrition Examination Survey, 2003–2008
DFE, dietary folate equivalents; RAE, retinol activity equivalents.
Nutrient biomarker data
The adequacy of nutrient intakes was also evaluated using nutrient biomarker data as reported by the prevalence of low concentrations of certain key micronutrients in blood. Although the data are reported specifically for women 19–30 or 31–50 years of age, we focused on data for females in general, and their different ethnicities (Table 5). The biomarker data were only available for years 2003–2006, which differed from the years included in the nutrient intake analysis. A further analysis of nutrient intakes by year was performed using summary data from NHANES 2003–2010 (four cycles)( 28 – 31 ). These data showed no chronological trends in intake (data not shown).
Table 5 Prevalence (%) of inadequate nutrient status as measured by biomarkers for women of childbearing age, National Health and Nutrition Examination Survey, 2003–2006Footnote *
25(OH)D, 25-hydroxyvitamin D; RSE, relative standard error.
* Prevalence data calculated from geometric mean for all nutrients except vitamin C, for which an arithmetic mean was used( 25 ).
† Estimate flagged: 30 % ≤RSE <40 % for the prevalence estimate.
‡ Estimate suppressed: RSE≥40 % for the prevalence estimate.
Vitamin C biomarker data
Serum vitamin C is used as a marker of vitamin C status. The cut-off for deficiency is under 11·4 µmol/l, a level at which clinical signs of scurvy may become apparent( 21 ). The biochemical data showed that a small yet marked percentage of women were deficient in vitamin C, at 4·8 % (Table 5). When comparing sufficiency as measured by serum vitamin C levels with dietary intake (Fig. 1(a)), women of childbearing age with higher intakes of vitamin C had lower risk of biochemical insufficiency. Approximately 5 % of women were biochemically insufficient when intakes met the RDA of 75 mg/d; when intakes doubled to 150 mg/d, about 2 % of women remained biochemically deficient, and there was no decrease in the proportion of women with vitamin C deficiency as intakes increased above 150 mg/d. Approximately twice as many White Americans appeared to be deficient in vitamin C based on biomarker data (Table 5). This is consistent with nutrient intake data showing significantly lower vitamin C intake among White females v. African Americans or Mexican Americans (Tables 2–4).
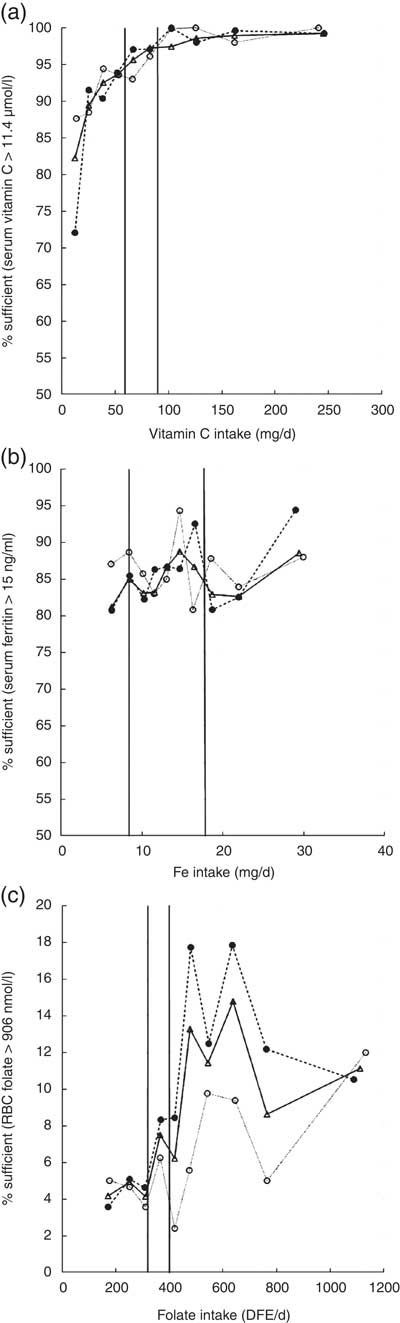
Fig. 1 Micronutrient sufficiency based on biomarkers of nutrient status in women aged 19–30 years (—○—), 31–50 years (- - ● - -) and 19–50 years (—Δ—) by deciles of intake for (a) vitamin C, (b) Fe and (c) folate, National Health and Nutrition Examination Survey, 2003–2008. The vertical line to the left represents the EAR and the vertical line to the right represents the RDA for each of these nutrients (EAR, Estimated Average Requirement; RBC, red-blood-cell; DFE, dietary folate equivalents)
Vitamin D biomarker data
The Centers for Disease Control and Prevention reported adequacy of vitamin D status among the US population based on three different cut-off values for circulating 25-hydroxyvitamin D: less than 30 nmol/l, less than 40 nmol/l or 30–50 nmol/l. Irrespective of the cut-off value used to reflect vitamin D adequacy, ~30–52 % of African Americans and ~11–33 % of Mexican Americans had levels less than the cut-off values (Table 5). This is in sharp contrast to the prevalence of vitamin D deficiency among White Americans: only 4–18 % of the population. The highest prevalence of vitamin D deficiency among African Americans is consistent with the lowest dietary intakes of vitamin D among this ethnic group (Tables 2–4).
Vitamin E biomarker data
Biochemical measures of serum vitamin E levels showed that about 0·5 % of the female population appeared to be deficient in vitamin E. Based on a cut-off value of 500 µg/l, approximately twice as many African Americans were inadequate in vitamin E status (Table 5); once again, these biomarker data are consistent with the lowest dietary intakes of vitamin E among African Americans (Tables 2 and 3).
Iron biomarker data
Overall, 10–20 % of women had low Fe stores based on serum ferritin levels below 15 ng/ml. There was no clear linear relationship between increasing Fe intake and better Fe stores (Fig. 1(b)). Close to 20 % of African Americans had inadequate Fe status (Table 5). Indeed, these biochemistry data parallel lowest dietary intakes of Fe among African Americans (Tables 2–4). Although Mexican Americans had similar intakes of Fe compared with Whites, the prevalence of Fe inadequacy was also close to ~20 % in Mexican Americans, similar to that observed for African Americans. Previous NHANES analyses in US women have observed a strong association between serum ferritin concentration and race/ethnicity( Reference Pfeiffer, Sternberg and Caldwell 32 ). Although race/ethnic differentials in Fe status may be related to dietary Fe intake, our analysis of this data set showed that Mexican-American women had higher dietary intakes of Fe than African-American women, yet a similar prevalence of Fe deficiency. This discrepancy in nutrient intake v. biochemical status among Mexican Americans may reflect either overestimating intakes of foods rich in Fe or poor bioavailability of dietary Fe. Indeed, as published by Briefel and Johnson, although serum ferritin is an indicator of storage Fe, it may not reflect dietary Fe intake; the absolute amount of dietary Fe is less relevant in comparison to the type of Fe and type of meal composition, given the large differences in haem v. non-haem Fe bioavailability, absorption and influence of dietary components such as vitamin C and meat, which enhance, and phytate, fibre and polyphenols, which inhibit, the absorption of non-haem Fe. Although the consumption of haem Fe is a major determinant of Fe stores, approximately 50 % of the Fe intake in the US diet comes from non-haem sources, mainly grain products( Reference Briefel and Johnson 33 ). Furthermore, non-dietary factors may also influence Fe status in women in particular, such as menstrual bleeding and method of contraception( Reference Herberg, Preziosi and Galan 34 ).
Folate biomarker data
Although most women appeared to be sufficient according to the cut-off point for folate deficiency of 200 nmol red-blood-cell folate/l, a much larger proportion was insufficient according to the higher cut-off for prevention of neural tube defects of 906 nmol/l, which is relevant for women of childbearing age. For women ingesting the RDA of 400 µg folate, less than 10 % of women had red-blood-cell folate levels that were associated with the lowest risk of neural tube defects. At high dietary intakes of 1000 µg/d, less than 25 % of women had red-blood-cell folate levels that prevent neural tube defects. There appeared to be an effect of age, with lower folate status found in younger women (Fig. 1(c)).
Comparison of usual nutrient intakes with recommended nutrient intakes
The percentage of women of childbearing age consuming less than the EAR, for nutrients for which more than half the population did not meet the EAR (vitamins A, C, D, E and K, fibre, Ca, Mg and K), is presented in Fig. 2 according to ethnicity. Approximately 45–75 % of women of childbearing age were not meeting the EAR for vitamin A. Likewise, 24–65 % of women were not meeting the EAR for vitamin C. For vitamins D and E, fibre and K, close to 100 % of women 19–50 years of age were not meeting the EAR. These observations were true for both age groups and were consistent among Whites, African Americans and Mexican Americans. The prevalence of women not meeting the EAR for Mg and Ca was noticeably the greatest for African-American women. Also, consistent with data presented in Tables 2–4, close to 85 % of Mexican-American women were not meeting the EAR for vitamin K, greater than for Whites or African Americans.
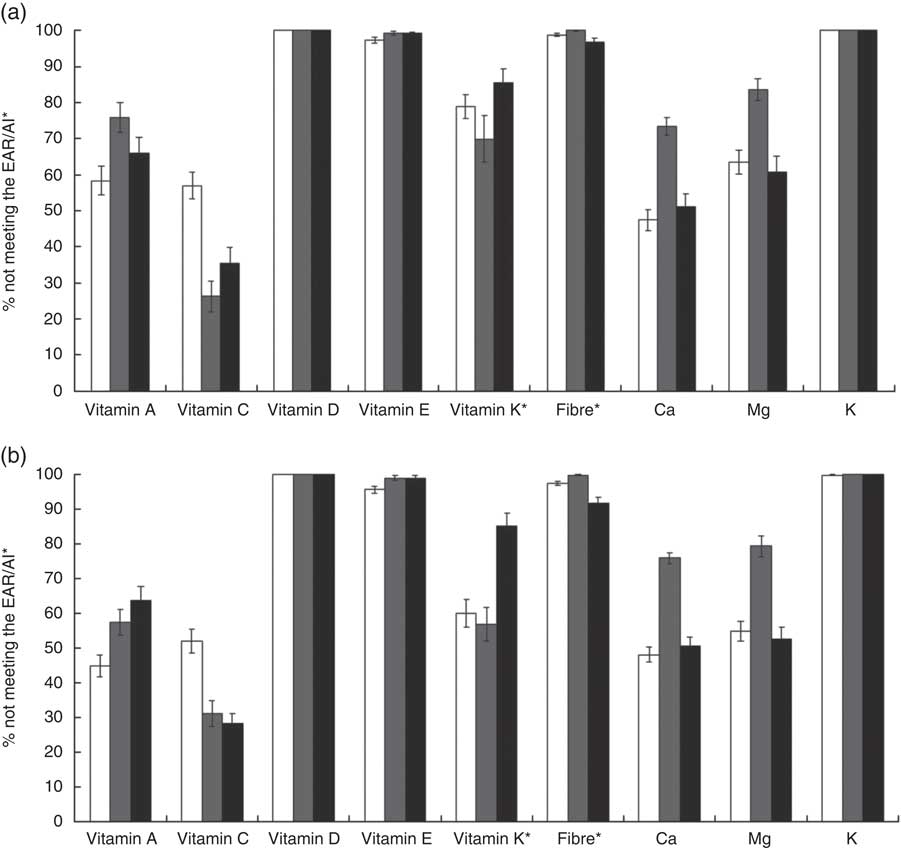
Fig. 2 Percentage of women aged (a) 19–30 years and (b) 31–50 years not meeting the Estimated Average Requirement (EAR) or the Adequate Intake (AI)* for selected nutrients, based on usual intakes from foods, according to race/ethnicity (![]() , White;
, White; ![]() , African American;
, African American; ![]() , Mexican American), National Health and Nutrition Examination Survey, 2003–2008. Data are presented as percentages not meeting the age- and gender-specific EAR or AI, with their standard errors represented by vertical bars
, Mexican American), National Health and Nutrition Examination Survey, 2003–2008. Data are presented as percentages not meeting the age- and gender-specific EAR or AI, with their standard errors represented by vertical bars
Comparison of nutrient intakes from foods and dietary supplements with recommended nutrient intakes
Although dietary supplement use is relatively low among women of childbearing age, we attempted to ascertain nutrient intakes not just from foods but also dietary supplements for six nutrients for which data were available. Supplement use varied from 19 % to 31 % depending on the nutrient studied. Whites showed the highest use of dietary supplements, with rates among Hispanic and African-American women half of those for Whites.
Table 6 shows the percentage of the EAR attained through supplements and foods for supplement users, non-users and the population as a whole. Generally, supplement non-users had lower nutrient intakes from foods whereas supplement users consumed more nutrients from foods, and the contributions that dietary supplements made to nutrient intake varied considerably by nutrient. Intakes of vitamin C, vitamin K, Ca and Mg were close to the EAR and supplement use improved intakes within this acceptable range. K intakes were low in general but the use of K supplements is not popular and therefore supplement use had a negligible impact on intake. For vitamin D, intakes from foods were less than 50 % of the EAR. Supplements enabled users to meet the EAR for vitamin D for all ethnicities.
Table 6 Percentage of the Estimated Average Requirement (EAR) reached for selected nutrients by ethnicity and source of nutrients for women of childbearing age, National Health and Nutrition Examination Survey, 2009–2010( 24 )

Discussion
Adequate nutrition before and during pregnancy has been well documented to beneficially influence several aspects of infants’ health and development. However, nutrition during the childbearing years is frequently neglected. Arimond et al.( Reference Arimond, Wiesmann and Becquey 35 ) reported that women of reproductive age living in the Philippines, Bangladesh, Burkina Faso, Mali and Mozambique had significant deficiencies across a range of micronutrients including Ca, Fe, niacin, folate, riboflavin and vitamin B12. Zhang et al. ( Reference Zhang, Zhang and Lin 3 ) also observed insufficient intakes of several nutrients, especially vitamin A, vitamin B12, Zn and folic acid, among Chinese women of childbearing age.
Among Malaysian women of childbearing age, Khor et al.( Reference Khor, Duraisamy and Loh 36 ) reported a higher prevalence of inadequate folate status based on both dietary intake and biomarker data. Likewise, Bailey and co-workers( Reference Bailey, Dodd and Gahche 37 ) recommended that folate intakes needed to be improved among US women of childbearing age and non-Hispanic Black women, because of low intakes from foods and dietary supplements. More recently, Darling et al. ( Reference Darling, Hart and Macdonald 38 ) reported that year-round vitamin D deficiency was extremely common among South Asian women of childbearing age living in the UK.
Our analysis of the NHANES 2003–2008 data set indicated that a considerable percentage of women of childbearing age in the USA, irrespective of ethnicity and age, were also not consuming the recommended amounts of several key nutrients from foods including fibre, vitamins A, D and E, K, Ca and Mg. This observation held true irrespective of whether nutrient intakes were compared with the EAR or the RDA. Furthermore, analyses of biomarker data for key micronutrients such as vitamins C, E and D, as well as Fe, reflected patterns of nutrient inadequacy consistent with lower nutrient intakes by ethnicity.
In reviewing the literature on the effect of dietary supplement use on meeting nutrient intake recommendations for a limited subset of vitamins and minerals in this age and gender group, dietary supplements were able to help women of childbearing age meet their EAR only for vitamin D. Data published by Fulgoni et al. on the US population aged 2 years and older also showed that vitamin D supplements make a significant contribution to many individuals not meeting the EAR( Reference Fulgoni, Keast and Bailey 18 ). Although it would be expected that dietary supplements improve nutrient intakes, they can only be of use if intakes are inadequate. For the other nutrients we assessed, mean nutrient intakes from foods were already close to the EAR, or the Adequate Intake (AI) in the case of vitamin K; therefore dietary supplements made a minimal contribution to meeting recommendations. On the other hand, although most women did not meet the AI for K, supplement use is not common: the AI of 4700 mg for K means that it is difficult for consumers to ingest a full day’s requirement in tablet form. A further confounding factor is that even without including intakes from dietary supplements, dietary supplement users tend to have better nutrient intakes in general, which tends to reduce the contribution that dietary supplements make to meeting nutrient recommendations. In a comprehensive analysis of the effect of various socio-economic and lifestyle factors on the status of water-soluble vitamins in the adult US population in general, Pfeiffer et al. found that the reported use of any dietary supplement in the previous 30 d was associated with improvements in biochemical markers of vitamins B6, B12, C and folate status( Reference Pfeiffer, Sternberg and Scheicher 39 ). Although the authors did not investigate age and gender subgroups, it is likely that dietary supplements would also improve biochemical measures of nutrient status in women of childbearing age( Reference Mearns, Kozoiol-McLain and Obolonkin 40 ). For nutrients where biochemical deficiency is common, supplements are likely to reduce the proportion deficient.
Collectively, these data suggest that the burden of inadequate nutrient intakes during the reproductive years is a global concern, even in a high-income country such as the USA. This is further compounded by the fact that many pregnancies are unplanned( Reference Henshaw 41 , Reference Czeizel 42 ) and that these women are less likely to be nutritionally prepared for pregnancy and breast-feeding.
The use of dietary supplements among females of childbearing age is low and in fact significantly lower among women with unintended pregnancies, as well as among African-American and Hispanic women( Reference Kurinij, Klebanoff and Graubard 43 ). For example, Kurinij and colleagues found that only 25 % of the 3277 women of childbearing age involved in the NHANES survey used dietary supplements on a regular basis( Reference Kurinij, Klebanoff and Graubard 43 ). Moreover, supplement users had a higher income and education and better nutritional status, were more likely to be White and had a leaner body composition. Indeed, these data are still reflective of current-day supplement users. Based on the accumulating evidence of inadequate micronutrient intakes and the recognition that many pregnancies are unplanned, the Government of Canada promotes vitamin supplements for all women who could become pregnant( 44 ), and the US Preventive Services Task Force recommends folic acid supplements for women of childbearing potential( 45 ). Additionally, our findings, along with those previously published, suggest that dietary supplement use, fortification and/or enrichment of foods may be an important means of overcoming nutrient inadequacies( Reference Fulgoni, Keast and Bailey 18 , Reference Fleischman and Oinuma 46 ).
Furthermore, we also observed that ethnicity was a key factor influencing nutrient intakes among women of childbearing age. African-American women typically had the lowest intakes of several of the micronutrients, in particular fibre, folate (as dietary folate equivalents), vitamin A, vitamin D, riboflavin, Ca, K and Fe. These findings are consistent with those reported by Siega-Riz and Popkin( Reference Siega-Riz and Popkin 47 ) who evaluated nutrient intakes in women of childbearing age and with low socio-economic status, from 1977 to 1996. Gennaro et al.( Reference Gennaro, Biesecker and Fantasia 48 ) also reported that intakes of several micronutrients and protein from foods were inadequate among African-American women during pregnancy. Tinker et al.( Reference Tinker, Cogswell and Devine 49 ) reported that of the ~24 % of women of childbearing age meeting recommended usual intakes of folic acid, the majority were Whites, followed by Mexican Americans and African Americans.
On the other hand, the greatest number of women in the present data set not meeting the recommendations for vitamin K was found in Mexican Americans. Little attention has focused on vitamin K intake, especially during the childbearing years. As with Ca and vitamin D, there appears to be a link between vitamin K, skeletal integrity and osteoporosis( Reference Lanham-New 50 , Reference Kim, Kim and Sohn 51 ). Why so many Mexican-American females of childbearing age had vitamin K intakes less than the recommendation is not known. As reported by the National Institutes of Health, the incidence of hip fractures among Hispanics is on the rise and Hispanic women are twice as likely as Caucasian women to develop diabetes, which may increase their risk for osteoporosis; this may be caused in part by poorer vitamin K intakes( 52 ).
Although women 19–30 years of age had lower nutrient intakes, when evaluating the influence of PIR on nutrient intakes, PIR appeared to selectively influence the intake of almost all nutrients only among 31–50-year-old women of childbearing age. Bae( Reference Bae 53 ) found that older pregnant women had healthier lifestyle behaviours than younger women in a study located in Seoul, so lower nutrient intakes in younger women in our data may reflect poorer adherence to dietary recommendations. A PIR below a certain threshold reflects eligibility for means-tested government-sponsored assistance programmes such as WIC. Miller et al.( Reference Miller, Pollack and Williams 54 ) and Woolf( Reference Woolf 55 ) recently reported that an individual’s financial situation typically takes priority over health, resulting in a tendency to eat poorly. Low household incomes may also force people to live in communities where nutrient-dense foods are more difficult to access( Reference Woolf 55 ).
There are several important strengths of the present study: (i) use of a large nationally representative sample of adults to assess total usual intakes of nutrients from foods with the National Cancer Institute method among women of childbearing age; (ii) comparison of nutrient intake data by EAR; (iii) accounting for the use of dietary supplements; (iv) inclusion of nutritional biomarker data where available; and (v) the stringent P value to ascertain the validity of significant differences. A limitation of the study was that nutrient intake estimates relied on a two-day 24 h dietary recall, and therefore these data may not be sufficiently representative of an individual’s usual dietary intake as compared with data obtained from multiple days of food records. Nevertheless, two-day 24 h dietary recall data have been shown to be an adequate measure of dietary intakes at the population level as part of a general population assessment( Reference Dwyer, Picciano and Raiten 56 ), similar to the analyses undertaken in the present study. Although the dietary supplement data and biomarker data were not obtained from the same data set as the food intake data, they provided an important assessment of total nutrient intakes among the US population of women of childbearing age, as well as by different ethnicities.
Our findings show for the first time that a large percentage of US women of childbearing age with different ethnic and income backgrounds are consuming a poor-quality diet with intakes well below that recommended for several key vitamins and minerals along with fibre. Additionally, biomarker data show that the prevalence of key micronutrient deficiencies appears to be influenced by ethnicity, with more African Americans and Mexican Americans being below the cut-off values. It could be possible that genetics may influence nutrient metabolism differently among different ethnicities, which may hence explain the differences in the biomarker data. There is no conclusive published evidence in this regard. Instead, it should be noted that these biomarker data closely paralleled nutrient intake patterns wherein vitamin D, vitamin E and Fe intakes from diet were considerably lower among African-American and Mexican-American women while vitamin C dietary intakes were considerably lower among White Americans. This supports that nutrient intakes from food and supplements is an important predictor of biomarker status. Moreover, we observed that dietary patterns among Americans have not changed much over the years, despite ongoing education, increased food availability and access, and continued supplemental programmes such as WIC and food stamps for lower-income women.
From a global perspective, our data support the hypothesis that US women of childbearing age may be exposed to multiple micronutrient inadequacies, similar to that reported for women in other parts of the world.
We hope that our findings will be sufficiently compelling for those focusing on nutrition science advocacy and policy in health-care settings, government, academia and private industries to identify approaches and solutions on narrowing and/or eliminating these nutrient gaps, especially among African Americans, Mexican Americans and those with low incomes. Women of childbearing age should be informed and educated about the unique metabolic and nutritional demands of this stage of life. The importance of adequate nutrient reserves prior to conception and the use of appropriate foods, including enriched and fortified foods, to meet these nutritional demands should be emphasized. Indeed, a recent survey among women of childbearing age reiterated that this nutritionally vulnerable group values education in the context of it being critical to improving maternal and fetal health( Reference Hollins Martin and Robb 57 ).
Conclusion
It is important for women of childbearing age to meet nutritional guidelines both for their own health, during the increased nutritional demands of possible pregnancy and lactation, and for the short- and long-term health of their offspring. Socio-economic and demographic factors influence food choices and resulting nutrient intakes, which can result in significant differences along income or ethnic lines. Community and public health nutrition interventions are most effective when they are targeted towards risk populations and knowledge of nutrients of concern in various sectors of the US population enables effective campaigns. Our analysis identified differences in nutrient intakes by ethnicity, namely that African Americans, and to a lesser extent Mexican Americans, tended to have lower intakes of selected nutrients including vitamins A, B6, C, D, E and K, riboflavin, thiamin, Ca, P, K, Fe, Mg and Cu. Minor differences were found between younger and older age groups of women of childbearing age. PIR affected nutrient intakes only in women aged 31–50 years; intakes of almost all nutrients were lower in women with a lower PIR. Nutrient biomarkers were used to strengthen results found for dietary data, and similar patterns were seen by ethnicity. Furthermore, analysis of supplement usage showed that only vitamin D supplements made a substantial impact on achieving an adequate intake in the population.
The present paper summarizes key micronutrient concerns for women of childbearing age and offers nutrition professionals perspective for designing effective interventions to improve the nutritional status of risk groups in the USA.
Acknowledgments
Acknowledgements: The authors thank Victor Fulgoni III, PhD, for conducting the statistical analysis of the NHANES 2003–2008 data from foods. Financial support: This work was supported by DSM Nutritional Products, LLC. The funders had no role in the design, analysis or writing of this article. Conflict of interest: None. Authorship: D.R. and J.K.B. contributed equally to the preparation of this manuscript. D.R. and J.K.B. formulated the research question, analysed the data and wrote the article. M.I.M. formulated the research question. K.M.C.-N. contributed to the writing of the article. Ethics of human subject participation: The National Center for Health Statistics Research Ethics Review Board (Hyattsville, MD, USA) approved the study.


