


1. Study Area
The Tarim basin, with a total area of about 1.02 × 10⁶km2, in the southern part of the Xinjiang Autonomous Region, is the longest inland river basin in China. It is composed of the Tarim river and nine tributaries, the Akesu, Kaxgar, Yarkant, Hotan, Kaidu-Konqi, Dina, Ogan, Keriya and Qarqan rivers (Reference MaoMao, 2001). The Tarim river has a total length of 2350 km, measured from the source of the Yarkant river that originates on the north slope of the Karakoram mountains. Its main stream extends 1321 km, flowing around the western and northwestern edge of the Taklimakan desert (Fig. 1). It lies in a continental warm-temperate and arid zone. There is no runoff generated within the main stream area, because of the high evaporation (1125−1600 mm a−1) and extremely low precipitation (17.4−42.8 mm a−1) (Reference MaoMao, 2001). The surface runoff is mostly generated from highly glacierized areas and grassland/forest regions in the encompassing high mountain slopes of the Tien Shan, east Pamirs, Karakoram and Kunlun Shan. Reference YangYang’s (1991) estimation shows that glacial runoff in the basin amounted to 133.4 × 10⁸m3, 38.5% of the total discharge at the outlets of the Tarim river.
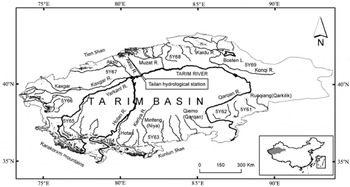
Fig. 1. Sketch map showing the river system and glacier distribution in the Tarim basin (5Y** represents codes of watersheds used in the CGI). Sketch used courtesy of Mi Desheng who produced the map.
Presently, only three tributaries, the Akesu, Hotan and Kaidu-Konqi rivers, provide water to the main stream due to intensive development and utilization of water resources in the other tributaries that flowed into the main stream in the early 20th century. With the continuous increase in water consumption from the main stream, the adjoining lakes and 320 km of the lower reach of the river have not received any water input since the 1970s, and Taitema lake, near the end of the river, disappeared in 1974. Consequently, desertification, ecological degradation and associated conditions became more and more serious in the lower reaches of the river (Reference Tan, Li, Cao, Wang, Wong and YanTan and others, 2004).
According to the China Glacier Inventory (CGI), there are 11 665 glaciers within the Tarim river basin. These have a total area and volume of 19877.7 km2 and 2313.3 km3, respectively, and account for 25.2%, 33.5% and 41.3% of the total number, area and volume of all glaciers in China (Reference Shi, Liu, Wang, Liu and YeShi and others, 2005). Glaciers in six major catchments, the Keriya, Hotan, Kaxgar, Yarkant, Akesu and Ogan rivers, comprise 97% of the total glacial area of the Tarim river basin, and the Hotan and Yarkant rivers account for 54% of the total glacial area. Accordingly, these highly glacierized catchments provide most of the glacial runoff to the Tarim river system.
2. Recent Climate Warming and Precipitation Increase
Reference ShiShi and others (2003) have suggested that the apparent transition from warm and dry to warm and humid conditions that has occurred during the last two decades is a strong indicator of climate change. Observations indicate that air temperature has increased at a rate of 0.2˚C per decade in the past 50years in western China, and especially rapidly during the 1980s–90s. The 1990s may be the warmest period not only in the past century but also in the past 1000 years. The average air temperatures of 128 stations during the period 1987–2000 rose by 0.7˚C compared with the period 1961–86 (Wang and Dong, 2002).
At the same time as air temperature began to increase, the precipitation trend switched from a decrease to an increase. The average yearly precipitation from 1986 to 2000 in western China increased by 23% compared with that from 1956 to 1986. During the period 1987–2000, precipitation increased by 11% in northern Xinjiang and 32% in southern Xinjiang relative to the period 1960–86 within the Tarim basin (Reference Hu, Jiang, Wang and FangHu and others, 2002; Reference Han, Xue and SuHan and others, 2003). The precipitation increase mainly occurred during winter, spring and summer during the 1990s, and decadal means increased by 45%, 33% and 28%, respectively, compared with the average in the whole observational period (Reference Song and ZhangSong and Zhang, 2003). However, precipitation during autumn decreased by 3%. Observations also showed that precipitation in the Tien Shan increased by 24% in winter and 16% in summer. As there are no meteorological stations in the glacierized area, it is assumed that glaciers received more snowfall in winter and spring prior to the late 1980s. Of 26 large rivers in Xinjiang, 18 that originate in the Altai Shan, the Tien Shan, the east Pamirs and Karakoram have experienced runoff increases of 5–40% over the period 1987–2000 compared to 1956–86. This increase is very evident in rivers from the south slope of the southwestern Tien Shan (Reference Zhang, Wu and WangZhang and others, 2003) as shown by the representative Tailan river (Fig. 2).

Fig. 2. Temporal variation of annual discharge at the outlet of the Tailan river, south slope of southwestern Tien Shan.
In addition to the influence of increasing precipitation, significant runoff increases within most rivers could be the result of an increase in glacial runoff due to enhanced warming, leading to glacier melting. Such an increase is directly related to the proportion of glacial runoff supply in a watershed (Reference YangYang, 1991). However, we have no knowledge of glacier changes and their influence on river runoff in most parts of northwest China since glaciers with long-term monitoring are scarce, and observations of glacier changes at a regional scale are poor. Therefore, we selected the Tarim river basin as an experimental basin to study glacier changes during the last 50 years using remote sensing and Geographical Information System (GIS) techniques, in order to understand how glaciers respond to the recent warming and increased precipitation. After analyzing data of glacier variations based on short-term field observations and longterm hydrometeorological data in the study region, we further discuss the possible impact of glacier variation on water resources in the basin.
3. Glacier Changes in the Tarim River Basin
3.1. Data and methods
In our study, we used topographical maps (1 :100 000) based on aerial photographs acquired during the 1960s and 1970s, and Landsat Thematic Mapper (TM) and Enhanced Thematic Mapper Plus (ETM+) images obtained from 1999 to 2001, although this study is limited by the lack of Landsat TM and ETM+ images in the southeast area of the basin (Fig. 3). The methods of image processing and glacier boundary extraction are the same as used by many different authors in China (e.g. Reference LiuLiu and others, 2002, Reference Liu, Sun, Shen and Li2003, Reference Liu, Shangguan and Ding2004; Reference Lu, Yao, Liu, Ding and LiLu and others, 2002; Reference Shangguan, Liu, Ding, Ding and LiShangguan and others, 2004a, Reference Shangguan, Liu, Ding and Dingb). All satellite images were geometrically corrected to topographical maps and projected into the Krosovsky spheroid and Albers equal-area conical projection (Fig. 3), then all the corrected images were orthorectified to a digital elevation model (DEM) with 90m resolution in order to remove the shadow effect of high mountainous ridges. In general, errors of geometrical correction are about one pixel, and the error is about 31.5 m for the Landsat TM image determined by randomly selected independent points other than ground-control points used for the geometrical correction. Glacier boundaries on the corrected images were identified through visual interpretation. The boundary of the termini of debris-covered glaciers was recognized usually based on the geomorphological pattern in the image draped over a DEM. Commercial GIS software was applied to such identification and vectorization of glacier boundaries. Glacier boundaries during the 1950s to 1970s were vectorized from topographical maps modified with careful reference to the information from the CGI. The attribute data consisting of more than 27 elements for a glacier vectorized from such maps were obtained from the glacier inventory, with relevant corrections for area, length, etc., based on this vectorization. Glacier changes during the time-span were then obtained by applying the overlay function of GIS software. The error for extracting glacier changes in this way is commonly about 90 m, considering errors in image correction and visual interpretation which vary from one to two pixels. Using this procedure, we obtained data for more than 3000 glaciers, excluding those with length changes <90m.

Fig. 3. Comparison of glacier distribution in the periods 1960s–70s (blue polygon) and 1999–2001 (Landsat TM/ETM+ composite image with bands 4 (red), 3 (green) and 2 (blue)) in the Tarim river basin.
3.2. Glacier change in the past 40 years
We acquired data for 3081 glaciers with a total area of around 1 x10⁴ km2, accounting for 50.3% of the total glacial area and 26.4% of the total number of glaciers in the Tarim river basin (Table 1). Considering the total glacier area, our sample reflects the general status of glacier variations in the basin. Our results show that over recent years, though some glaciers were advancing, most were retreating (73.9%). Comparing the amount of glacier advance to the amount of glacier retreat, there was a net decrease of 4.6% in the total area during the 1960s–70s. Glacier retreat is thus the dominant phenomenon, which can be attributed to the influence of recent climate warming. As for glacier changes in each tributary, glacier retreat was significant in the Kaidu river flowing from the south slope of the middle section of the Tien Shan, and the Gez river originating in the eastern Pamirs. These two basins have lost 11.6% and 10% of their total glacier areas, respectively. Glacier changes were less distinct in the Akesu river in the southwestern Tien Shan and the Hotan river on the north slope of the western Kunlun Shan, where the area reduction was 1.4% and 3.3%, respectively, and 32.9% of all the measured glaciers were advancing. These differences are also reflected by the percentage area of retreating and advancing glaciers vs the total measured glacier area in each river tributary. The area of retreating glaciers in the Akesu river is only 7.9% of the total measured glacier area in the river basin, but that in the Yarkant river is as high as 81.2%. Generally speaking, the area of retreating glaciers in every tributary is >50% of the total area of studied glaciers except for the Akesu river. The results show that the shrinkage of small glaciers is dominant in the Akesu river basin, while almost all glaciers in the Yarkant and other rivers were retreating.
Table 1. Glacier changes in the main tributaries of the Tarim river basin in the past 40 years; note that we only include glaciers with absolute length changes >90 m

4. Influence of Glacier Change on Water Resources
Glacier changes significantly affect variations of water resources, including variations of net ice volume and of glacial runoff amounts due to changes of surface area for runoff generation because of terminus shrinkage. In this section, we present a brief discussion of each aspect.
The ice volume of a glacier is estimated based on a modified equation suggested by Reference Liu, Sun, Shen and LiLiu and others (2003). The equation is V= 0.04 S 135, where Vis the ice volume (km3) and S is the area (km2) of a glacier. This empirical equation was derived from ice-penetrating radar thickness measurements of six valley glaciers, five cirque glaciers, one hanging glacier, one ice cap and three cirque-hanging glaciers (area 0.46−165 km2) in the Tien Shan and seven glaciers (area 0.1−7 km2) in the Qilian Shan, as well as measurements in the Qinghai-Tibetan Plateau. On the basis of the area of shrinkage of the glaciers in the basin (Table 1), the estimated total ice volume of the monitored 3081 glaciers generally decreased by 35.5 km3, or 319.3 × 10˚ m3 w.e. (assuming an ice density of 900 kg m−3). The ice loss is 1.2 times the total discharge from outlets of the Kaidu, Ogan, Akesu, Kaxgar, Yarkant and Hotan rivers (Reference ZhouZhou, 1999). The annual mean decrease was 8.9 x10⁸m3 from 1963 to 1999, corresponding to the average annual discharge observed at the Keleke hydrological station on the upper Gez river in the east Pamirs.
Good statistical relationships can be found within the dataset of 3081 glaciers regarding the change in glacier area and the decline in glacier volumes between the early 1960s and 1999/2001. To reflect the relationships in sufficient detail, we divided the sample glaciers into three size groups, i.e. <1, 1−5 and >5 km2 (Table 2). With these groups, we can estimate changes of the non-monitored glaciers in the Tarim river basin during the same period. The estimated total reduction in the area and volume of glaciers in the whole basin from the early 1960s to 1999/2001 is 1307.2 km2 and 87.1 km3, respectively, equivalent to 6.6% and 3.8% of the early 1960s area and volume. The ice loss corresponds to an average thinning by 3.8 m of all glaciers in the basin. The ice volume decrease approximates 783.5 × 10⁸m3w.e., which is twice the average annual discharge of the main river tributaries of the Tarim river basin (Reference XiaXia, 1998). On average, glaciers in the Tarim basin provided an extra 21.8 × 10⁸m3 of meltwater annually, about 5.7% of average annual discharge of the Tarim river.
Table 2. Statistical relationships between glacier areas and volumes in the early 1960s and 1999/2001 in the Tarim river basin. S TM and V TM are glacier area and volume respectively in 1999/2001; S MAP and V MAP are glacier area and volume respectively in the early 1960s; units are km2 for area and km3 for volume

The Tailan river lies on the south slope of the southwestern Tien Shan and is a tributary of the Akesu river. Close to the outlet of the river is the Tailan hydrological station (41˚83’ N, 80˚30’ E; 1550 m a.s.l.; see Fig. 1) which monitors a drainage area of 1324 km2. Within the catchment, the glacierized area is 432.9 km2, and the glacier meltwater provides a large proportion (about 60%) of the total runoff of the river. In situ glaciological and hydrological observations at the terminus of Qiong Tailan glacier, a 108 km2 glacier at the head of the Tailan river, were conducted during 1977 and 1978 (Reference Kang, Zhu, Huang, Su and GaoKang and others, 1985). According to data from a hydrological station located 1 km below the glacier terminus (here referred to as the Tailan glacier station (2981 ma.s.l)) and ablation measurements at different elevations on the glacier, calculations reveal that the runoff modulus of the glacier during May-September is 0.1 m3 s−1 km−2 above the Tailan glacier station, and 0.061 m3 s−1 km−2 above the Tailan hydrological station. The estimation shows that glacier meltwater supplies 74% of river runoff above the Tailan glacier station and 57.7% of river runoff above the Tailan hydrological station.
To discuss the impact of glacier change on river runoff or water-resource variations in the Tailan river, we applied a degree-day ablation model to estimate glacial runoff in the river. Firstly, we extracted the altitudinal area of each 100 m elevation band from a DEM of 90 m resolution and produced the area hypsometry of all the glaciers in the Tailan river basin (Fig. 4a). Then we calculated the degree-day factors derived from stake measurements at different elevations (34 stakes were placed at elevations between 3150 and 4400 m) along the Qiong Tailan glacier and meteorological data at the Tailan glacier station during 1977 and 1978. Combining air-temperature data of the Tailan hydrological station and the Aksu weather station from 1957 to 1998 and short-term temperature data (to determine the lapse rate during the summer season) in the glacier area, we can calculate glacial runoff during the time-span 1957−98 by assuming the degree-day factors apply to corresponding elevations of other glaciers without measurements, assuming that they do not change with time. Results indicate that the yearly variation of glacial runoff at the outlet of the Tailan river coincides well with that of the river runoff (Fig. 4b). Both glacial and river runoffs experienced the same trend ranging from diminished runoff in the early 1950s to increased runoff in the early 1980s, showing a synchronous response to the recent climate change. As indicated by the decadal mean runoff depth, the outlet runoff was more plentiful during the periods 1957−60 and 1991−98, whereas glacial runoff had positive anomalies during 1981 and 1998. Starting from 1981, the decadal anomalies of glacial runoff were 14.9 and 22.6 mm higher than the average glacial runoff, accounting for 4.5% and 6.6%, respectively, of the average from 1957 to 1998. The mean runoff depth in the 1990s, a high-flow decade, is 68 mm (12%) higher than average runoff during the observational period, and the increased glacial runoff is one-third of the total quantity of increased river runoff in the 1990s. Although the 1980s was a low-flow decade, glacial runoff showed an increase. This changing pattern indicates to a certain extent that the influence of glacier retreat on stream-flow has become stronger than ever before.

Fig. 4. (a) The hypsometry of glacier area in the Tailan river deduced from a 90 m resolution DEM. (b) The decadal anomaly of glacial runoff based on the calculation of a degree-day ablation model compared with the runoff anomaly at the Tailan hydrological station.
We may delineate the influence of glacier retreat on glacial runoff for a river basin as large as the Tarim river basin and validate, in another way, whether glaciers in the basin have lost the sum of ice masses that we derived from the remote-sensing method. In theory, glacial runoff variation is definitely closely related to intensified glacial ablation resulting from climatic warming. For a retreating glacier responding to climate warming, we can presume that glacier area decreases at a rate of the annual average of the total area reduction during the period considered. For all glaciers in the Tarim basin, however, we established a hypothetical glacier with an area elevation distribution calculated from the total area of glaciers in the basin and empirical equations suggested by Reference KuzmichenokKuzminchenok (1993). Glacier shrinkage occurred on the lower part of the hypothetical glacier, and the annual area decrease of the hypothetical glacier was equal to the averaged area reduction of all glaciers in the basin. Glacial runoff in each year on the retreating terminus of this hypothetical glacier can be calculated if we know the ablation intensity on its terminus. Publications document that there are more than 15 glaciers in western China currently being investigated, or monitored in different time periods in the past. Ablation has been measured on the terminus area of 15 of the investigated glaciers during field reconnaissance since the 1950s. The terminus elevations of these glaciers range from 2640 to 5450ma.s.l., and the annual ablation intensities on these glacier termini vary from 1.3 to 6.9 mw.e., with an average ablation depth of 3.5 m w.e. a 1 (Reference Zhang, Bai, Shi, Zhang and BaiZhang and Bai, 1980; LIGC, 1981−2002; Reference Kang, Zhu, Huang, Su and GaoKang and others, 1985; Zhang and Zhou, 1991; Reference LiuLiu and others, 1992, Reference Liu, Xie, Song, Ma and Ageta1996; Yao and Ageta, 1989; Reference Su and LiSu and Li, 1996; Reference Su, Wang and XieSu and others, 1998; Reference Kayastha, Ageta, Nakawo, Fujita, Sakai and MatsudaKayastha and others, 2003). Supposing the average annual ablation on the termini of these glaciers can represent the terminus ablation of glaciers in the Tarim river basin, the total meltwater generated is estimated to be 1.27 × 10⁸m3w.e. in the above-mentioned sub-area of glaciers where the annual ice loss was 36.1 km2. In the Tarim river basin, the cumulative glacial runoff calculated by this method amounted to 893.4 × 10⁸m3 from the entire glacier melt from 1963 to 2001 (Fig. 5). This amount of glacial meltwater will never be generated again after 2001 due to the complete disappearance of the ice masses. This sum of glacial runoff is almost the same as the total annual runoff of all rivers in Xinjiang territory. Such a loss of glacial runoff is of vital significance to water resources in the Tarim river basin where the water supply is extremely limited, directly impinging upon human activities and environmental preservation efforts. The calculated loss of total glacial runoff is 110 x 108m3 (or 14%) higher than the estimated volume decrease by the glaciological method used in ice volume estimation. The difference between the two totals possibly results from the extent to which the ablation intensity was not reflected in the calculated loss of total glacial runoff, since this is lower than the actual area of the glacier termini being lost in the basin. However, the similarity of the two estimations indicates that the volume-area relation is reliable enough to estimate the ice volume decrease of glaciers under retreat in the basin during the past several decades. In fact, this implies that the assigned ablation intensity is very close to the real average on glacier termini of the entire basin.

Fig. 5. Diagram showing the contribution of glacier shrinkage to glacial runoff in the whole Tarim river basin. (Annual runoff is the runoff generated by a sub-area of glacier terminus that disappeared during the year; cumulative runoff is the cumulative value of the annual runoff.)
5. Conclusions
The analyses presented in this paper allow us to draw three conclusions. First, most of the glaciers in the Tarim river basin have been retreating in the last few decades, with a smaller portion advancing. Glacier changes exhibit obvious regional differences within this large river basin because of the differences of glacier properties (dynamic response), local climatic settings and the amplitude of climate changes during recent decades. Glaciers in the east Pamirs and on the south slope of the central Tien Shan have experienced intensive wastage during the study period. Glacier retreat in the basin can be attributed to climatic warming in the past decades. Although, increased precipitation has occurred since the late 1980s, it has not reversed the glacier retreat. In other words, most glaciers are still retreating even though the climate has become warmer and wetter in the last two decades.
Secondly, the glaciers in the Tarim river basin have lost a total area of 1307.2 km2 from 1963 to 1999/2001, corresponding to a loss of ice mass of 87.1 km3, equivalent to about 6.6% and 3.8% of the area and volume in the early 1960s. The total decrease of glacier ice is equivalent to 783.5 × 10⁸m3w.e. and the annual decrease is 21.8 x10⁸m3.
Finally, a calculation using a degree-day model has been made for glacial runoff in the small glacierized Tailan river basin. This estimation has captured the changing runoff pattern influenced by climate change, especially the recent increase in glacial runoff due to the rise in air temperature after the late 1980s. This means that an increase in glacial runoff can be predicted to continue if the current warming trend persists. An experiment showed that the estimated wastage of ice masses in the whole Tarim river basin is reliable. For a large, highly glacierized basin, glacial runoff change due to glacier retreat is of great significance to water-resource variations, but we still need to understand how individual glaciers in different river basins respond to climate change and how glacier changes influence variations of glacial runoff and water resources.
Acknowledgements
We are indebted to J. Ferrigno for correcting the English, and to R. Forster for valuable comments and suggestions. We also acknowledge P. Mayes for editorial assistance. This research is supported by the National Natural Science Foundation of China (grant Nos. 90202013 and 40371026), the Knowledge Innovation Project of the Chinese Academy of Sciences (grant Nos. KZCX3-SW-345 and KZCX3-SW-339) and that of the Cold and Arid Regions Environmental and Engineering Research Institute (grant No. 2004102).


