


A common weakness of nutritional research is not being able to accurately assess the dietary intake of people in their home environments. To understand the impact of nutritional health in the population there is a need to understand and measure energy expenditure and intake accurately. Common techniques mainly include self-reported questionnaires and dietary records, which are subjective and known to have varying degrees of accuracy, and for this reason some have argued that all memory-based techniques should not be used in nutrition research and that objective measures should be developed in their place( Reference Archer, Pavela and Lavie 1 , Reference Dhurandhar, Schoeller and Brown 2 ). Estimates from a sample of adults aged 19–65 years participating in the 2000 UK National Diet and Nutrition Survey suggest that under-reporting occurs in up to 88 % of the sample depending on the method used to calculate under-reporting and the various sub-samples examined( Reference Rennie, Coward and Jebb 3 ).
Studies using the gold standard method of doubly labelled water (DLW) to measure energy expenditure (and, on the principle of energy balance, energy intake) have demonstrated under-reporting rates of between 2 and 59 % depending on the method of dietary assessment and population sample being studied( Reference Hill and Davies 4 – Reference Blanton, Moshfegh and Baer 7 ).
Propensity towards under-reporting using food records is far higher in obese compared with lean individuals( Reference Prentice, Black and Coward 8 – Reference Archer, Hand and Blair 11 ) (19 and 2 %, respectively( Reference Prentice, Black and Coward 8 )). Furthermore, evidence of weight loss during study periods indicates under-eating. This under-eating, along with the under-reporting observed in multiple studies, further complicates the accuracy of dietary recording and assessment methodologies( Reference Goris, Westerterp-Plantenga and Westerterp 12 ).
Other characteristics of under-reporters have been found to be relevant, including dietary restraint, sex, age, percentage body fat and attitudes to food( Reference Taren, Tobar and Hill 13 – Reference Berta Vanrullen, Volatier and Bertaut 15 ). Buhl et al. ( Reference Buhl, Gallagher and Hoy 16 ) and Lichtman et al. ( Reference Lichtman, Pisarska and Berman 17 ), for example, demonstrated under-reporting levels of between 47 and 59 % in individuals with high dietary restraint.
Use of DLW to measure dietary intake would allow accurate measurement of dietary energy expenditure (and, on the principle of energy balance, energy intake); however, this is not feasible in large studies or in clinical practice because of its high cost. Moreover, the only dietary variable measurable is energy intake and it does not provide any information about nutrient intake or eating behaviour.
Alternative novel dietary assessment methodologies such as audio-recording, electronic diaries, barcode catalogues and mobile device applications( Reference Thompson, Subar and Loria 18 , Reference Illner, Freisling and Boeing 19 ) are being developed to try to improve dietary intake recording. However, even in some of these innovative technologies, the burden on participants (to complete diaries or enter data into a system) remains and may therefore introduce individual bias and affect their eating behaviour( Reference Illner, Freisling and Boeing 19 ).
It is important to develop a non-intrusive method of recording dietary intake in order to gain a better understanding of nutritional intake and the food choices of the obese and overweight without introducing any bias or burden or relying on memory. We have recently developed a wearable sensor platform that provides detailed information about dietary habits. The sensor consists of a microphone and camera and is worn discretely on the ear. Sound features, such as chewing, are extracted in real time and the camera captures a video sequence( Reference Liu, Johns and Atallah 20 ). The purpose of this pilot study was to assess whether this platform would improve dietary assessment accuracy and whether the additional features of the camera add valuable information about dietary habits. The camera records video images of food consumed and has an in-built microphone that records sound transmitted through the jaw when eating and drinking. We hypothesised that use of the micro-camera device would improve the accuracy of energy intake assessment compared with a food diary alone, and that useful information would be provided on other aspects of dietary habits, including macronutrient intake and speed of eating.
Methods
Recruitment of participants
We recruited six healthy and willing volunteers from Imperial College London in 2012 by word of mouth (Table 1). This study was conducted according to the guidelines laid down in the Declaration of Helsinki, and all procedures involving human subjects were approved by the Imperial College Research Ethics Committee (ICREC/12/2/6). Written informed consent was obtained from all participants before commencement of the study. This pilot study was run in conjunction with another investigation using DLW to validate an ear-worn activity recognition device to measure energy expenditure described elsewhere( Reference Bouarfa, Atallah and Kwasnicki 21 ).
Table 1 Baseline characteristics of volunteers recruited to the study (Mean values and standard deviations)
IPAQ, International Physical Activity Questionnaire; F, female; M, male.
Anthropometry and RMR
Participants attended the Hammersmith Campus of Imperial College following an overnight fast on two occasions, once at the beginning and once at the end of the 14-d study period. At each visit, participants completed the International Physical Activity Questionnaire (IPAQ) and had their weight and height measured. RMR was measured at each visit by indirect calorimetry using a ventilated hood (Gas Exchange Monitor; GEM Nutrition). After abstaining from strenuous exercise and alcohol in the 24 h preceding the visit, participants lay in the supine position for over 20 min after which RMR was measured for approximately 30 min in an isolated room. Before each test the calorimeter was calibrated with ‘zero’ (0·00 % O2 and 0·00 % CO2) and ‘span’ gases (20 % O2 and 1·00 % CO2) (BOC gases). RMR was defined as the mean of measurements taken during the final 20 min of the measurement phase.
Dietary recording: micro-camera
Each participant was provided with a micro-camera, which was worn on the ear (Fig. 1), to make audiovisual recordings during meal times for 3 of the study days (2 weekdays and 1 weekend day). The bespoke micro-camera had a wide-angle lens attached to the front of the camera to increase the camera’s view angle to 170°. Participants were given a demonstration of how to use the device and provided with written instructions. Recorded audiovisual files were downloaded when the cameras were returned at the final visit, at which time participants were also asked for feedback about their experience using the device using a scale of 1–5, where 1=strongly disagree and 5=strongly agree.

Fig. 1 Micro-camera device used in this pilot study, as worn over the ear.
Dietary recording: food diary
Participants were instructed by a trained researcher to complete a food diary for the duration of the study, recording all food and drink consumed at the time of eating. Mean daily energy intake throughout the 14-d study period was determined using dietary analysis software (Dietplan 6.0; Forestfield Software Ltd) using standard portion size estimations if details were not given. The food diary entries for the 2 d of micro-camera use were also analysed in Dietplan with and without access to the images from the audiovisual micro-camera recordings, which provided more detail regarding food type, exact portion size and order and speed of eating (examples shown in Fig. 2 and 3).
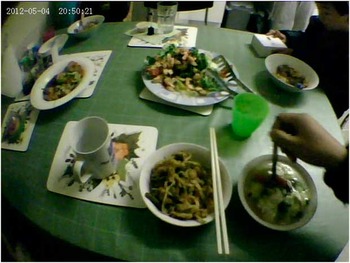
Fig. 2 Example of a micro-camera image accompanying an eating episode food diary entry, captured from the micro-camera audiovisual recordings.

Fig. 3 A time lapse video sequence of an 8-min eating episode of a rice with chashu pork lunch. Order of eating can be seen, as well as speed of eating.
Added value of micro-camera: macronutrient intake assessment
Macronutrient intake was also determined using dietary analysis software from the food diary entries completed on days the micro-camera was used.
Added value of micro-camera: eating rate
The length of each eating episode was measured using both the sound recordings and the video recordings from the micro-camera.
Doubly labelled water
At the first visit, on day 0, participants collected their second bladder void of the day and stored a 20 ml aliquot with the time of collection clearly noted on the bottle. Each participant then consumed the predetermined DLW dose comprising 55 g 10 at % H2 18O and 9 g 99·9 at % 2H2O. The container was rinsed with tap water and the contents drunk by the participants to ensure all the labelled water had been consumed. The unique code of the dose container was recorded, as was the time and date of its consumption. Further urine samples were collected on days 1, 2, 3, 7, 12, 13 and 14, and a 20 ml aliquot from each sample was stored in a clearly labelled, well-sealed, collection tube. Samples were stored in a refrigerator until returned to the research team when all samples were frozen at −20°C before analysis.
Analysis of urine samples
Samples were prepared for 2H analysis by continuous-flow isotope ratio MS (IRMS) according to the method of Scrimgeour et al. ( Reference Scrimgeour, Rollo and Mudambo 22 ). Urine samples were thawed completely, shaken and allowed to settle. Samples were prepared in triplicate. Urine (300 μl) was pipetted into 10 ml Exetainer glass tubes (Labco); Pt catalyst (Pt 5 % on alumina powder, 325 surface area 4250 m2/g, Sigma Aldrich) in plastic cups (150 μl; Chromacol) was added to each vial, taking care not to wet the catalyst. Each tube was capped with a new screw cap. Reference waters (0 and 310 parts per million (ppm) excess 2H) and two quality control waters were prepared and analysed with each batch of unknown samples. Exetainer vials were placed on a 220 place manifold, where they were each flushed with equilibration gas for 1 min (20 % H2 in He, Specialty Gases; Air Products). Tubes were left to equilibrate at room temperature for 72 h before analysis. During this time the 2H in the water phase equilibrates with the H2 in the gas phase. The abundance of 2H in the gas phase was measured using a continuous-flow IRMS (20-22 Hydra; PDZ Europa). The abundance of 2H in the urine sample and gravimetric dilutions of the tracer solution were calculated with reference to the known abundance of the reference waters.
Samples were prepared for 18O analysis according to the method of Prosser et al. ( Reference Prosser, Brookes and Linton 23 ). Following 2H analysis, the same sample and standard water tubes were flushed in turn with CO2 equilibration gas for 1 min (3 % CO2 in N, Specialty Gases; Air Products). Reference waters (0 and 160 ppm excess 18O) and two quality control waters were included with each sample batch. Samples were left to equilibrate for 24 h at ambient temperature. The abundance of 18O in the gas phase was measured by continuous-flow IRMS (AP 2003; Analytical Precision). The 18O abundance of patients’ samples was calculated with reference to the known abundance of the reference samples.
Calculation of total energy expenditure
‘Multipoint’ calculations were used to derive turnover rates and initial enrichments of each isotope, to estimate CO2 production and total body water (TBW), respectively. Schoeller’s equation for estimating total energy expenditure (TEE) was used in the form given by Goran et al. ( Reference Goran, Poehlman and Danforth 24 ). A resampling procedure was used to estimate the errors in TBW and TEE measurement( Reference Wolfe 25 ). TBW averaged 38·8 kg with an error of (sd 0·11) kg and a CV of 0·29 %. Fat-free mass averaged 53·0 kg and body fat averaged 25·1 kg. Average TEE was 12·7 MJ/d and TEE error, estimated by the resampling procedure, averaged 2·4 % (sd (0·30) MJ/d). The ratio of tracer elimination rates was normal (k O:k H=1·315, sd (0·076)) and the average 2H:18O distribution volume or pool space ratio was 1·038 (sd 0·010).
Estimated energy expenditure and predicted energy intake
Predicted values for TEE were derived from predicted resting energy expenditure values( Reference Schofield 26 ) multiplied by 1·5. This prediction derives from the lifestyle category defined as ‘Seated work with no option of moving around and little or no strenuous activity’ given a physical activity level range of 1·4–1·5 by Black et al. ( Reference Black, Coward and Cole 27 ). Predicted energy intake equalled predicted TEE as subjects were weight stable.
Data analysis
The GraphPad Prism 5 statistical package (version 5.01 for Windows; GraphPad Software, www.graphpad.com) was used for data analyses. Non-parametric analysis (including Wilcoxon’s signed-rank test) was carried out on the participant data given the small sample size (n 6). Parametric (paired t test) or non-parametric analysis (Wilcoxon’s signed-rank test) was performed on the food diary v. food diary plus camera data as appropriate (the distribution of the data was assessed using D’Agostino and Pearson omnibus normality test K2) to explore whether there was a difference between the mean energy intake from the food diary entry alone and the food diary record with the micro-camera images. Differences were considered significant at P<0·05. Bland–Altman plots were used to assess the level of agreement between estimated energy expenditure from DLW and estimated energy intake from 14-d food diary records and 2-d food diary records (both with and without the camera images), as well as a comparison between 2-d food diary records with and without camera images.
Results
Participant data
Over the 14-d study period, body weight (kg) and physical activity (IPAQ score) remained stable (median change in body weight 0·05 kg (interquartile range (IQR): −0·5 to +0·35 kg); P=0·8750, and the median IPAQ score change was 69 (IQR: −1565 to +1618), P=0·8438), with no change in physical activity category for any participants during the study period).
Although all participants who completed the study, one participant was removed from further analysis as the camera failed to record usable data. Of the five remaining participants, a total of 10 d worth of eating episodes were recorded completely using the micro-camera. This was equivalent to 2 d/participant out of the 3 d of attempted recording (due to limitations in the battery life of the camera).
Daily dietary records and micro-camera data
Mean estimated daily energy intake measured by 2-d food diary analysis was compared with measured energy expenditure from DLW analysis showing a statistically significantly different mean deficit of −3912 (sem 1996) kJ (P=0·0118), as shown in Fig. 4. This represents an under-reporting of energy intake rate of 34 % when compared with the gold standard of DLW. Estimated average energy intake from 2-d food diary entries in conjunction with micro-camera images was also compared with measured energy expenditure from DLW. Use of the camera in conjunction with the diaries improved the dietary assessment, reducing under-reporting of energy intake rate to 30 % with a mean deficit of −3507 (sem 2170) kJ (P=0·0225). A two-tailed paired t test comparing energy intake (kJ) estimated from food diary entries alone and food diary entries plus micro-camera images showed a significant difference between the estimated intakes (7757 v. 8162 kJ; P=0·0436). The differences between all measures of energy intake are shown in Fig. 5.

Fig. 4 Comparison of estimated energy expenditure and intake from various methods, including doubly labelled water (DLW, ![]() ), 14-d food diary (
), 14-d food diary (![]() ), 2-d food diary (
), 2-d food diary (![]() ) and 2-d food diary in conjunction with micro-camera recordings (
) and 2-d food diary in conjunction with micro-camera recordings (![]() ) (n 5). Significantly different: * P<0·05, *** P<0·001 (paired t test). Values are means, with their standard errors represented by vertical bars.
) (n 5). Significantly different: * P<0·05, *** P<0·001 (paired t test). Values are means, with their standard errors represented by vertical bars.
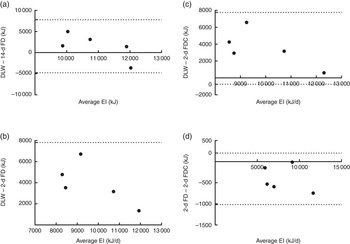
Fig. 5 Bland–Altman plots of energy intake (EI) measurements (average and difference between (a) doubly labelled water (DLW) and 14-d food diary (14-d FD), (b) DLW and 2-d FD, (c) DLW and 2-d food diary and camera (2-d FDC), and (d) 2-d FD and 2-d FDC). Dotted line represents ±2 sd from the mean (limits of agreement).
Use of the camera in its current state could have affected eating behaviours, as we saw a reduction in average reported energy intake on the 2 d when the camera was used compared with the average reported energy intake from the complete 14-d study period (7757 and 10 165 kJ, respectively). Feedback from participants confirmed that in its current state, although it was easy to use (average rating of 3, where 1=strongly disagree and 5=strongly agree), the device did affect people’s activities (rating of 4) and participants would not be comfortable wearing the device in public (rating of 4).
Added value of the micro-camera: macronutrient intake and eating rate
Macronutrient intake
As this pilot study did not employ the use of biomarkers of protein, fat or carbohydrate intake we could not assess validity of using one dietary assessment method over another; however, we did see an increased estimated intake of all three macronutrients when the micro-camera images were used alongside the food diaries compared with the food diary entries alone: carbohydrate intake (219 v. 242 g), protein intake (73 v. 79 g) and fat intake (66 v. 71 g).
Eating rate
The mean length of all eating episodes, length of meals and length of snacks are shown in Table 2. Although the sample size of this pilot study was too small to show any significant correlations, there is a trend towards faster eating being associated with higher energy intake.
Table 2 Speed of eating: mean length of all eating episodes, mean length of all meals and mean length of all snacking episodes (Mean values and standard deviations)
These results demonstrate under-reporting of all energy intake by assessment of self-reported dietary records compared with assessment of their intake from their dietary records in addition to images from the micro-camera. Use of the camera in its current form enhances dietary assessment using food diaries, improving estimated energy intake. It also may provide valuable information on macronutrient intake and eating behaviours such as speed of eating and order of eating.
Discussion
Accurate dietary assessment is an essential part of understanding and monitoring the diet at both the population and individual level. A major issue around current dietary recording and assessment methods is that they rely on the individual to recall and record their food intake and under-reporting is extremely common using the food diary method( Reference Archer, Pavela and Lavie 1 , Reference Rennie, Coward and Jebb 3 ). The classic method of dealing with under-reporting is by applying the Goldberg equation to identify outliers and remove them, which improves the quality of the data set while sacrificing quantity( Reference Black 28 ). We found an under-reporting rate of 34 % using food diaries as a method of dietary recording, compared with DLW. This was improved to 30 % by use of a micro-camera in conjunction with the food diaries, a similar improvement as seen in a recent review of image-assisted dietary assessments( Reference Gemming, Utter and Ni Mhurchu 29 ); however, both estimates represented a statistically significant deficit compared with the DLW method, most likely due to only 2 full days of dietary recording being collected per participant (typically a 3-d food diary including 2 weekdays and 1 weekend day is acceptable as most representative of energy intake while being manageable from a completion and compliance perspective). This under-reporting rate is, however, in line with previous literature and supports the need for improved dietary recording and assessment techniques.
Dietary recording methods also rely on accurate assessment of the portion size consumed by both the consumer/reporter and the assessor. Our results have shown that, by providing a written record of the foods eaten in conjunction with images of the same, the accuracy of assessment of the dietary recording can be improved. We acknowledge that this does not account for interpretation error in estimating intake by the assessor (in this case the dietitian analysing the food diary records and images), although it does remove much of the consumer/reporter error. Further studies would be needed to address the degree of error in the researchers’ interpretations of intake compared with actual dietary intake. Future research should also assess participants’ self-reported dietary intake and the interpretation of this by a trained nutrition professional in comparison with weighed food records as an accurate measure of actual intake.
There have been a number of reported studies using camera technology in dietary analysis( Reference Gemming, Doherty and Kelly 30 – Reference Rollo, Ash and Lyons-Wall 35 ), some of which have shown similar improvements in under-reporting; however, the majority of these studies involve the consumer capturing the image of the meal. Therefore, the choice remains as to whether the consumer records the eating episode and the problem of under-reporting also remains. These methods include the SenseCam (Microsoft), which captures digital images to use alongside a 24-h recall improving dietary recording of energy intake by 12·5 %( Reference Gemming, Doherty and Kelly 30 ), and a web-based food record, which reduced under-reporting to 20 %( Reference Hutchesson, Truby and Callister 31 ).
The need for active consumer use of a camera device also introduces bias by affecting behaviour – that is, whether to actually take the food or not( Reference Zepeda and Deal 36 ). For this study the micro-camera device does not yet remove user bias as it still requires subjects to turn the camera on to begin recording dietary intake and is currently limited by its battery life, needing regular charging. In fact, our results show that use of the camera in its current state could have affected eating behaviours, as demonstrated by a reduction in average reported energy when the camera was worn compared with that of the complete 14-d study period. We have developed the technology to upgrade the camera to allow automatic initiation of image capturing triggered by the sound of eating and to extract images of the eating episode using sound recognition. This is discussed in a previous paper outlining the sound recognition and image extraction algorithm( Reference Liu, Johns and Atallah 20 ). Future work involves combining this development with a hardware upgrade to enable us to lengthen battery life. This will enable automatic activation on eating and drinking that will remove any user bias (the choice of whether the subject records the meal or not) and will provide a more accurate measure of dietary intake( Reference Liu, Johns and Atallah 20 , Reference Walker, Member and Bhatia 37 ).
Current literature is not conclusive, although it does suggest that speed of eating is positively related to body weight, amount of food eaten( Reference Viskaal-van Dongen, Kok and de Graaf 38 ) and energy intake( Reference Leong, Madden and Gray 39 , Reference Shah, Copeland and Dart 40 ); however, many of these studies have been carried out in small Asian populations and/or have used a self-reported eating rate (e.g. very fast, relatively fast, medium, relatively slow and very slow), making the results difficult to apply to the UK population. A recent systematic review and meta-analysis found that slower eating rate was associated with lower energy intake in comparison with a faster eating rate( Reference Forde, Smith and Robinson 41 ) and our pilot data seem to follow this trend. The advantage of the micro-camera method of recording eating rate is that, in a free-living environment, the length of the eating episode can be automatically captured as the recognition of the sound of eating triggers the activation of the camera.
The benefits of this micro-camera device are that it is small and easily worn on the ear, and is therefore non-invasive, whereas other devices are more obvious and onerous to wear or carry – for example, use of a mobile phone to capture images or wearing a camera in a box around the neck( Reference O’Loughlin, Cullen and McGoldrick 32 , Reference Six, Schap and Zhu 42 ). It captures videos from the viewpoint of the participant using it, of dietary intake episodes that can be used by the researchers to look at many aspects of eating behaviours – for example, rate of chewing and eating speed, order of eating( Reference Liu, Johns and Atallah 20 ) as well as improving the accuracy of dietary recording and assessment.
In the longer term, the development of food recognition technologies would greatly enhance dietary recording methods; however, this is very challenging to achieve, given the enormous variety of foods available, their multiple shapes, forms and textures – for example, carrots could be mashed, raw or chopped – as well as cooking methods – for example, fried, boiled, steamed – which may or may not change their appearance and alter their nutritional value( Reference Kong and Tan 43 ).
Conclusion
Use of micro-camera imaging in conjunction with food diaries improves the accuracy of dietary assessment; however, in its current format, it introduces user bias. There is a need to develop this automatic data-capturing technique to remove user and assessor bias.
Acknowledgements
The authors thank their colleagues at Imperial College for taking part in the study and the dietitians in the Nutrition & Dietetics Department at Hammersmith Hospital for their assistance with analysis of the food records. They also thank Sandra Small for doubly labelled water sample preparation at Scottish Universities Environmental Research Centre.
The study was supported by internal funding from Imperial College London.
The authors contributions are as follows: C. P., R. M. K., J. L., T. P. and G. F. designed the study; C. P. and R. M. K. conducted the research; C. P. performed the statistical analyses of the data and wrote the manuscript. All authors reviewed and approved the final manuscript.
The authors declare no conflicts of interest.


