INTRODUCTION
Authoritarian regimes hold elections for different reasons than their democratic counterparts. Rather than serving as mechanisms to regulate the competition for power, non-democratic elections act as means to distribute the spoils (Blaydes Reference Blaydes2011; Magaloni Reference Magaloni2006), mitigate intra-regime conflicts (Boix and Svolik Reference Boix and Svolik2013; Geddes Reference Geddes2006), or solve information problems (Brownlee Reference Brownlee2007; Cox Reference Cox2009; Lust-Okar Reference Lust-Okar2005; Malesky and Schuler Reference Malesky and Schuler2011). But the ultimate value of these elections lies in the incumbents’ ability to enhance public legitimacy and regime stability in parallel. To distinguish them from mere ceremonies, authoritarian elections should provide a basic level of fairness to encourage participation from the opposition. At the same time, these elections should safeguard the outcome by giving the ruling elite the subtle control over the electoral process. Any movement away from this equilibrium leaves the incumbent vulnerable to either an electoral defeat or protests against fraud (Gandhi Reference Gandhi2008; Magaloni Reference Magaloni2008; Schedler Reference Schedler2013).
In hegemonic party regimes, the dilemma between encouraging electoral competition and trying to curb the outcome is particularly relevant. The stability of these regimes depends upon their capacity to balance concessions to the opposition with the fine control of electoral institutions. However, while incumbent parties can achieve these goals by tailoring electoral rules to their benefit (Díaz-Cayeros and Magaloni Reference Díaz-Cayeros, Magaloni and Colomer2004; Higashijima and Chang Reference Higashijima and Chang2015; Levitsky and Way Reference Levitsky and Way2010), they often end up relying on fraud (Birch Reference Birch2012; Little Reference Little2015; Rozenas Reference Rozenas2015; Simpser Reference Simpser2013). If hegemonic parties contravene the rules they created in first place, the role of electoral institutions in concealing electoral irregularities is unclear. Do electoral rules in non-democratic regimes shape the opportunities for fraud, or are they a mere façade for electoral manipulation?
This paper explores the role of electoral institutions in concealing manipulation using new data on the 1988 presidential election in Mexico. This election is often taken as an example of the way hegemonic parties rely on fraud despite their overwhelming control of the electoral administration. Nevertheless, the ways and the scope of electoral manipulation in this event remain unknown. I focus on the opportunities to alter the vote tallies after an electoral reform that allowed district officials to amend the results, preventing any legal objection from the opposition. While these provisions yielded the formal opportunities to manually alter the results, the official candidate’s surprising lack of popularity behooved the incumbent party to rely on the governors of each state, who each had the ultimate task of coordinating and monitoring the electoral operation. I analyze the variation of fraud at the sub-national level by considering the governors’ electoral experience and personal ties to the presidential candidate. Working at the interface between formal and informal politics, I look for the constraints and opportunities involved in manipulating the election results during the vote-aggregation process.
I document the extent of aggregation fraud in the election by using a novel database with images of more than 50,000 vote tallies available for the election. Applying Convolutional Neural Networks (CNN)—a computer-aided detection system used for image-recognition problems—I identify blatant alterations in about a third of the vote tallies in the country. A complementary analysis suggests that these alterations were more likely to occur in tallies from polling stations where the opposition was absent and in the jurisdictions of governors who had either personal ties to the official candidate or expertise in leading electoral operations for the ruling party.
This paper sheds light on the opportunities available for electoral fraud during the vote-aggregation process (Callen and Long Reference Callen and Long2015; Ferrari and Mebane Reference Ferrari and Mebane2017; Myagkov, Ordeshook, and Shakin Reference Myagkov, Ordeshook and Shakin2009). The results demonstrate that the inflation of vote returns occurred at the crossroads of the opportunities established by the electoral institutions and the capacity of governors to mobilize the election officials under their jurisdiction. These findings provide evidence for the existence of the formal and informal conditions for local officials to execute fraud (Martinez Bravo Reference Martinez Bravo2014; Mares Reference Mares2015; Reuter and Robertson Reference Reuter and Robertson2012; Ziblatt Reference Ziblatt2009).
This study also assesses the integrity of the vote tallies by introducing a CNN model that can be used in the analysis of other contemporary elections. The proposed approach complements recent developments that look for statistical anomalies in vote returns (Beber and Scacco Reference Beber and Scacco2012; Mebane Reference Mebane2015; Myagkov, Ordeshook, and Shakin Reference Myagkov, Ordeshook and Shakin2009; Rozenas Reference Rozenas2017). In particular, this work is most similar to the few works applying machine learning to identify patterns of electoral manipulation (Cantú and Saiegh Reference Cantú and Saiegh2011; Levin, Pomares, and Alvarez Reference Levin, Pomares, Alvarez and Michael Alvarez2016; Montgomery, Olivella, Potter, and Crisp Reference Montgomery, Olivella, Potter and Crisp2015). However, I depart from the aforementioned literature by using the images of the tallies, rather than their vote sums, to understand the data-generating process behind the electoral irregularities.
The final contribution of this article is the documentation of an overlooked electoral irregularity in an oft-cited case that epitomizes how incumbents control non-democratic elections (Chernykh and Svolik Reference Chernykh and Svolik2015; Levitsky and Way Reference Levitsky and Way2010; Schedler Reference Schedler2002a). Prior research on the 1988 election in Mexico had focused on its consequences for the country’s gradual democratization process (Bruhn Reference Bruhn1997; Eisenstadt Reference Eisenstadt2004; Greene Reference Greene2007; Magaloni Reference Magaloni2006). Nevertheless, to this date, there is little comprehensive evidence of the existence and scope of fraud in this election. This paper analyzes for the first time the results from all the polling stations that were open on July 6, 1988, and it shows that most of the electoral irregularities took place at the district councils.
The structure of the rest of the paper is as follows. The second section provides a brief contextual background for the 1988 Mexican elections, describing the structural and institutional conditions for this event, as well as describing the main irregularities documented in the literature. The third section defines the conditions in which aggregation fraud is more likely to occur, providing qualitative evidence from the study case. The fourth section describes the methodology and presents the results of the classification of all of the images in the database. Using this classification as the dependent variable, the fifth section proposes the theoretical expectations and explores the determinants of this fraud technology. Finally, the sixth section summarizes the findings and provides suggestions for future research.
MEXICO 1988
Contextual Background
For most of the twentieth century, elections in Mexico were an instrument for the official party to “rule perpetually and rule with consent” (Przeworski et al. Reference Przeworski, Alvarez, Cheibub and Limongi2000, 26). Although multiparty elections were held uninterruptedly, a complex system of formal institutions and informal arrangements enabled the Institutional Revolutionary Party (PRI) to win all the Senate, gubernatorial, and presidential elections from 1929 to 1988 (Johnson Reference Johnson1978; Langston Reference Langston2017; Scott Reference Scott1964). The strength of the official party relied on the legitimacy gained by competing in elections and the uneven playing field for the opposition parties (Levitsky and Way Reference Levitsky and Way2010; Schedler Reference Schedler2002a, 37).
By the second half of the 1980s, however, the PRI’s invincibility began to wane. The popularity of the official party gradually fell as a new generation of urban citizens, unfamiliar with the country’s economic boom 30 years earlier, reached the voting age (Craig and Cornelius Reference Craig, Cornelius, Mainwaring and Scully1995). The erosion of the regime’s public support intensified with the financial crisis of the early 1980s, which saw it lose support from popular sectors and the business people (Bruhn Reference Bruhn1997; Haber et al. Reference Haber, Klein, Maurer and Middlebrook2008). Discontent with the government and the official party became evident during the 1985 legislative election, where the PRI’s vote share dropped to a new low of 64% (Molinar Reference Molinar1991).
And yet, the most critical weakening factor for the regime may have sprung from within the PRI itself. In the early 1980s, a group of party members with more technical skills than political experience began occupying top positions in the federal administration (Camp Reference Camp2014). The gradual influence of this group within the party faced hostility from the traditional political bosses, who opposed the new pro-market policies promoted by the government (Langston Reference Langston2017). The intra-party disagreements escalated in 1987 when a handful of prominent PRI members spoke out against the government’s orthodox measures to deal with the economic crisis and the lack of democracy within the party. When the president and party authorities did not attend to the demands, the dissident group left the PRI a year before the presidential election; this was the most critical split in the party since 1940 (Magaloni Reference Magaloni2006).
Electoral Process
The 1988 presidential race pitted the PRI’s candidate Carlos Salinas against two main candidates campaigning from opposite sides of the ideological spectrum.Footnote 1 On the left, a number of small parties and civic organizations created the Democratic National Front (FDN) to endorse Cuauhtémoc Cárdenas’s candidacy. Cárdenas, who led the PRI’s splinter a year earlier, aimed his campaign toward an electorate frustrated by declining living standards and governmental corruption (Bruhn Reference Bruhn1997). On the right, the National Action Party (PAN) nominated Manuel Clouthier, whose campaign targeted middle-class voters disappointed with the country’s economic policies (Shirk Reference Shirk, Middlebrook and Jolla2001). Facing unequal campaign resources and biased media coverage (Lawson Reference Lawson2002; Reding Reference Reding1988), both opposition candidates focused on mobilizing the protest vote and emphasizing that a PRI defeat was the first step toward democratizing the country (Domínguez and McCann Reference Domínguez and McCann1996).
As soon as the voting started on July 6, 1988, opposition parties and news agencies gave accounts of wide-ranging irregularities taking place throughout the country. The incidents included, for example, polling stations opening with an undue delay (New York Times 1988), stolen and stuffed ballot boxes (La Jornada Reference La Jornada1988b), and destroyed ballots marked for Cárdenas (Los Angeles Times 1988). Later that day, all opposition candidates signed a letter documenting these and other irregularities—such as absent election officials, inflated voter rolls, and voters casting multiple ballots—and asked election officials to “reestablish the legality of the electoral process” (Cárdenas, Clouthier, and Ibarra Reference Cárdenas, Clouthier, Ibarra and Graf1989).
Doubts about the legitimacy of the process escalated on the election night after electoral authorities suddenly stopped publishing the results. With only 2% of the vote tallies counted on election night, the preliminary results showed the PRI’s imminent defeat in Mexico City metropolitan area and a very narrow vote margin between Salinas and Cárdenas (Molinar Reference Molinar1991). These results triggered the anxiety of President Miguel de la Madrid, who—as he recognizes in his memoirs—instructed election officials to interrupt the public vote count (de la Madrid Reference de la Madrid2004, 816). A few minutes later, the screens at the Ministry of Interior went blank, an event that electoral authorities justified as a technical problem caused by an overload on telephone lines (Castañeda Reference Castañeda2000). Skeptical about the official explanation, opposition representatives urged election officials to continue with the public vote count after finding a computer in the building’s basement that continued to receive electoral results (Valdés Zurita and Piekarewicz Reference Valdés Zurita, Piekarewicz and Casanova1990). The sudden interruption of public information and the refusal of electoral authorities to release further results caused this incident to be referred to as “crash of the system,” suggesting that the interruption of the vote count allowed federal election officials in Mexico City to manipulate the final results.
Electoral authorities resumed the public vote count 3 days later, on July 10, when the official vote tabulation took place in each of the country’s 300 district councils. Later that day, officials announced the victory of the PRI’s Carlos Salinas with 50.4% of the vote, followed by Cárdenas with 31.1% and Clouthier with 17.1%. These results sparked multiple protests from opposition parties and citizens across the country. The confrontation over the official results, however, gradually weakened in part because of disagreements within the opposition (Gómez Tagle Reference Gómez Tagle and Casanova1990; Magaloni Reference Magaloni2010). This allowed the ratification of Salinas’s victory by the Chamber of Deputies on September 10, 1988.
AGGREGATION FRAUD
While there were multiple irregularities alleged for the 1988 election in Mexico, this paper focuses on identifying the alteration of the vote tallies by officials when the vote totals from polling stations were added up. This irregularity, referred to in other works as aggregation fraud (Callen and Long Reference Callen and Long2015), is a prevalent problem in many modern elections and is a top concern of election observers and international election experts.Footnote 2 Aggregation fraud is usually performed by a reduced number of middle-level officials with the expertise to carry out manipulations and who have close links with the candidates (Callen and Long Reference Callen and Long2015). In the case of the 1988 election in Mexico, the existence of this irregularity implies that the vote counts of the PRI’s candidate were inflated at the district councils after electoral authorities received the results from the polling stations and before the officials reported the district vote totals to the Ministry of Interior in Mexico City. The occurrence of fraud in the 1988 election brings into view an overlooked hypothesis for how electoral manipulation was carried out in this case.
The literature on electoral manipulation provides multiple accounts on how aggregation fraud is accomplished. Caro (Reference Caro1991), for example, offers an astonishing description of how the Democratic political machine in southern Texas altered a tally in Jim Wells County to give Lyndon B. Johnson 200 extra votes and flip the result of the 1948 Senate primary election. In a study of the 2003 presidential election in Nigeria, Beber and Scacco (Reference Beber and Scacco2012) find a similar handwriting style across multiple tally sheets and demonstrate that the last digits in the vote totals significantly deviated from the uniform distribution, a pattern suggesting the alteration of the electoral results. Myagkov, Ordeshook, and Shakin (Reference Myagkov, Ordeshook and Shakin2009) detail the inflation of vote returns in contemporary Russian elections and describe the incentives for local bosses to falsify the tallies under their jurisdiction. Callen and Long (Reference Callen and Long2015) compare the reported results of a random sample of polling stations at several stages of the 2010 parliamentary elections in Afghanistan and find discrepancies in the vote results in 78% of the observations.
Aggregation Fraud in Mexico’s 1988 Presidential Election
Before presenting the evidence of this irregularity for the case study, it is important to understand the institutional context for the opportunities of aggregation fraud in the 1988 election. Beginning at 6 p.m. on Election Day, poll workers counted the ballots and filled the vote tally in the presence of party representatives, who signed and got a carbon copy of the tally sheet. Once the vote count concluded, poll workers delivered the electoral material to one of the country’s 300 district councils, where election officials reported the preliminary results via telephone to the Ministry of Interior in Mexico City (Valdés Zurita and Piekarewicz Reference Valdés Zurita, Piekarewicz and Casanova1990). Despite the interruption of the national vote count, district councils continued receiving the tallies that were used 3 days later for the official vote tabulation.
The incentives for aggregation fraud in this election were shaped by an electoral reform in 1987 that shifted the control of the electoral process to the district councils.Footnote 3 On the one hand, the new electoral code recognized for the first time the legal standing of party representatives; expulsion of such representatives from a polling station constituted a reason to nullify the votes of the precinct (Barquín Reference Barquín1987, 52). This addition to the electoral code addressed one of the most reported irregularities since 1940 (Simpser and Hernández Company Reference Simpser and Hernández Company2014), and it strengthened the role of opposition parties to monitor the process, witness the tabulation, and document the electoral outcome of the polling stations. On the other hand, the law entitled district-level authorities to modify the results of any voting precinct in their jurisdiction (Klesner Reference Klesner1997, 44). In the case that opposition parties objected any amendment during the district vote count, the new code also provided the PRI with the default majority of votes in every district council, outnumbering those from the opposition by 12 to 19 seats (Valdés Zurita and Piekarewicz Reference Valdés Zurita, Piekarewicz and Casanova1990). In other words, the electoral reform gave the district councils the opportunity to recount the results with the assent of the official party, which—unlike the case in many polling stations—had the absolute majority for any decision. As Gómez-Tagle (Reference Gómez-Tagle and Harvey1993, 87–8) concludes, these conditions suggest that the greatest “adjustments” to the results should occur in the district councils.
Qualitative evidence suggests the way in which aggregation fraud took part during the tabulation of the votes a few days after Election Day. Óscar de Lassé, chief of staff in the Ministry of Interior (1982–8), admits the deliberate suspension of the public vote count, but corroborates that the official results announced by the ministry were based on what they received from the 300 district councils a week after Election Day. In his own words, “if (the results) were amended, those amendments occurred in the district councils, and not in the Ministry of Interior” (Anaya Reference Anaya2008, 263). José Newman, director of the National Electoral Registry in 1988, confirms that the tallies were unavailable to officials in Mexico City before the announcement of the results. He also acknowledges the amendment of the tallies as a common practice at the time. This strategy entailed, for example, having poll workers fill the tallies exerting low pressure with their writing instruments so the numbers could be later modified outside the polling stations.Footnote 4
The fact that the PRI had the majority of votes in every district council made it impossible for the opposition to prevent any irregularities from occurring during the district tabulation. For example, Preston and Dillon (Reference Preston and Dillon2004) describe the manipulation of vote tallies in the Second District of Puebla:
An official would page through the pile of precinct tallies one by one, calling out in a loud voice—in Spanish, cantando—the votes for each candidate as a secretary wrote the totals onto the district spreadsheet. (…) Each time Salinas’s votes from a precinct were read out loud, the PAN representative complained, the district committee secretary was adding a zero to Salinas’s total on the spreadsheet, changing 73 votes for Salinas to 730 votes, for instance. (p. 172)
Interviews with two representatives of the Mexican Socialist Party (PMS) in the Federal Electoral Commission (CFE) at the time confirmed this particular story. One of them recalls that the stenographic records in that district described the demand from all opposition parties to examine the discrepancy of the results, but the motion was turned down by the majority of PRI votes at the council. Both representatives later compared the results in the district and found a difference between the total number of votes for president and Congress of more than 70,000 votes.Footnote 5
The amendments to the tallies’ vote totals became evident when opposition representatives compared the results they recorded at the polling stations on Election Day with the few official results published at the polling-station level. Consider the following quote from a member of the Popular Socialist Party (PPS) describing the discrepancies between the results recorded by the party representatives at the polling stations and those reported by electoral authorities:
In polling station number 2, the PRI obtained 232 votes, as it appears in the certified copy provided to the political parties. However, Mr. Carlos Olvera, the president of the Electoral Committee in the District, submitted an apparent altered tally during the official vote count on Sunday the 10th, recording 1,422 instead of 232 votes. (…) In polling station number 3, the PRI actually got 184 votes, but the altered tally gives it 2,488. The real vote tally of polling station number 4 shows 154 votes for the PRI, but the false tally shows 720. Meanwhile, the real number of votes for the Popular Socialist Party was 240 but the false tally gave it only 140 (Senado de la República 1988, 115).
The most straightforward way to verify the validity of these anecdotes and evaluate the prevalence of such alterations would be to compare the votes in every ballot box with the results reported by election authorities. Unfortunately, this comparison turns out to be impossible as authorities only published the results at the district level and the government destroyed the ballots in 1992 (Magaloni Reference Magaloni2006). Nevertheless, a close inspection of the stored tallies for the 1988 election shows several instances of altered vote numbers, as Figure 1 shows. The examples at the top present crossed-out numbers as well as inconsistencies in ink color and handwriting. Meanwhile, the images at the bottom illustrate those altered tallies involving number insertions that have irregular slants and different pressure. Section C.2 in the Appendix provides additional examples of tallies with blatant alterations that changed the vote totals by significant amounts. The next section presents quantitative evidence for this irregularity and estimates the overall prevalence of the altered tallies in the election.
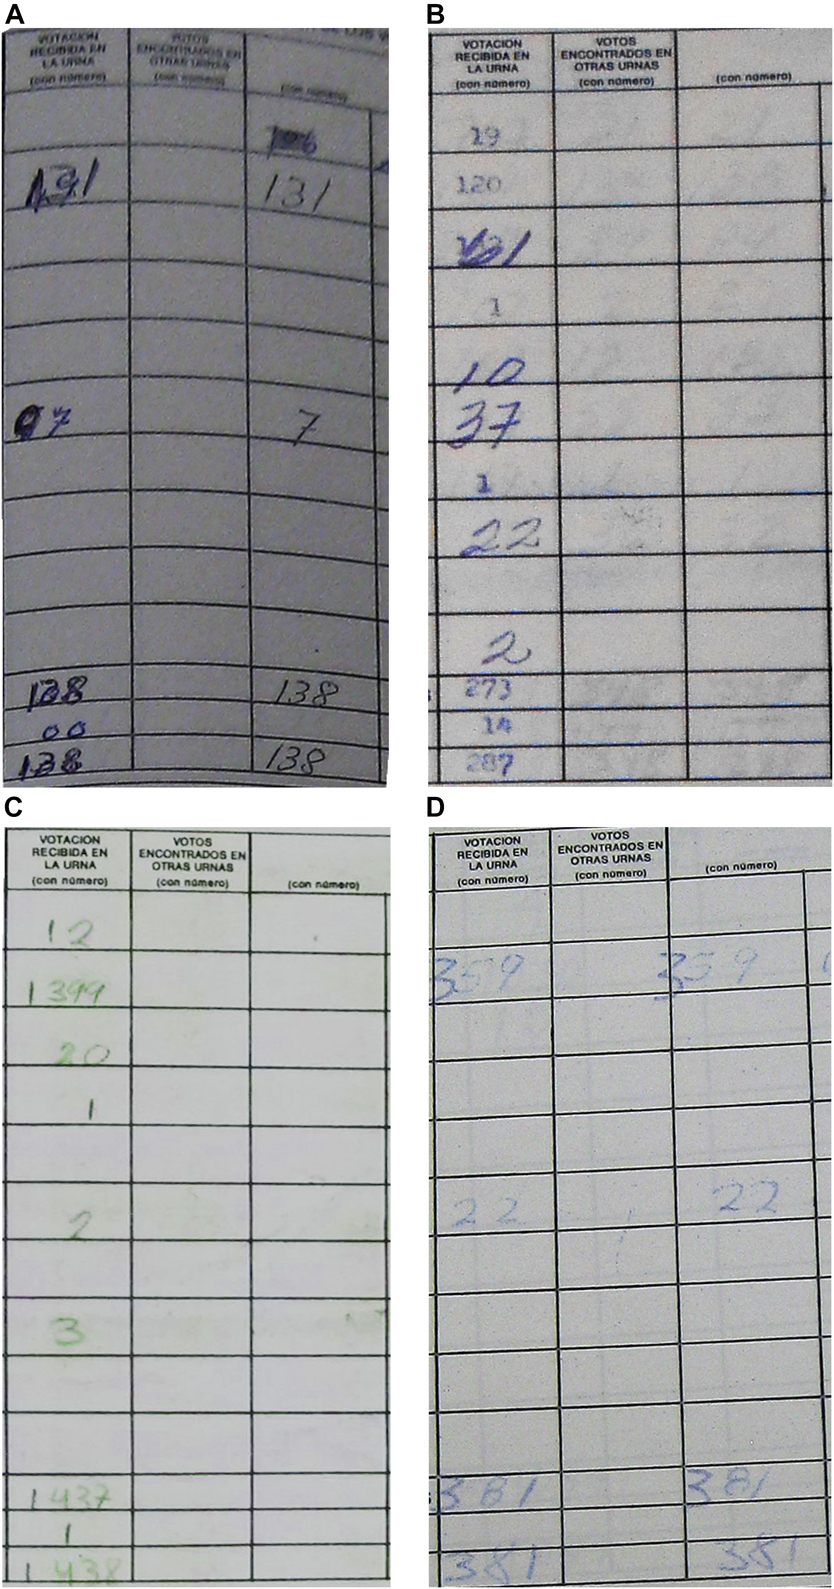
FIGURE 1. Examples of Vote Tallies with Alteration in Their Numbers. Mexico, 1988
ANALYSIS
This section introduces a methodology to identify alterations to the vote results reported in the tally sheets. To accomplish this task, I apply CNN, a computer algorithm able to learn visual patterns from previously labeled examples and then classify new unlabeled images (LeCun et al. Reference LeCun, Boser, Denker, Henderson, Howard, Hubbard, Jackel and Touretzky1990). CNN emulate the functioning of the brain’s visual system, which transforms sensory information into conceptual understanding. The architecture of CNN models consists of a set of layers, which are vectors of nonlinear transformation that extract different features from the image. The first layer receives the image input, the intermediate layers compress multiple representations of the original inputs, and the last layer provides a prediction output (Buduma Reference Buduma2017).
For the specific goal of this paper, the proposed method complements recent developments in electoral forensics, which employs statistical tests to identify anomalous patterns in election data (Mebane Reference Mebane2015). The strength of the approach described below is to identify not only the existence of potential irregularities but also the source behind the oddities in the vote results as well as its geographic location. Furthermore, computerized classification increases the reliability of the labels by not depending on factors such as the coder’s focus or commitment to the task (Hoque, el Kaliobly, and Picard Reference Hoque, el Kaliobly, Picard, Ruttkay, Kipp, Nijholt and Vilhjalmsson2009; Grimmer and King Reference Grimmer and King2011). In other words, this approach does away with the potential impatience and inattention of human coders were they to be assigned the tedious exercise of classifying thousands of tallies.
Notwithstanding the CNN’s advantages, it is worth mentioning the limitations of the method. On the one hand, since the model is trained to identify alterations of the vote numbers, it may be vulnerable to misclassify cases with non-intentional errors or benign amendments as altered tallies. I mitigate this concern in three ways. First, when training the model, I intentionally include images of tallies with benign adjustments as examples of non-altered tallies. This strategy allows the model to glean the features that distinguish each type of amendment. Second, the label classification takes a conservative approach to minimize the number of false positive cases in the analysis. Finally, I verify the inferences of the model by testing its accuracy on a different database. I describe in detail each of these approaches below.
On the other hand, the irregularities identified by the CNN are not exhaustive. In other words, it can also be the case that the model overlooks irregularities that did not involve any modification of the numbers originally registered in the vote tallies, such as voters casting multiple votes, vote suppression, or the replacement of the original tally.Footnote 6 This approach, therefore, estimates the lower limit for the irregularities that occurred in the election, and its results may complement alternative approaches for analyzing the data.
I describe below the classification of the vote tallies in four stages. First, I collected, organized, and pre-processed the tally images and their respective vote results. Second, I inspected a subset of images and identified those with potential alterations in their numbers. Third, I used the labeled images to train and fine-tune the CNN model. Finally, I used the trained model to label the rest of the images in the database.
Data Collection
This paper presents new data from more than 53,000 polling stations opened on July 6, 1988, whose respective vote tally sheets are stored at the National Archive in Mexico City. The data collection and digitization process produced two databases. The first one contains the images of all the vote tallies from the 1988 election.Footnote 7 With the help of two research assistants, I photographed, digitally edited, and organized by electoral district every vote tally available in the archive. To minimize the noise of the images during the classification stage, I manually cropped every picture to include only the area of the image that contains the vote returns, as the examples in Figure 1 illustrate.
The second database includes the vote returns at the polling station level for every candidate. This information was entered by a team of professional data coders and double-supervised by the coding team manager and me. The data-entry process proved impossible for a handful of images with faded writing or inadequate contrast. The total number of observations in the database, thus, is 53,249. As Table A in the Appendix shows, these vote totals are very similar to the official total votes reported at the national and district level. The resemblance validates the information of my database and suggests that any electoral manipulation occurred before officials compiled the results from the vote tallies. Table B in the Appendix provides descriptive statistics of the database.
Data Splitting
The image database was divided into three parts: a training set, a validation set, and a test set. The first two sets came from a sample of 1,050 images that were manually labeled as either “with alterations” or “without alterations,” ending up with 525 images for each class. The training set contains 900 of these images, which I use as inputs to fit the model. The remaining 150 images constitute the validation set, which I use to verify the accuracy of the model. Finally, the test set contains almost 52,300 unlabeled images that help me to estimate the overall rate of aggregation fraud.
The selection of labeled examples follows two common strategies for an efficient training: class balance and active learning. The first strategy makes sure that all classes in the training set are represented by a similar number of examples (Buda, Maki, and Mazurowski Reference Buda, Maki and Mazurowski2018). Class balance prevents skewing the predictions of the model toward the label with more training instances (Japkowicz and Stepehn Reference Japkowicz and Stepehn2002). This is a recurrent issue in situations where the positive cases represent a minority of all cases, such as the detection of cancerous cells (Wahab, Khan, and Lee Reference Wahab, Khan and Lee2017), locating oil-spills (Kubat, Holte, and Matwin Reference Kubat, Holte and Matwin1998), or identifying fraudulent bank operations (Chan and Stolf Reference Chan and Stolf1998). Therefore, the training set includes the same number of instances for “with alterations” and “without alteration” classes.
The second strategy, active learning, consists on selecting the most useful instances of each class to train the model (Settles Reference Settles2009). This approach is suitable when the labeled instances are very difficult, time-consuming, or expensive to obtain. The selection of cases was then based on two criteria: informativeness and representativeness. The former considers how much the instances help the classifier to improve its performance. whereas the latter examines how well the instances represent the overall input patterns of the entire dataset. Informativeness and representativeness are seldom achieved simultaneously, and researchers often need to choose which criteria to prioritize at the cost of the other (Huang, Jin, and Zhou Reference Huang, Jin and Zhou2014). In this case, I focus on the informativeness of the instances for the “with alterations” class by picking those instances of irregularities backed up by primary and secondary sources and that better represent examples of blatant irregularities. In contrast, the selection of cases for the “without alteration” class includes instances of clean tallies that represent the entire database plus the addition of some informative examples containing benign alterations.
The selection of instances for the “with alterations” class used information from interviews with the director of the National Electoral Registry in 1988 and two representatives of the PMS during the presidential election, as well as the stenographic record of the debates in the Chamber of Deputies to certify the election (Senado de la República 1988). These information helped me to locate the districts where aggregation fraud had been reported. I then selected those images showing alterations suggested by the primary sources, such as the cross-outs or number insertions illustrated in Figure 1. Therefore, my priority when picking the instances for this class was to choose those more likely to inform the model what type of irregularities were supported by the witness. To address the lack of representativeness of this class, I increase the number of training cases by picking examples from other districts showing similar patterns of manipulation.
The examples labeled as “without alterations” are images of tallies with no flagrant modifications in their numbers. To make sure that the model only distinguishes deliberate alterations on the tally, this set also includes two types of exceptional cases. First, I incorporate images of tallies showing benign amendments or accidental errors, such as misplaced numbers or marginal corrections to a candidate’s vote totals. These examples force the model to distinguish among different adjustments on the tally. Second, I also included images where a candidate gets all the votes in the polling station but there are no clear patterns of alterations in their numbers. Section C.4 in the Appendix provides a few examples for each case.
I verified the reliability of the labels in two different tests. The first one used crowdsourcing to compare the labels provided by 200 respondents recruited through Amazon’s Mechanical Turk (MTurk) for an online survey fielded in February 2017. The survey asked respondents to identify tallies they perceived as altered from a random sample of 10 images. A second check recruited four students at the University of Houston, who were asked to identify altered tallies from a random sample of 50 images. In both tests, subjects were never informed of the labels I had assigned to each of images. The details of each experiment are available in the Appendix. In both tests, the subjects’ choices show a substantial agreement with the original labeling.Footnote 8
Classifier Training
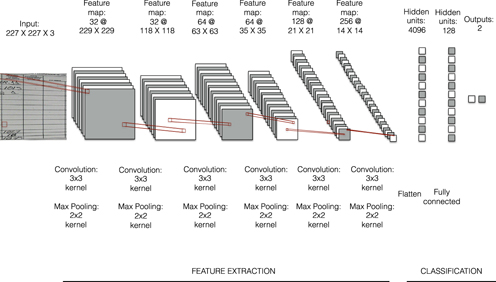
The training stage consists of repeated passes of the training examples throughout the network illustrated in Figure 2.Footnote 9 This stage allows the model to absorb the information from the images and calibrate its inferences for each label. The training process comprises three steps: feature extraction, classification, and model evaluation.

FIGURE 2. Network Architecture
Notes: Figure 3 illustrates the CNN structure applied to identify images of the vote tally sheets with alteration in their numbers. The inputs of the images consists of numerical arrays of 3 (RGB values) × 227 (height) × 227 (width) pixel values. The network contains six convoluted layers of 32, 32, 64, 64, 128, and 256 filters, respectively. A fully description of the network is described in Table C in the Appendix.
Feature Extraction
For the computer to analyze the images, it first transforms each picture into a numerical array of size 227 (height) × 227 (width) × 3 (RGB color channels), where every number in the array represents a specific pixel value of the image. The array passes through a first convolutional layer, which contains 32 filters, or neurons. A filter is also a numerical array of size 3 × 3 × 3 and represents a basic visual feature, such as a straight line, an edge, or a curve. Each filter slides across every 3 × 3 pixel area of the image searching for similar shapes to the one it represents. For every slide, the filter multiplies its array with the pixel values of the image area, and its sums up the product in a single number. Larger values represent those regions in the image with similar shapes than those in the filter. After sliding across each region of the picture, the 32 filters produce the same number of representations of the same input image.
The resultant representations are then used as inputs for the second convolutional layer, which also contains 32 filters. These filters slide across each representation searching for more complex features, such as the combination of curves or straight lines. The process repeats through four more convolutional layers, each of them gradually looking for higher-level features of the images in larger regions of the pixel space. The outputs from the last convolutional layer are flattened into a unidimensional vector for the “learning” phase.
Classification
This step feeds the extracted image features into a fully connected neural network, which is used to find out the patterns likely to predict each label. The distinction of features in each category is gleaned through a procedure called backpropagation (Rumelhart, Hinton, and Williams Reference Rumelhart, Hinton and Williams1988), and consists of four steps. First, after the image passes through the entire network, the model estimates the probabilities for the tally to belong to each label. Second, the model compares its prediction with the image’s label and estimates its prediction error given a loss function. Third, to minimize the amount of loss, the image passes back through the network, allowing the model to estimate the error derivatives of each unit, of the change in the loss as it modifies the weight of a hidden unit. Finally, the model updates the weights of the units and repeats the process with the next image in the training set.
For the gradual learning to happen, the model visits the images of the entire training set multiple times, or epochs in computer science jargon. After completing every epoch, I check the general accuracy of the model using the images of the validation set. I repeat this process as many epochs as necessary before the estimated loss value in the validation set stops decreasing.
The model faces two types of misclassification: labeling as “with alterations” those tallies with no clear patterns of manipulation (Error Type I) or labeling as “without alterations” those tallies with potential altered features (Error Type II). Given the political sensitivity of misclassifying unaltered tallies, I chose to minimize the first error type. In other words, the classifier would label a tally as altered only when its probability of belonging to this category is at least twice its probability of belonging to the non-altered category. This conservative approach thus labels a tally as “without alterations” when its estimated probabilities are too close to call, which minimizes the number of false positives in the model.
Model Evaluation
I evaluate the predictions of the model using a 20-fold Monte Carlo cross-validation (Johansson and Ringnér Reference Johansson, Ringnér, Dubitzky, Granzow and Berrar2007). Every fold randomly picks 900 labeled images to train the model, and its accuracy is verified using the remaining 150 labeled images. After registering the accuracy of the fold, all images are again randomly assigned to either the training or validity sets, and the model is trained again from scratch. The accuracy is then averaged over folds, the results of which are shown in Table 1. The overall accuracy rate of the CNN model is 89%, and its precision varies across classes; whereas 85% of the tallies with alterations are correctly classified, the accuracy rate for the tallies without alterations is 93%. The differences in the classification are due to the priority of minimizing the number of false positives at the cost of increasing the produced false negatives.
TABLE 1. Confusion Matrix for Classification
Notes: Table shows the mean accuracy rates of the classification model using 20 random sub-samples of 150 images. The standard deviation values for the accuracy rates on the clean and fraudulent images are 0.04 and 0.07, respectively. The overall accuracy rate is 0.89 with a mean loss value of 0.30.
I further validate the model inferences using the tallies for the 2015 legislative election in Mexico. While the procedures and technology during the vote counting are very similar to the 1988 election, the differences lie in the impartiality of the process: poll workers were randomly selected, representatives of all parties witnessed the ballot counting at every polling station, and the reasons to open a ballot box in a district council were stipulated in the electoral code. Moreover, the images of all tallies filled at the polling stations were available online 24 hours after the polls closed. There are no concerns about irregularities during the vote count or the integrity of the tallies. Therefore, this test can help us to infer the rate of false positives that the model produces in a clean election.Footnote 10 I used a computer script to download all the pictures and crop the tally area with the vote numbers.Footnote 11 This pre-processing of the images was necessary to make sure the images were as similar as possible to the training cases. The classifier labels the 2015 tallies as “with alterations” only 5% of the time—within the expected measurement error. Many of the misclassified cases correspond to tallies that were slightly misplaced on the website, making the cropped images to include features alien to the training set. Figure C.10 in the Appendix shows a few of these examples.
Classification
The final step uses the trained model to classify the rest of the images in the database. The results from this exercise show that at least 30% of the images in the dataset—about 16,000 vote tallies in the country—exhibit patterns consistent with the “with alterations” class.
At the state level, the rates of altered tallies range from less than 3% in Mexico City to 66% in the state of Tlaxcala. As Figure 3 illustrates, most of the tallies with alterations are placed in the south of the country, a region distinguished by its legacy of subnational authoritarian enclaves during the last decade of the twentieth century (Cornelius Reference Cornelius, Cornelius, Eisenstadt and Hindley1999; Gibson Reference Gibson2013).Footnote 12
FIGURE 3. Rates of Tallies Classified as Altered by State
Notes: This figure shows the proportion of tallies in every state classified by the CNN as altered.
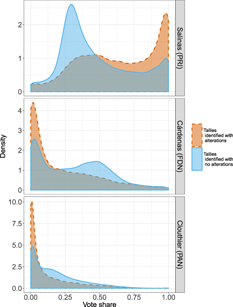
To infer the differences between the two types of tallies on the vote shares, I merged the labels to the database of electoral results at the polling-station level, described in the subsection labeled Data Collection. Figure 4 shows the resultant vote share distributions for the three main candidates, with the solid and dashed lines representing the densities of the tallies in the “without alterations” and “with alterations” classes, respectively. The top plot shows the vote share distributions for PRI’s candidate, Salinas whose vote shares, among the tallies classified as clean, show a unimodal distribution with a mean of 0.47. In the case of the opposition candidates, the clean tallies show bimodal distributions of their vote share, with a mode close to 0 and a second mode close to 0.50 for Cárdenas and 0.15 for Clouthier.

FIGURE 4. Distribution of Vote Shares for Each of the Candidates. Mexico, 1988
Notes: The plots show the density distribution of the vote shares for the three main candidates of the 1988 election. Each line type corresponds to the classification of the vote tally sheet using the CNN classifier.
The frequency of unaltered tallies showing vote shares for Salinas above 90% suggests either a set of observations where the official candidate was extremely popular or an anomaly in the distribution of votes that is commonly related to electoral fraud (Klimek et al. Reference Klimek, Yegorov, Hanel and Thurner2012; Mebane Reference Mebane2015; Myagkov, Ordeshook, and Shakin Reference Myagkov, Ordeshook and Shakin2009), and whose existence is overlooked by the methodology described above. Only two out of every five tallies classified as clean and showing vote shares for Salinas above 90% have a signature of an opposition party representative.
If the methodology identifies random alterations or accidental errors on the tallies, the vote share distributions between classes would look very similar. However, Salinas’s vote shares in the altered tallies significantly differ from those in the clean tallies. Among the images classified as altered, the vote share for Salinas has a median value of 0.65 and a mode close to 1. This comparison suggests not only that the altered tallies present larger vote shares than those tallies without alterations, but also that many of them gave Salinas almost unanimous support. For Cárdenas, the vote shares are considerably lower among the tallies classified as fraudulent than among those classified as clean, as the median values for the distributions are 0.10 and 0.33, respectively. Moreover, while the vote shares for the clean tallies follow a bimodal distribution, with a higher mode close to 0.5, the vote share distribution of the fraudulent tallies has a unique mode close to 0.
The results from Figure 4 confirm existent conjectures on the way in which fraud was perpetrated during the hegemonic party period. For example, Molinar (Reference Molinar1991) describes how PRI officials would have preferred to inflate votes in the party’s strongholds, where the opposition was unlikely to be present, over deflating opposition votes, which by definition should occur in places where the opposition is strong.Footnote 13 Nevertheless, this fact implies that we cannot interpret that all votes registered in the tallies with alterations are illegitimate. Identifying the effect of the amendments in every tally is part of an ongoing project that tries to determine the total number of inflated votes in the election.
Still, the classification of the tallies helps us to understand some of the inconsistencies in the results announced by electoral authorities. For example, Figure 5 shows the total number of votes in every district for the concurrent presidential and legislative elections in 1988, where the size of the dot represents the rate of altered tallies in the district. Since voters received ballots for both elections, we expect to observe a similar number of votes for president and deputy in the district. However, there is a group of districts showing large discrepancies, all of them with more votes for the presidential election than for the legislative one. Consider, for example, the two large dots at the middle-left of the plot indicating about 50,000 votes for deputy but more than 100,000 for president. These observations correspond to two districts in Puebla, the sixth and eighth, where the estimated rate of altered tallies was 63% and 70%, respectively. The observation closest to the upper left corner of the plot, represents Sinaloa state’s sixth district, where about a quarter of tallies in the district were identified as being altered.

FIGURE 5. Total Number of District Votes for Presidential and Legislative Elections. Mexico, 1988
Notes: The plot shows the total number of votes for the 1988 presidential and legislative elections in every district reported by electoral authorities (Comisión Federal Electoral 1988). The size of each bubble is the rate of tallies identified with alterations by the CNN model.
In sum, the results of using the CNN model to unveil the overall extent of aggregation fraud suggest that amendments of vote totals occurred in about a third of vote tallies. This finding confirms the anecdotal evidence of aggregation fraud and supports the conjecture that the institutional setup allowed election officials to inflate the vote returns.
THE PRODUCTION OF ALTERED TALLIES
This section examines the contextual conditions for the vote counts of a vote tally to be amended. I conjecture that the incentives for aggregation fraud are at the crossroads of the electoral institutions and the opportunities for perpetrators to keep the irregularities away from the eyes of the opposition. As described above, the 1987 electoral reform authorized district officials to amend the results from any polling station. Moreover, it provided the PRI at every district council with the default majority of the votes, which obstructed any objection of the opposition to proceed with the amendment. Nevertheless, this institutional advantage was insufficient to prevent the costs of massive fraud. The sudden interruption of the vote count system made evident the surprise of the incumbent party about the results, so PRI officials tried to keep the fraud as secret as possible in order to avoid signaling weakness.
Electoral chicanery was far from uncommon in Mexico before 1988 (Gillingham Reference Gillingham and Camp2012; Simpser and Hernández Company Reference Simpser and Hernández Company2014). These irregularities, however, seldom determined the electoral outcome. Given the institutional and financial advantages of the PRI over the opposition, the ultimate goal of fraud was to signal the strength of the regime and intimidate the opposition (Magaloni Reference Magaloni2006; Simpser Reference Simpser2013). This electoral operation was performed by an informal chain of command led by the interior minister who managed the election process and held governors accountable for their performance. Governors, in turn, were responsible for winning elections in their respective states, a goal that required them to mobilize local brokers and to monitor election officials (Langston Reference Langston2017).
Unlike previous instances of fraud, the alteration of the tallies in 1988 distinguishes itself as a last-ditch effort to ensure the PRI’s victory. Party officials, election administrators, and members of the campaign staff later admitted their overconfidence about what the outcome would be and spoke of their ineffective efforts to mobilize local brokers before Election Day.Footnote 14 In consequence, the first results reported by electoral authorities were, in the words of President Miguel de la Madrid (Reference de la Madrid2004, 816), “a bucket of cold water,” driving PRI officials to rely on the manipulation of the tallies as a last resort to control the outcome. The haste of the operation and the uncertainty of the regime’s popular support left local authorities with very limited opportunities to carry out the irregularities outside the scrutiny of the opposition. This is then an unusual opportunity to explore the opportunities for electoral manipulation.
I propose below the hypotheses to be tested, describe the set of variables used for the analysis, and discuss the results.
Theoretical Expectations
The overarching hypothesis is that the opportunities for aggregation fraud depended on the resources available for local perpetrators to inflate vote counts. In particular, I explore the uneven prevalence of altered tallies as a function of the presence of the opposition and the characteristics of the networks in charge of coordinating the aggregation fraud operation.
The first expectation is that tallies were more likely to suffer amendments to their numbers when they were originally written down without the presence of the opposition. This conjecture follows from the existing works on the displacer effects of election monitoring, which reallocates the opportunities for fraud to places with no witness present (Ichino and Schundeln Reference Ichino and Schundeln2012; Asunka et al. Reference Asunka, Brierley, Golden, Kramon and Ofosu2019). I extend this logic to the case of aggregation fraud and suggest that the deterrent effects of opposition representatives persisted after the polls were closed. Tallies were originally written down at the polling stations in the presence of party representatives who kept a carbon copy of the tally for their records. As a result, district officials were less likely to modify vote totals of tallies for which opposition representatives could provide firsthand evidence of the discrepancies in the vote totals.
The second expectation has to do with the role of local power elites to coordinate the alteration of vote tallies. As the documented examples from Russia (Kalinin and Mebane Reference Kalinin and Mebane2011; Myagkov, Ordeshook, and Shakin Reference Myagkov, Ordeshook and Shakin2009; Reuter and Robertson Reference Reuter and Robertson2012) and Indonesia (Martinez Bravo Reference Martinez Bravo2014) show, subnational authorities often rely on electoral manipulation to favor the incumbent’s vote totals and signal their loyalty to the central government. The ultimate performance of these authorities, however, depends on their skills and motivation to coordinate the electoral operation. Some local elites may have more experience and resources to monitor vote agents within their jurisdiction. Others, meanwhile, may have greater personal and career-based incentives to signal their loyalty to the central government. Therefore, the local execution of fraud depends on the expertise and motivation of the local elites for delivering votes in an effective way.
To verify this conjecture, I explore the intrinsic characteristics of the Mexican state governors during the 1988 election. I expect that the altered tallies were more likely to appear in states with electorally skillful governors. During most of the twentieth century, state executive offices were filled by traditional political figures who advanced their political careers by working for the party at the grassroots. Many of these governors learned the various ways to deliver votes by running for election and holding multiple elective offices. However, during the 1980s, Mexican governors also included a group of young politicians with technical skills but without practical knowledge of how to manage an election (Camp Reference Camp2014). These technocrats lacked the resources and skills to activate election operations in an efficient way. We can then expect that those governors who had held a previous elected position were more aware of what was necessary to lead an electoral operation that modified the vote returns of the tallies in such unforeseen circumstances.
A related expectation is that the altered tallies were more likely to come from states where governors had personal ties with the presidential candidate. This conjecture sustains that the vote operators’ efforts depend on their personal motivations for helping the candidate win (Callen and Long Reference Callen and Long2015; Frye, Reuter, and Szakonyi Reference Frye, Reuter and Szakonyi2014; Larreguy, Montiel, and Querubin Reference Larreguy, Montiel and Querubin2017). During the dominant party period in Mexico, political careers were defined by the individual’s affiliation to a political clique, or camarilla, which were networks of personal influence around an individual leader (Camp Reference Camp2014; Smith Reference Smith1979). These groups competed with each other for political power within the PRI, and they bonded the loyalty of its members to a specific leader in exchange for patronage jobs. For the 1988 election, not all governors belonged to the intra-party group led by Carlos Salinas. Therefore, if the prevalence of aggregation fraud in each state depended on the governor’s ties with the presidential candidate, there should be more altered tallies in those states led by members of Salinas’s camarilla.
Measures
The analysis uses as a dependent variable the labels for the tally images described in the Analysis Section, identifying the tallies “with alterations” with the value of 1 and 0 otherwise. I measure the explanatory variables as follows. First, to account for whether the opposition had the opportunity to record the vote results at the polling station, No Opposition Representative is a binary variable indicating those tallies with no signature of even one representative from the opposition. I account for the characteristics of the state governors in two ways. Governor’s Experience indicates whether the state executive had previously held an elected public office. The information for this variable comes from the Dictionary of Mexican Political Biographies (Camp Reference Camp2011), and I coded as 1 those tallies in states where the governors were previously elected as mayor, deputy, or senator, and 0 if otherwise. Also, Camarilla identifies those governors within Salinas’s political group. This information comes from Centeno (Reference Centeno2004), who identifies 40 top-level officials in the Salinas’s camarilla, out of which seven were governors during the 1988 election.Footnote 15
The analysis also includes a battery of variables to control for other determinants of electoral manipulation. The presence of the opposition at the polling stations was often limited to urban places and regions where the opposition expected some electoral support (Molinar Reference Molinar1991). I partial out this effect in two ways. First, I control for whether the tally belongs to a rural district. Rural is then the proportion of citizens in the district living in communities with fewer than 50,000 inhabitants according to the 1990 census.Footnote 16 Second, I control for the popularity of the PRI in the polling station by including PRI 1985, the PRI’s district vote share during the 1985 legislative elections. The obvious concern in using this measure is that the 1985 results could be plagued with similar irregularities, biasing the estimations in the model. Alternatively, I use the proportion of survey respondents in every state who identified with the PRI 3 weeks prior to the Election Day (PRI’s Support from Polls). The data from this variable comes from a survey of 4,414 respondents fielded from June 6 to June 17, 1988, and published by La Jornada newspaper a day before the election (La Jornada July 5 1988a).
To increase our confidence that the alteration of the tallies reflects the operation at the district councils, I control for the presence of PRI’s manpower in the district’s polling stations on Election Day. The PRI’s territorial base for mobilization and intimidation on Election Day relied on labor unions, which displayed their manpower and resources at the polling stations in exchange for political positions within the party (Langston Reference Langston2017; Murillo Reference Murillo2001). Given their resource constraints, unions concentrated their resources in those districts where one of their leaders was running for a legislative seat (Langston and Morgenstern Reference Langston and Morgenstern2009). If the alteration of the tallies occurred outside the polling stations, we should expect no correlation between the dependent variable and those places where the party laid the groundwork for irregularities at the polling station level. To consider this possibility, Union membership identifies those districts where the PRI nominated a union leader as a legislative candidate. The data for this variable comes from Langston (Reference Langston2017).
Finally, I control for those districts that had any reappointment of election officials during the 6 months prior to the election. This variable considers the possibility that the aggregation fraud operation was not supervised by the governors but instead by the federal executive. To test for this possibility, and following a similar approach by Reuter and Robertson (Reference Reuter and Robertson2012) and Martinez Bravo (Reference Martinez Bravo2014), Reappointment identifies those districts that had any reappointments of election officials during the 6 months prior to the election. Since district election officials were directly appointed by the minister of interior, any reappointment prior to the election would suggest the nomination of an agent closer to the federal executive. The information from this variable comes from reviewing all the issues of the Diario Oficial de la Federación, Mexico’s equivalent to the U.S. Federal Register or the Canada Gazette, from January 1 to July 5, 1988.
Results
Given the binary nature of my dependent variable and the nested structure of the data, I specify a multilevel binomial logit-link model with district and state random effects. Table 2 summarizes the main results. Model 1 shows the estimates of the main explanatory variables, and Models 2 and 3 test the robustness of the results under alternative control variable specifications.
TABLE 2. Explaining the Characteristics of the Altered Vote Tallies. Mexico, 1988
Notes: Entries are logistic regression coefficients and standard errors. The dependent variable is a binary indicator for a vote tally was classified as altered. *** is significant at the 0.1% level; ** is significant at the 1% level; and * is significant at the 5% level.
The results for No Opposition Representative are positive and statistically significant, suggesting that a tally is more likely to present alterations in its vote returns if the opposition lacked the original vote records to compare the results recorded at the polling station with those tabulated at the district councils. The size of this coefficient is quite consistent across models, 0.23, which the logit model translates to a probability increase for a tally being altered of about 5%.
The results also provide evidence that the characteristics of the governors leading the electoral operation affected the likelihood of observing an altered tally in the district. The coefficient for Governor’s experience is positive and statistically significant. Among those tallies under the jurisdiction of governors with previous electoral experience, their probability of presenting alterations is about 17% larger than in those tallies from states with electorally inexperienced governors. Similarly, the coefficient of Camarilla suggests that tallies classified as altered are more likely to come from states governed by a member of Salinas’s political power group. These results suggest that the extent of aggregation fraud in this election can be explained by the governors’ resources available and their personal ties to the presidential candidate.
Models 2 and 3 show consistency of the main effects after including the battery of control variables. The positive relationship of the tallies with no signatures from the opposition holds after accounting for the PRI’s electoral strength and identifying rural areas. The positive coefficient of both control variables in Model 3 provides additional evidence to the exploratory analysis of subsection Classification, showing that the irregularities were more likely to happen in the PRI’s electoral bastions.
The coefficients for Union present no statistically significant effect, providing no evidence that aggregation fraud was related to the presence of the PRI’s manpower on Election Day. Finally, Reappointments show estimates not statistically different from zero. This suggests no differences in the rates of altered tallies between those districts with or without reappointed officials.
The results above are suggestive of the ways that aggregation fraud was carried out. In order to inflate the results in an effective way, the alterations of the tallies were more likely to occur where the opposition was unable to cross-check the results and in those states with a governor with the motivation and resources to lead and coordinate the operation. This instance unveils the opportunities for aggregation fraud given the risks of exposing the irregularities and the chicanery’s expected rewards.
CONCLUSION
In his memoirs, Carlos Salinas (Reference Salinas2002) defends the legality of his victory in the 1988 election based on two factors. First, the results reported by electoral authorities emanate from the vote sums in the tallies, which were filled out in the presence of opposition party representatives in 72% of the polling stations. Second, the results of the polling stations are publicly available for corroboration. In the words of Salinas, “The actas (vote tallies) stored in the National Archives confirm that the 1988 presidential elections are fully documented” and validate his triumph in an election with “the major mobilization to monitor the election that the opposition had in fact achieved” (p. 942–3).
This paper scrutinizes both claims for the first time by examining the more than 50,000 tallies available in the National Archive. The analysis confirms that, indeed, the vote totals announced on July 9, 1988, mirror those recorded in the tallies. Yet it also demonstrates that this is insufficient to validate the legitimacy of the electoral result. Using recent developments in image analysis, I identify amendments of the vote returns in about a third of the tallies. These alterations were more likely to occur where the opposition was unable to certify the amendment of the vote totals at the district councils and within the jurisdiction of governors with enough resources and motivation to coordinate the inflation of vote totals in an efficient way.
The results provide evidence of a common untested assumption in the comparative politics literature regarding the risk of nondemocratic elites for holding elections. Since the official party enjoyed several institutional and resource advantages, the regime in Mexico conceded to the opposition the opportunity to supervise the electoral process at the polling stations. Nevertheless, the unexpected unpopularity of the official party on Election Day caused the regime to rely on blatant and rudimentary fraud, while trying to keep the irregularities as hidden as possible. This illustrates how electoral institutions in autocracies unfold as a result of the tension between the demand of opposition parties to guarantee democratic uncertainty and the desire of autocrats to retain control over electoral outcomes (Schedler Reference Schedler2002b).
While this study focuses on one of the most prototypical cases of electoral authoritarianism, the theoretical implications of the findings are generalizable beyond Mexico’s hegemonic regime. The prevalence of manipulation and biased institutions has afflicted many contemporary elections. In many of these cases, governments use elections to legitimize their regime while keeping full control of the electoral result. The emphasis of this paper on the interaction between formal and informal incentives for fraud may inform the dynamics of current electoral authoritarian regimes.
Finally, this paper proposes an approach to identify electoral irregularities that can be applied elsewhere. The methodology is designed to complement existent developments on electoral forensics by focusing on the data-generating process behind statistical anomalies in vote returns. Policy practitioners and scholars can use this test to audit the integrity of tallies of any election. In fact, it is worth emphasizing that the methodology I propose will become more accurate as it gathers more images from other elections and accumulates the input from experts on the topic. This method, therefore, should be seen as a stepping stone to identify electoral fraud in cases where, despite their efforts to keep the irregularities hidden, the perpetrators left their fingerprints on the available evidence.
SUPPLEMENTARY MATERIAL
To view supplementary material for this article, please visit https://doi.org/10.1017/S0003055419000285.
Replication materials can be found on Dataverse at: https://doi.org/10.7910/DVN/NNNPOU.