At times, our understanding of relationships in the world around us, including natural, medical, societal, and economic systems, seems to be based upon a broad acceptance of linear cause and effect. In life and in medicine, we tend to accept some direct linear principles, such as work faster, improve productivity; or study longer, improve clinical knowledge; or even retire early, live longer; and so on. The emergence of statistical methods focusing on quantifying, summarizing, and testing associations, or correlations, as a first step towards determining causal relationships has created a culture that is likely to accept false conclusions due to the apparent narrow focus and tendency to create a “best fit” so often employed. Beginning with a sense of inherent risk and asking how any external effect might change that risk (a Bayesian approach) might help. Failure to step back to examine how any association behaves at extreme values, either small or large, or to consider how the spread of values might impact any conclusions about a specific example, and a lack of appreciation for the impact of outlying values, and confounding or limiting effects, can lead us to accept linear relationships all too easily.
Take, for example, the apparently simple relationship between financial compensation and work performed. It is commonly stated that, for a fixed hourly rate, the income that any worker will receive increases in a straight line (a simple linear relationship) as the number of hours worked increases.Reference Smith1 While this may hold true for any point midway along the relationship for a typical work week, it most certainly does not hold true at the extremes. Basic confounders, such as varying rates of taxation, insurance premiums, pension contributions, start-up costs, such as uniform fees, transportation costs and the like, are well understood and generally accepted as factors that distort the supposed linearity of the hours worked to compensation received relationship. Even if we adjust for these confounders, the relationship breaks down over time due to expectations of providing unpaid contributions and at upper extremes when limiting factors, such as requirement for sleep, or when rates of error leading to negative financial impacts, take effect. So perhaps productivity is a more reliable variable? The more hours worked, the greater the output is another generally accepted association. Yet when this presumed (near) linear relationship is tested in the real world, it often fails. Recent studies have shown that decreasing the total hours worked by individual workers, moving to a 4-day week on full weekly pay, actually leads to increased productivity.2,3 In physics, despite our day-to-day reliance on Newtonian principles, we now accept that such linear relationships only hold true at the macroscopic level that we perceive, and at speeds we can appreciate, understanding that the “laws” disintegrate at both the sum-atomic quantum level and at the upper extreme of measurements across the universe where space-time bends any apparent straight line.
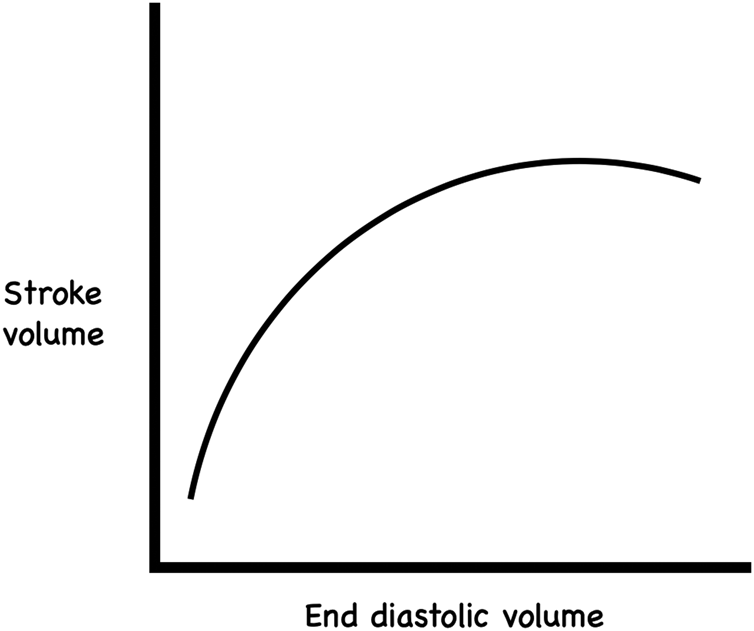
There are many physiological and medical examples of causal nonlinearity. While minutes may be muscle in the setting of myocardial infarction, this is less apparent as time passes, requiring caution with delayed thrombolysis, as potential benefits decrease with time, weighed against relatively fixed risks. The Frank-Starling curve, which, for the most part, reveals a linear relationship between ventricular end-diastolic volume and the subsequent (stroke) volume of blood ejected during ventricular contractionReference Noble4 is, of course, nonlinear. The name of the relationship gives the secret away that this relationship breaks down as volumes increase and the natural limits of ventricular size are approached and, in fact, is reversed when pathological processes impair the ability of the myocardium to respond to increased volumes (Figure 1).
Figure 1. The Frank-Starling curve.
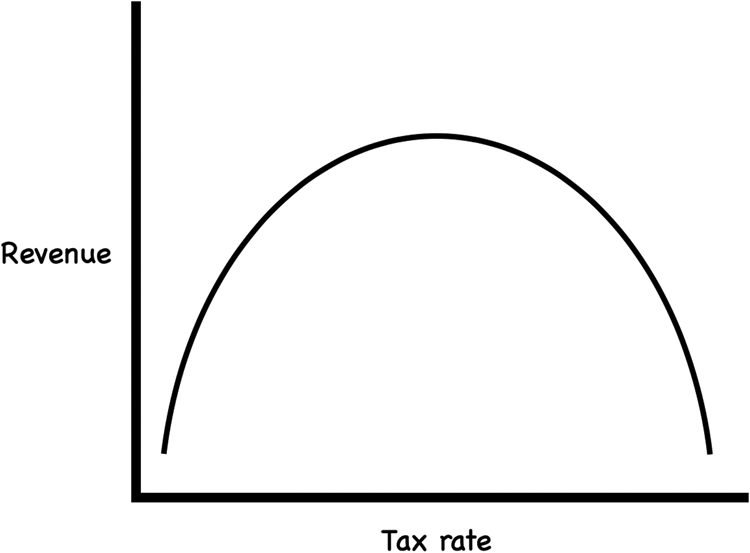
Similar “inverted” U-shaped curves have been described in economics. The infamous Laffer curve (Figure 2) postulates that, at low tax rates, any increase in taxation will lead to increased revenue, which will flatten out and eventually fall, as tax rates continue to rise.Reference Laffer5 Whether or not the shape of this curve truly reflects the actual relationship between tax rates and government revenue, it is clear that the relationship is nonlinear, with some limit, at which point further increases in revenue will slow, flatten, and perhaps reverse.
Figure 2. The Laffer curve.
Without elaborating further, we all understand that similar nonlinear causal relationships are widespread, such as dose-response curves for medications, sleep-to-performance relationships, intelligence quotient (IQ) to career success projections, and emergency department wait times to triage category,Reference Yoon, Steiner and Reinhardt6 among others.
Yet, all too often, we fail to recognize this nonlinearity and accept linear assumptions in science, in medicine, and, more generally, in society: the application of a straight best-fit line to a scatter plot of predicted and recorded emergency medical services post-scene times, to validate a model that is then used as a reference for real-world data, perhaps neglecting the curve of nonlinearity as the data approach zeroReference Tansley, Schuurman and Erdogan7; advice that we provide for obese patients that there is a linear relationship between calories eaten minus calories burned and weight gained; or even that losing weight is always healthy; assumptions we make that if current increases in rates of obesity continue, everyone will be overweight in the near future; that more and more exercise improves health; and that lowering blood pressure relates directly to lowering risk of cardiovascular disease; and so on. While most, if not all, of these may approximate a linear relationship in common circumstances centred in a normal distribution of measures, they cannot be assumed to be true when extrapolated well beyond common measurements. As such, it is vital to assess relationships across the whole spectrum of any presumed relationship.Reference Worster, Fan and Ismaila8 The relationship between door to electrocardiogram (ECG) times and ECG to needle times for thrombolysis was examined by Atzema et al.Reference Atzema, Austin, Tu and Schull9 The clear linear increase seen in the first 30 minutes flattens, approaching a flat, zero correlation line thereafter, indicating the limitation of this relationship.Reference Atzema, Austin, Tu and Schull9
Even if we accept the limited linearity of some relationships within a specified range, perhaps we should challenge our willingness to accept the best fit line through widely scattered data points plotted on a graph, which mirrors our tendency to accept and test central or average values, which may not apply to any individual situation we face. The earth could easily be mistaken as being flat when observations are limited to a city street rather than the horizon over the ocean. Indeed, the mathematical use of ever-decreasingly small lines to approximate a circle, speaks to our natural tendency to think linearly, when the true shape of things is not so simple or so easily measured.
As such, it seems evident that, outside of theoretical examples, controlled isolated test environments, or narrow ranges of measurements, natural linear causal relationships do not exist. We should acknowledge that environmental, scientific, physiological, and societal causal relationships are universally nonlinear in nature. This will help us analyse data more carefully, make us aware of the often-limited scope of our perspective, will decrease the likelihood of us making unrealistic or impossible predictions, and will better help us to accept variability and natural limits.


At times, our understanding of relationships in the world around us, including natural, medical, societal, and economic systems, seems to be based upon a broad acceptance of linear cause and effect. In life and in medicine, we tend to accept some direct linear principles, such as work faster, improve productivity; or study longer, improve clinical knowledge; or even retire early, live longer; and so on. The emergence of statistical methods focusing on quantifying, summarizing, and testing associations, or correlations, as a first step towards determining causal relationships has created a culture that is likely to accept false conclusions due to the apparent narrow focus and tendency to create a “best fit” so often employed. Beginning with a sense of inherent risk and asking how any external effect might change that risk (a Bayesian approach) might help. Failure to step back to examine how any association behaves at extreme values, either small or large, or to consider how the spread of values might impact any conclusions about a specific example, and a lack of appreciation for the impact of outlying values, and confounding or limiting effects, can lead us to accept linear relationships all too easily.
Take, for example, the apparently simple relationship between financial compensation and work performed. It is commonly stated that, for a fixed hourly rate, the income that any worker will receive increases in a straight line (a simple linear relationship) as the number of hours worked increases.Reference Smith1 While this may hold true for any point midway along the relationship for a typical work week, it most certainly does not hold true at the extremes. Basic confounders, such as varying rates of taxation, insurance premiums, pension contributions, start-up costs, such as uniform fees, transportation costs and the like, are well understood and generally accepted as factors that distort the supposed linearity of the hours worked to compensation received relationship. Even if we adjust for these confounders, the relationship breaks down over time due to expectations of providing unpaid contributions and at upper extremes when limiting factors, such as requirement for sleep, or when rates of error leading to negative financial impacts, take effect. So perhaps productivity is a more reliable variable? The more hours worked, the greater the output is another generally accepted association. Yet when this presumed (near) linear relationship is tested in the real world, it often fails. Recent studies have shown that decreasing the total hours worked by individual workers, moving to a 4-day week on full weekly pay, actually leads to increased productivity.2,3 In physics, despite our day-to-day reliance on Newtonian principles, we now accept that such linear relationships only hold true at the macroscopic level that we perceive, and at speeds we can appreciate, understanding that the “laws” disintegrate at both the sum-atomic quantum level and at the upper extreme of measurements across the universe where space-time bends any apparent straight line.
There are many physiological and medical examples of causal nonlinearity. While minutes may be muscle in the setting of myocardial infarction, this is less apparent as time passes, requiring caution with delayed thrombolysis, as potential benefits decrease with time, weighed against relatively fixed risks. The Frank-Starling curve, which, for the most part, reveals a linear relationship between ventricular end-diastolic volume and the subsequent (stroke) volume of blood ejected during ventricular contractionReference Noble4 is, of course, nonlinear. The name of the relationship gives the secret away that this relationship breaks down as volumes increase and the natural limits of ventricular size are approached and, in fact, is reversed when pathological processes impair the ability of the myocardium to respond to increased volumes (Figure 1).
Figure 1. The Frank-Starling curve.
Similar “inverted” U-shaped curves have been described in economics. The infamous Laffer curve (Figure 2) postulates that, at low tax rates, any increase in taxation will lead to increased revenue, which will flatten out and eventually fall, as tax rates continue to rise.Reference Laffer5 Whether or not the shape of this curve truly reflects the actual relationship between tax rates and government revenue, it is clear that the relationship is nonlinear, with some limit, at which point further increases in revenue will slow, flatten, and perhaps reverse.
Figure 2. The Laffer curve.
Without elaborating further, we all understand that similar nonlinear causal relationships are widespread, such as dose-response curves for medications, sleep-to-performance relationships, intelligence quotient (IQ) to career success projections, and emergency department wait times to triage category,Reference Yoon, Steiner and Reinhardt6 among others.
Yet, all too often, we fail to recognize this nonlinearity and accept linear assumptions in science, in medicine, and, more generally, in society: the application of a straight best-fit line to a scatter plot of predicted and recorded emergency medical services post-scene times, to validate a model that is then used as a reference for real-world data, perhaps neglecting the curve of nonlinearity as the data approach zeroReference Tansley, Schuurman and Erdogan7; advice that we provide for obese patients that there is a linear relationship between calories eaten minus calories burned and weight gained; or even that losing weight is always healthy; assumptions we make that if current increases in rates of obesity continue, everyone will be overweight in the near future; that more and more exercise improves health; and that lowering blood pressure relates directly to lowering risk of cardiovascular disease; and so on. While most, if not all, of these may approximate a linear relationship in common circumstances centred in a normal distribution of measures, they cannot be assumed to be true when extrapolated well beyond common measurements. As such, it is vital to assess relationships across the whole spectrum of any presumed relationship.Reference Worster, Fan and Ismaila8 The relationship between door to electrocardiogram (ECG) times and ECG to needle times for thrombolysis was examined by Atzema et al.Reference Atzema, Austin, Tu and Schull9 The clear linear increase seen in the first 30 minutes flattens, approaching a flat, zero correlation line thereafter, indicating the limitation of this relationship.Reference Atzema, Austin, Tu and Schull9
Even if we accept the limited linearity of some relationships within a specified range, perhaps we should challenge our willingness to accept the best fit line through widely scattered data points plotted on a graph, which mirrors our tendency to accept and test central or average values, which may not apply to any individual situation we face. The earth could easily be mistaken as being flat when observations are limited to a city street rather than the horizon over the ocean. Indeed, the mathematical use of ever-decreasingly small lines to approximate a circle, speaks to our natural tendency to think linearly, when the true shape of things is not so simple or so easily measured.
As such, it seems evident that, outside of theoretical examples, controlled isolated test environments, or narrow ranges of measurements, natural linear causal relationships do not exist. We should acknowledge that environmental, scientific, physiological, and societal causal relationships are universally nonlinear in nature. This will help us analyse data more carefully, make us aware of the often-limited scope of our perspective, will decrease the likelihood of us making unrealistic or impossible predictions, and will better help us to accept variability and natural limits.
Competing interests
None declared.