


Introduction
To improve our understanding of calving dynamics, it is necessary to increase the observations on ice-flow velocity, calving speed and advance/retreat rates on calving glaciers around the world (Reference MeierMeier, 1997). Hielo Patagonico Norte (HPN) and Hielo Patagonico Sur (HPS), located in southwestern South America (Fig. 1), provide a unique geographical setting to investigate and extend the database on temperate tidewater and fresh-water calving glaciers. Both icefields nourish many fast-moving glaciers which calve into the deep Pacific fjords to the west and into fresh-water piedmont lakes to the east. Due to the extreme weather conditions, inaccessibility and heavily crevassed areas, field measurement of ice-flow velocity on Patagonian glaciers is difficult and limited. So far, the only annual velocity data measured in the field exist for Glaciar Moreno (Reference Skvarca and NaruseSkvarca and Naruse, 1997; Reference Rott, Stuefer, Siegel, Skvarca and EckstallerRott and others, 1998; Reference StueferStuefer, 1999). However, annual flow velocities have also been estimated by measuring the movement of supraglacial debris (Reference Aniya and SkvarcaAniya and Skvarca, 1992; Reference Skvarca, Stuefer and RottSkvarca and others, 1999) and ogive waves (Reference Aniya, Casassa and NaruseAniya and others, 1988; Reference Aniya and SatoAniya and Sato, 1995).
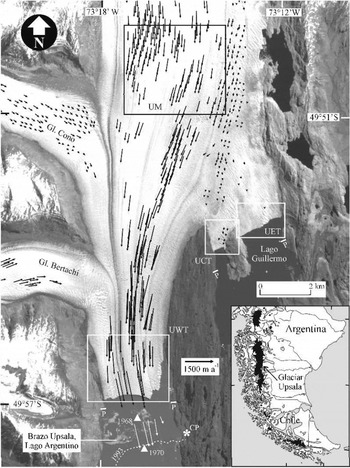
Fig. 1. Section of Landsat 7 ETM+ image (band 8) of 14 October 2001, with the lower terminus of Glaciar Upsala. P–Pindicate depth profiles in Lago Argentino and Lago Guillermo. UWT, Upsala west terminus; UCT, Upsala cent ral terminus; UET, Upsala east terminus; UM, Upsala main tongue; CP, topographic survey stations in late 1990 and 1993. Triangles indicate positions of a debris lump in 1968 and 1970, and squares the areas of velocity analysis given in Table 1. Vectors in white: velocities measured in November 19 93. Vectors in black: velocities derived by cross-correlation in this work.
Glaciar Upsala is the third largest glacier of HPS, being 902 km2 in area and 60 km in length (Reference Aniya, Sato, Naruse, Skvarca and CasassaAniya and others, 1996).The Upsala west terminus (UWT) calves into Brazo Upsala (BU), Lago Argentino, while the Upsala central terminus (UCT) and Upsala east terminus (UET) calve into Lago Guillermo (LG) (Fig. 1). Reference Skvarca, de Angelis, Aniya and NaruseSkvarca and De Angelis (2001) and Reference Skvarca, de Angelis, Naruse, Warren and AniyaSkvarca and others (2002) have found that UWT calves into a 700m deep channel in Brazo Upsala, the deepest known fresh-water lake arm where calving takes place. All termini of Glaciar Upsala underwent rapid retreat after 1978 (Reference Aniya and SkvarcaAniya and Skvarca, 1992; Reference Skvarca, Rott and NaglerSkvarca and others, 1995a, Reference Skvarca, Satow, Naruse and Leivab; Reference Warren, Greene and GlasserWarren and others, 1995; Reference Naruse, Skvarca and TakeuchiNaruse and others, 1997; Reference Aniya, Dhakal, Park and NaruseAniya and others, 2000; Reference Skvarca, de Angelis, Naruse, Warren and AniyaSkvarca and others, 2002). In coincidence with the rapid recession, UWT experienced intense surface lowering at 11m a−1 (Reference Skvarca, Satow, Naruse and LeivaSkvarca and others, 1995b). Reference Naruse, Skvarca and TakeuchiNaruse and others (1997) attributed this large thinning rate to the regional atmospheric warming and reduction in backstress.
In this paper, we present the continuation of monitoring of UWT, UCTand UET front positions from 13 June 2000 to 14 October 2001, based on Landsat images. In addition, the cross-correlation technique was applied to optical images to measure seasonal and annual ice velocity. This technique has been applied previously using radar images to derive the motion field of Glaciar Moreno (Reference Rott, Stuefer, Siegel, Skvarca and EckstallerRott and others, 1998; Reference Michel and RignotMichel and Rignot, 1999; Reference StueferStuefer, 1999). With known water depth and calving rates derived in this work, the recently proposed improved calving-rate/water-depth relationship (Reference Skvarca, de Angelis, Naruse, Warren and AniyaSkvarca and others, 2002) is being analyzed.
Method and Uncertainties
The existence of Cordoba Ground Station of Comision Nacional de Actividades Espaciales (CONAE), Argentina, has notably improved the acquisition of optical images over HPS regions since 1997. Limited earlier Landsat Multispectral Scanner and Return Beam Vidicon images of HPS are given in Reference LliboutryLliboutry (1998). The Landsat 7 Enhanced Thematic Mapper Plus (ETM+) provides a 15 m spatial resolution in panchromatic band. Four ETM+ images, path/row 231/95 were used to study the surface ice velocity of Glaciar Upsala’s lower terminus; they were acquired on 27 October 2000, 20 March 2001, 12 September 2001 and 14 October 2001, i.e. extending over a full year.
A cross-correlation method (Reference Scambos, Dutkiewicz, Wilson and BindschadlerScambos and others, 1992) was applied with success to pairs of time-separated optical images in order to calculate the ice-velocity field of Glaciar Upsala. In this method, a small subscene, called the reference chip, is extracted from the first of the pair of images, and a larger “search chip” is extracted from the second image. For every possible location of the reference chip within the search chip, the normalized cross-covariance is calculated; in this way a “correlation index surface” is created, and the approximate peak is interpolated to find the location of the best match to sub-pixel precision. Adjustable parameters include the sizes of the chips and the spacing of the grid where matches are sought. For this work we used a 64×64 pixel search chip, and a 32×32 pixel reference chip. Vectors were obtained on a 10 pixel grid. After the initial set of vectors was obtained, we took several steps to weed out vectors of poor quality, including application of a threshold on correlation strength, application of a vector median filter (Reference Astola, Haavisto and NeuvoAstola and others, 1990), and final editing on-screen using an interactive vector editor. Using this method, the displacements of supraglacial features visible on ETM+ images were tracked and the velocity vectors calculated for each time-adjacent image pair.
The random correlation uncertainty intrinsic in our software is about 0.5 pixels for any image pair. There is also a systematic uncertainty of 1.5 pixels due to image registration. In our particular case, the resulting 2 pixel uncertainty (a) translates to:
σ = 76 ma−1 (0.21 md−1 ) , for 27 October 2000–20March 2001
σ = 62 ma−1(0.17md−1 ) , for 20 March–12 September 2001
σ = 3 4 2 m a−1 (0.94md−1), for 12 September–14October 2001.
For the annual velocities, we assume that the different velocities obtained at each point at different times are independent of each other, and that therefore the uncertainties (a) add as squares, e.g.:
Annual uncertainty σa = [(76)2 + (62)2 + (342)2]11// 2 = 356 ma−1 (or 0.97 m d 1).
However, for groups of n adjacent vectors (expected to have similar velocities) that are averaged, the uncertainty σ = [n]1/2/n. For example, for the October 2000–March 2001 pair, if 10 vectors are averaged, then the uncertainty σ = 76[10]1 / 2 / 1 0 = 24ma−1. For the annual case, averaging 10 vectors yields an uncertainty of 113 m a−1.
In Figure 2, which shows the velocities derived from time-adjacent image pairs, the calculated error bars for each specific glacier area considered are also shown. High uncertainties in the short-term adjacent 12 September–14 October 2001 pair indicate that the increase in velocity is smaller than the calculated uncertainty (0.94md−1) and is therefore questionable.

Fig. 2. seasonal variations of ice-flow velocities at different calving fronts (uwt, UCT, UET), and um (for locations see fig. 1), derived from cross-correlation.
Results
Ice velocity
The cross-correlation method permitted the displacements of supraglacial features to be tracked on ETM + images. Displacement vectors were computed for each time-adjacent pair, allowing the resolution of the intra-annual variation in the velocity field. The poor quality of the 27 October 2000 image, combined with the pronounced ice deformation throughout the year, and very high ablation rates estimated at 16 ± 2 m of ice thickness (Reference Naruse, Skvarca and TakeuchiNaruse and others, 1997), prevented the tracking of ice features and therefore computation of annual vectors using the two October images. However, the average annual velocity was obtained by adding the vectors derived from time-adjacent image pairs in those parts of the grid where there were vectors from all image pairs.
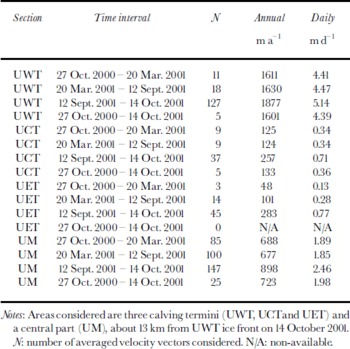
The results of applying the cross-correlation method to time-adjacent image pairs are given in Figures 1 and 2 and Table 1. Figure 1 shows the velocity vectors of the lower glacier and tributaries derived using 27 October 2000 and 20 March 2001 images. For clarity purposes, about 35% of the vectors are not illustrated. Table 1 provides annual and daily velocities resulting from the analysis of time-adjacent ETM+ image pairs in areas of particular interest such as the three calving fronts and the main glacier tongue (UM), indicated by squares in Figure 1. Finally, seasonal variations in ice-flow velocity in different sections considered are shown in Figure 2.
Table 1. Annual and daily velocities derived from the time-adjacent pairs of sequential Landsat 7 ETM+ images by cross-correlation
Glacier retreat
Glaciar Upsala west terminus was subject to almost continuous recession from late 1978 to early 1999. Measured ice-front positions indicate that retreat slowed down during 1979–81, 1984–86 and 1995–97. Recent Landsat images reveal that two decades of strong retreat have been followed by a period characterized by short advances and retreats. Figure 3 clearly indicates that since 12 September 1998 the UWT front has been oscillating within about 400 m, alternating between short-term (austral) autumn–winter advances and (austral) spring–summer retreats. The available ETM+ images also enabled the monitoring of UCT and UET front positions from 13 June 2000 to14 October 2001. The glacier front retreated at a rate of 70 ma−1 at UCT, and 150ma−1 at UET.

Fig. 3. Cumulative ice-front positions of UWT from September 1998 to 14 October 2001, derived from sequential imagery. The terminus fluctuated over a distance of about 400 m.
Calving rate
The ice-flow velocities derived by the cross-correlation method also allowed the updating of calving speeds at all three calving fronts. The calving rate uc can be written as
where ui is ice velocity, dL is change in front position and dt is time interval.
At UWT the calving rate averaged over the period covered by ETM + images is 1710 m a−1. Equation (1) also permits uc to be calculated for both ice fronts calving into Lago Guillermo, yielding calving speeds of 195 and 250ma−1 for UCT and UET, respectively. By using the water-depth profiles measured in late 1999 in Brazo Upsala (Reference Naruse and SkvarcaNaruse and Skvarca, 2000; Reference Skvarca, de Angelis, Aniya and NaruseSkvarca and De Angelis, 2001; Reference Skvarca, de Angelis, Naruse, Warren and AniyaSkvarca and others, 2002) and bathymetry of Lago Guillermo obtained by Reference Warren, Greene and GlasserWarren and others (1995), new data are incorporated which strengthen the calving-rate/water-depth relationship so far derived for fresh-water calving glaciers (Reference Funk and RothlisbergerFunk and Rothlisberger, 1989; Reference Warren, Greene and GlasserWarren and others, 1995; Reference Skvarca, de Angelis, Naruse, Warren and AniyaSkvarca and others, 2002). This relationship is expressed by
where k is a constant obtained empirically. The value k = 3.49 resulting from the present work is slightly lower than that recently proposed by Reference Skvarca, de Angelis, Naruse, Warren and AniyaSkvarca and others (2002).
Discussion
It has been suggested that seasonal variability in ice-flow velocity of Patagonian glaciers is not considerable, especially for fast-flowing calving glaciers (Reference WarrenWarren, 1999). This is confirmed by measurements carried out throughout the year 1993/94 at nearby Glaciar Moreno. The velocities measured in November–December 1993 were larger than the annual mean, but only small variations were detected between December 1993–March 1994 and March–December 1994 (Reference Skvarca and NaruseSkvarca and Naruse, 1997). Furthermore, the velocities measured on the same glacier during the periods November 1995–March 1996–November 1996 –March 1997, i.e. during two consecutive summers and a winter period in between, indicated an average variation of only 7%, with the summer velocities being larger than the winter (Reference Rott, Stuefer, Siegel, Skvarca and EckstallerRott and others, 1998; Reference StueferStuefer, 1999). The velocity data derived for Glaciar Upsala also exhibit almost no seasonal variations at UM, UWT, UCTand UET. The12 September–14 October 2001 velocities are not included, owing to the large errors induced by the method due to the short time interval of the image pair.
The first direct annual ice-flow velocity on Glaciar Upsala was measured by Reference Aniya and SkvarcaAniya and Skvarca (1992). They derived a mean value of 675 ma−1 about 4–5km from the UWT front, by tracking a distinctive debris lump visible on two aerial photographs taken in 18 November 1968 and 11 March 1970, indicated by triangles in Figure 1. Our recalculation with improved georeferencing yielded an average speed of 855m a−1 for this particular feature. Because of UWT’s dramatic recession, the ice front has retreated beyond this section; therefore no velocity could be determined for comparison purposes. However, this part of Upsala west terminus still existed in 1990–93, where daily velocities were measured yielding 1314 ma−1 and 1606ma−1 extrapolated values, respectively, indicating that annual satellite velocity had almost doubled since 1978. This large acceleration in ice motion during the last two decades may be partly due to the release of backstress when the glacier retreated beyond the islands in Brazo Upsala (not visible in Figure 1), which acted as pinning points (Reference Naruse, Skvarca and TakeuchiNaruse and others, 1997), and may partly explain the large thinning rate measured in the early 1990s by Reference Skvarca, Satow, Naruse and LeivaSkvarca and others (1995b). This could, in turn, be responsible for drastic glacier retreat in the last two decades. However, additional investigations on ice-flow velocity mustbe carried out on this fast-movingglaciertongue in order to confirm this hypothesis.
It may be observed that average spring–summer (October 2000–March 2001) and autumn–winter (March–September 2001) velocities at UWT (4.41–4.47md−1) about 2 km upstream are much higher than the short-term velocity of 3.6 md−1 measured in the field in November 1990 (Reference Naruse, Skvarca, Kadota and KoizumiNaruse and others, 1992), but are similar to the value of 4.3 md−1 measured in November 1993 (Reference Skvarca, Satow, Naruse and LeivaSkvarca and others, 1995b). Assuming no change in the sign of velocity gradient during the period, it is concluded that UWT underwent a significant acceleration, as already suggested by Reference Naruse and SkvarcaNaruse and Skvarca (2000). However, the velocities obtained at UCT and UET are of the same order of magnitude as derived by the conventional topographic method in 1992–93by Reference Warren, Greene and GlasserWarren and others (1995).
Conclusions
Surface ice-flow velocities have been derived for the first time by applying the cross-correlation method to optical images over fast-flowing Glaciar Upsala, a large fresh-water calving glacier of HPS. Four Landsat 7 ETM+ images dating from late October 2000 to mid-October 2001 enabled us to derive ice motion and to update the ice-front positions. Almost no change in ice velocity was detected in the spring–summer and autumn–winter seasons in all calving termini, in agreement with field measurements carried out at nearby Glaciar Moreno. Comparison with short-term daily velocities measured in the field during November 1993 extrapolated to a year shows good agreement. The poor quality of the October 2000 image, combined with strong ice deformation and high ablation rates, prevented computation of annual vectors. However, the average annual velocity was derived by adding the vectors obtained from time-adjacent image pairs. Comparison with velocity measurements obtained by tracking surface features 30 years ago suggests that UWT was subject to strong acceleration after the release of backstress, coincident with a large glacier thinning rate which may in turn be responsible for the drastic recession affecting UWT from 1978 to 1999. Analysis of recent frontal variation at the west glacier terminus indicates periodic readvances and retreats, following two decades of dramatic recession. In contrast, during the same period both calving fronts at Lago Guillermo have retreated. In addition, the ice velocities and front positions allowed the computation of calving speeds at the three termini, which, in combination with the known water depths, allowed us to confirm the strong relationship between the calving rate and water depth at fresh-water calving glaciers.
Acknowledgements
The authors are very much indebted to CONAE for providing the Landsat ETM+ images. Thanks are also due to the personnel of Sub-Prefectura Lago Argentino, Prefectura Naval Argentina, Administracion de Parques Nacionales and Servicio de Hidrografía Naval, Armada Argentina, for their efficient logistic support during the field campaigns carried out in Lago Argentino. This work is a contribution to the “Ice–Climate Interaction and Dynamics of Glaciers on Antarctic Peninsula and Southern Patagonia” project of Direccion Nacional del Antartico–Instituto Antartico Argentino.


