


Choline has been identified as an important nutrient for humans. Choline is predominantly obtained from the diet, but it can also be synthesised de novo ( Reference Zeisel, Da Costa and Franklin 1 ). In the body, choline is important for the maintenance of structural integrity of cell membranes, methyl metabolism, cholinergic neurotransmission, transmembrane signalling and lipid and cholesterol transport and metabolism( Reference Zeisel and Blusztajn 2 ). Deficiency of choline has been associated with fatty liver( Reference Buchman, Dubin and Moukarzel 3 ), liver damage( Reference Zeisel, Da Costa and Franklin 1 ) and muscle damage( Reference Fischer, daCosta and Kwock 4 ). As data were insufficient to set an estimated average requirement and an RDA for choline, the Institute of Medicine (IOM) in the USA set in 1998 a number of adequate intake (AI) values depending on age and sex: 200 mg/d for children aged 1–3 years, 250 mg/d (4–8 years) and 375 mg/d (9–13 years) for children, 400 mg/d (girls) and 550 mg/d (boys) for adolescents aged 14–18 years, 425 mg/d (women) and 550 mg/d (men) for adults older than 19 years, 450 mg/d for pregnant women or adolescents and 550 mg/d for lactating women or adolescents( 5 ). The values for adults focused on the prevention of liver damage, based on a single study on males( Reference Zeisel, Da Costa and Franklin 1 ). The values for children were derived from the AI for adults through a mathematical approach (allometric scaling)( Reference Zeisel, Da Costa and Franklin 1 , 5 ). A tolerable upper intake level (UL) was set by IOM at 3·5 g/d for adults aged 19 years and above (including pregnant or lactating adult women). In addition, UL were derived by IOM from the UL for adults and were set at 3 g/d for adolescents (14–18 years) and at 2 g/d (9–13 years) and 1 g/d (1–8 years) for children. The UL values were based on reported hypotension in a study on seven patients, and cholinergic effects and fishy body odour in four studies on patients, after oral administration of choline( 5 ). Until recently, it was difficult to calculate the dietary intake for choline, as little information was available on choline content in foods. Based on the consumption habits reported by thirty-two healthy adult volunteers and newly published choline content data, Fischer et al.( Reference Fischer, Scearce and Mar 6 ) estimated for the first time in 2003 a mean choline intake of 6·7–8·4 mg/kg body weight per d for women and men, respectively. To stimulate choline intake assessment, the United States Department of Agriculture (USDA) developed a database that provides researchers and consumers with data about the choline content in foods( 7 ). First published in 2008, this database is being regularly updated( 7 , 8 ). Based on this database, the choline intake was estimated for the general population in the USA( 9 , 10 ), Taiwan( Reference Chu, Wahlqvist and Chang 11 ), New Zealand( Reference Mygind, Evans and Peddie 12 ) and also for a group of pregnant and lactating women in Canada( Reference Lewis, Subhan and Bell 13 ). Depending on the country, sex and age class, the mean choline intake was estimated between 222 and 415 mg/d( Reference Fischer, Scearce and Mar 6 , 9 – Reference Lewis, Subhan and Bell 13 ). Variability in nutrient intake estimates is commonly observed across country, sex and age class( Reference Slimani, Fahey and Welch 14 – Reference Tabacchi, Wijnhoven and Branca 16 ). In Europe, no national intake estimates of choline are available yet. Estimating the choline intake in different European countries could provide insight into choline intake at a national level. In addition, ranges of choline intake between the different countries could be obtained for Europe. The aims of this study were to estimate the choline intake for different age classes by combining choline composition data from the USDA database with available and representative food consumption data from European countries and to characterise the main food groups contributing to the daily intake of choline.
Methods
Food consumption data
Food consumption data from the European Food Safety Authority (EFSA) European Comprehensive Food Consumption Database (Comprehensive Database) were used for the intake assessment. This database is the result of an agreement between the EFSA and European countries to pool national-level consumption data collected through representative dietary surveys carried out in each country. First published in 2010, this database is regularly updated when new dietary surveys become available( 17 , Reference Merten, Ferrari and Bakker 18 ). At the end of 2014, the Comprehensive Database contained consumption data of about 67 000 individuals originating from thirty-three surveys, representing eighteen European countries and covering all age classes from infants to very elderly people. Foods in the database are coded according to the FoodEx classification system, which consists of a food list containing approximately 2000 food items, organised in four levels of hierarchy( 19 ).
Out of the thirty-three surveys present in the Comprehensive Database, twelve were considered for this assessment. These surveys were selected because they corresponded to the most recent food consumption data collected in Europe and for which foods were described according to an upgraded version of FoodEx – FoodEx2. This version allows for a more precise description of foods than the previous one. In brief, FoodEx2 is still based on a main food list of 2673 entries, hereafter referred to as ‘basic FoodEx2 code’. In addition, a catalogue of twenty-eight properties (hereafter mentioned as ‘facets’) is available in order to describe characteristics of the foods, such as physical state (e.g. powder, purée-type, liquid), processing technology (e.g. boiling, frying, baking, drying) or fortification (e.g. fortified with vitamins only)( 19 ). Such characteristics are important to be considered when assessing nutrient intake, because nutrient content may vary greatly depending on them. Consequently, surveys for which foods were not described at this level of detail in the Comprehensive Database were considered not fit for the purpose of nutrient intake assessment.
Table 1 presents the characteristics of each dietary survey. The countries included were Finland( Reference Helldan, Raulio and Kosola 20 – Reference Kyttälä, Erkkola and Kronberg-Kippilä 22 ), France( 23 ), Germany( Reference Banasiak, Heseker and Sieke 24 , Reference Mensink, Bauch and Vohmann 25 ), Ireland( 26 ), Italy( Reference Sette, Le Donne and Piccinelli 27 ), Latvia( 17 ), The Netherlands( Reference Van Rossum, Fransen and Verkaik-Kloosterman 28 ), Sweden( Reference Amcoff, Edberg and Enghardt Barbieri 29 ) and the UK( 30 ). Dietary surveys were conducted between 2000 and 2012. They were primarily conducted with the objective to monitor the nutrient intakes at the national level. The consumption habits were collected using 3–7-d food records, 24-h recalls performed on at least 2 d and 48-h recalls. These dietary assessment methods have been reported to be valid methods to estimate the nutrient intake at a national level and are commonly used worldwide( Reference Beer-Borst and Amado 31 – 34 ). Across the countries, the age classes covered for the intake assessment were toddlers (1 to ≤3 years old), ‘other children’ (3 to ≤10 years old), adolescents (10 to ≤18 years old), adults (18 to ≤65 years old), elderly people (65 to ≤75 years old) and very elderly people (≥75 years old). These are the standard age classes retained to present nutrient intake and exposure levels in Europe, except infants( 17 ). Food consumption data were provided by four dietary surveys for toddlers, by seven dietary surveys for both ‘other children’ and adolescents, by eight dietary surveys for adults, by seven dietary surveys for elderly people and by five dietary surveys for very elderly people. Data on infants were not taken into account in this nutrient intake assessment due to limited quantification of human breast milk in the dietary surveys( Reference Helldan, Raulio and Kosola 20 , Reference Banasiak, Heseker and Sieke 24 , Reference Sette, Le Donne and Piccinelli 27 ). The Latvian survey( 17 ) focused only on pregnant women and adolescents.
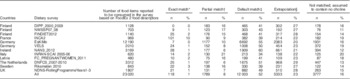
Table 1 Characteristics of the twelve dietary surveys from the European Food Safety Authority Comprehensive European Food Consumption Database included in the choline intake assessment

DIPP, type 1 Diabetes Prediction and Prevention survey; NWSSP, Nutrition and Well-being of Secondary School Pupils; FINDIET, National Dietary Survey of Finland; INCA, étude Individuelle Nationale de Consommations Alimentaires; EsKiMo, Ernährungstudie als KIGGS-Modul; VELS, Verzehrsstudie zur Ermittlung der Lebensmittelaufnahme von Säuglingen und Kleinkindern für die Abschätzung eines akuten Toxizitätsrisikos durch Rückstände von Pflanzenschutzmitteln; NANS, National Adult Nutrition Survey; INRAN-SCAI, Istituto Nazionale di Ricerca per gli Alimenti e la Nutrizione – Studio sui Consumi Alimentari in Italia; FC_PREGNANTWOMEN, food consumption of pregnant women in Latvia; DNFCS, Dutch National Food Consumption Survey; NDNS, National Diet and Nutrition Survey.
* Starting and ending years of the survey.
† Maximum number of reporting days per subject.
‡ Number of subjects with at least 2 reporting days.
Considering the methodological differences for the collection of consumption habits between the surveys, the surveys were not combined and no single European estimates were assessed in this study. Each survey data set is used separately and the resulting estimates cannot be interpreted in country-to-country comparisons. Such approach is in line with the EFSA guidance on the use of the Comprehensive Database for exposure assessment( 17 ). As nutrient intake estimates may vary across countries, sex and age( Reference Slimani, Fahey and Welch 14 – Reference Tabacchi, Wijnhoven and Branca 16 ), the choline intake estimates for each dietary survey provide insight for the ranges of choline intake in Europe.
Consumption of dietary supplements was not taken into consideration in this study.
Choline composition data
No choline composition data are currently available within national food composition databases available in Europe. Choline content of foods considered in this intake assessment were, therefore, extracted from the National Nutrient Database for Standard Reference, release 26 of the USDA( 7 ) issued in November 2013. This database provides information on total choline content of US foodstuffs, calculated as the sum of five choline-contributing metabolites – free choline, glycerophosphocholine, phosphocholine, phosphatidylcholine and sphingomyelin. The USDA database also provided data on betaine content of foods, which were, however, not taken into account in this intake assessment. For chemical analysis, choline compounds were extracted, partitioned into organic and aqueous phases using methanol and chloroform and analysed directly by liquid chromatography electrospray ionization-isotope dilution MS( Reference Koc, Mar and Ranasinghe 35 ). The overall quality and reliability of the analytical results was assessed as good by the USDA( 8 ). A total of 4467 values were extracted from the USDA database, 26 % corresponding to analytical results, 73 % being calculated or imputed and 1 % being assumed at 0. Choline content ranged from 0 mg/100 g of food (e.g. alcoholic beverages, water, candies) to 2403·3 mg/100 g (egg yolk, dried).
The nutrient composition food list considered in this assessment was created by re-coding the USDA nutrient composition food list, which is based on the LanguaL food description thesaurus, according to the FoodEx2 classification system of the EFSA( 19 , Reference Ireland and Moller 36 ).
The first challenge was the difference in the level of detail between the USDA nutrient composition food list and the FoodEx2 classification system. For example, a meat type such as beef appeared in the USDA nutrient composition food list about 680 times and was described according to the part of the animal (chuck, rib, short loin, round, flank, etc.) and the processing method (raw, baked, cooked, roasted, etc.). The FoodEx2 classification system, however, does not take the different parts of the animal into account and contains only one type of beef meat (bovine fresh meat) among the basic FoodEx2 codes, whereas the processing method is described as a facet. To avoid exclusion of major contributors to choline intake from the intake assessment, the choline composition data of all parts of the animal from the USDA nutrient composition food list were averaged for each processing method, and then coded with the basic FoodEx2 code for beef meat including a relevant processing facet descriptor (raw, baked, cooked, roasted, etc.). The same type of averaging was carried out for the following food items: turkey, veal, pork, lamb, chicken, game meat, infant formula (powder or liquid) and ice cream (milk or water based). A total of 1610 food items of the USDA nutrient composition food list were averaged to form 107 equivalent food items coded according to FoodEx2.
Another challenge concerned commercial food products such as breakfast cereals and baby foods. In the USDA nutrient composition food list, such foods were described according to their brand names, whereas in the FoodEx2 classification system they are classified according to their main ingredient and brand names are not taken into account. In order to include such products in the intake assessment, the ingredient list of the US commercial product was screened on the internet (e.g. company website) and further coded according to its main ingredient – for example, the breakfast cereal product ‘General Mills, Kix’ (General Mills, Inc.) was coded as ‘processed maize-based flakes’ in the FoodEx2 classification system. A total of 486 food items of the USDA nutrient composition food list were coded according to their main ingredient.
Finally, some food items present in the USDA nutrient composition food list, such as chrysanthemum garland or lotus root, had no corresponding code in the FoodEx2 classification system. When no equivalent could be found, the food item was excluded from the nutrient composition food list considered in this assessment. This included a total of 280 (6 %) individual food items out of 4467 items present in the USDA nutrient composition list.
In the end, choline composition was available for 2684 food items of the FoodEx2 system for the intake assessment.
Matching composition and consumption data
The linking of the consumed foods with the choline composition values was carried out following three types of matching:
-
1. ‘Exact match’, the food consumed had an equivalent in the composition data matching the basic FoodEx2 code and all the available facet descriptors. The value provided (or an average if there were several corresponding foods) was used.
-
2. ‘Partial match’, the food consumed had an equivalent in the composition data matching the basic FoodEx2 code and a selection of four FoodEx2 facet descriptors relevant for this intake assessment: processing technology (e.g. coating, slicing, roasting), vitamin and mineral fortification agent, physical state (e.g. powder, liquid, purée) and qualitative information (e.g. reduced sugar, reduced salt, full fat). The value provided (or an average if there were several corresponding foods) was used.
-
3. ‘Default match’, the food consumed had an equivalent in the composition data regarding only the basic FoodEx2 code. The average of all the foods with the same basic FoodEx2 code in the composition data was used.
When no equivalent basic FoodEx2 code could be found in the composition food list (i.e. the composition value was missing), an extrapolation from a related FoodEx2 code was considered. The substitute code was either a (existing) FoodEx2 code (e.g. the lacking choline content of ‘oat grains’ was replaced by that of the code ‘oat groats’) or an average of several basic codes at a higher level of the FoodEx2 hierarchy (e.g. a missing choline value for ‘undefined mixed poultry fresh meat’ was replaced with the average of choline values in the group of ‘poultry fresh meat’). Such extrapolations were carried out only for foods corresponding to at least one of the following criteria:
-
– Foods frequently consumed (number of consumption events>2000 considering the entire consumption data set, e.g. the missing FoodEx2 code of the frequently consumed ‘salami-type sausage’ is replaced by the FoodEx2 code of ‘chorizo and similar’).
-
– Foods consumed in a considerable ‘large’ amount (defined here as total consumption of the food by 1000 individuals of the database>100 kg/d, e.g. the missing FoodEx2 code of the widely consumed ‘cows’ skimmed milk’ is replaced by the FoodEx2 code of ‘cows’ semi-skimmed milk’).
-
– Foods from a food group containing similar foods with ‘high’ choline content (defined as among the highest 10 % in the choline composition data set, e.g. the missing FoodEx2 code of the high in choline content food ‘cream powder’ is replaced by the FoodEx2 code of ‘milk powder’).
-
– Foods belonging to one of the main food groups contributing to choline intake based on a preliminary analysis.
The remaining food items such as garlic purée or cloudberries were not taken into account in the intake assessment (i.e. choline content was considered as 0).
Table 2 details the typology of matching between the consumption and composition data for each survey considered in this assessment and for the entire consumption database. Out of the 23 020 FoodEx2 codes available in the entire consumption database, 118 (1 %) had an ‘exact match’, 1789 (8 %) a ‘partial match’ and 12 003 (52 %) a ‘default match’ in the composition data set. A choline value could be extrapolated for 5333 (23 %) other FoodEx2 codes. The remaining 3777 Foodex2 codes (16 %) were assigned a choline content of 0 for this intake assessment. This typology was similar across the different surveys.
Table 2 Typology of matching between the food consumption and choline composition data by dietary survey (Numbers and percentages)
DIPP, type 1 Diabetes Prediction and Prevention survey; NWSSP, Nutrition and Well-being of Secondary School Pupils; FINDIET, National Dietary Survey of Finland; INCA, étude Individuelle Nationale de Consommations Alimentaires; EsKiMo, Ernährungstudie als KIGGS-Modul; VELS, Verzehrsstudie zur Ermittlung der Lebensmittelaufnahme von Säuglingen und Kleinkindern für die Abschätzung eines akuten Toxizitätsrisikos durch Rückstände von Pflanzenschutzmitteln; NANS, National Adult Nutrition Survey; INRAN-SCAI, Istituto Nazionale di Ricerca per gli Alimenti e la Nutrizione – Studio sui Consumi Alimentari in Italia; FC_PREGNANTWOMEN, food consumption of pregnant women in Latvia; DNFCS, Dutch National Food Consumption Survey; NDNS, National Diet and Nutrition Survey.
* The food consumed has an equivalent in the composition data matching the basic FoodEx2 code and all the available facet descriptors.
† The food consumed has an equivalent in the composition data matching the basic FoodEx2 code and four FoodEx2 facet descriptors (processing technology, vitamin and mineral fortification agent, physical state and qualitative information).
‡ The food consumed has an equivalent in the composition data regarding only the basic FoodEx2 code.
§ The food consumed has no basic FoodEx2 code present in the composition food list, an extrapolation from a related FoodEx2 code is considered.
Choline intake calculations
Choline intake was calculated at the individual level by multiplying, for each food item, the average consumption level by the corresponding choline content and summing up the respective intakes throughout the diet of each subject. The mean as well as the 5th, 50th and 95th percentiles of intake were derived at the population level for each survey, age class and sex. Results were expressed as total choline in mg/d. Means were compared with the AI and 95th percentiles with the UL as set by the IOM( 5 ). The contribution of the twenty-one main food groups (FoodEx2 level 1)( 19 ) to the mean total choline intake was determined, for each age class, sex and survey, as the ratio between the mean choline intake resulting from the consumption of the food group and the mean total choline intake and expressed as percentage contribution. Further, for each age class and sex, the lowest and highest percentage contributions of the main food groups found across the surveys were retained. Within the main food groups, the highest contributing food item (FoodEx2 level 2)( 19 ) was described. The calculations were carried out using SAS software (SAS Enterprise Guide® 5.1, 2013).
Results
Choline intake
Estimated choline intakes for males and females per age class and survey are presented in Table 3. Average choline intake ranged from 151 to 210 mg/d among toddlers (1–3 years) and from 177 to 304 mg/d among ‘other children’ (3 to <10 years). These values were below the corresponding AI, as defined by the IOM( 5 ), for toddlers in almost all the surveys (except for males in the UK and Italy). For ‘other children’ (3 to <10 years), the average intake was below the AI of children (4–8 and 9–13 years) in one-third of the surveys. The 5th percentile of choline intake ranged from 79 to 132 mg/d among toddlers and from 106 to 186 mg/d among ‘other children’. The 95th percentile choline intakes ranged from 242 to 313 mg/d among toddlers and from 263 to 487 mg/d among ‘other children’. Toddlers were below the UL of 1 g/d and ‘other children’ were below the UL of 1–2 g/d (4–8 and 9–13 years) as defined by the IOM( 5 ).
Table 3 Total choline intake estimates among males and females in twelve different European surveys according to age class and country (Number of subjects; medians and 5th and 95th percentiles)
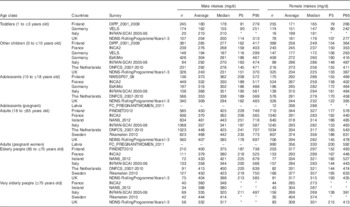
–, No data; DIPP, type 1 Diabetes Prediction and Prevention survey; VELS, Verzehrsstudie zur Ermittlung der Lebensmittelaufnahme von Säuglingen und Kleinkindern für die Abschätzung eines akuten Toxizitätsrisikos durch Rückstände von Pflanzenschutzmitteln; INRAN-SCAI, Istituto Nazionale di Ricerca per gli Alimenti e la Nutrizione – Studio sui Consumi Alimentari in Italia; NDNS, National Diet and Nutrition Survey; INCA, étude Individuelle Nationale de Consommations Alimentaires; EsKiMo, Ernährungstudie als KIGGS-Modul; DNFCS, Dutch National Food Consumption Survey; NWSSP, Nutrition and Well-being of Secondary School Pupils; FC_PREGNANTWOMEN, food consumption of pregnant women in Latvia; FINDIET, National Dietary Survey of Finland; NANS, National Adult Nutrition Survey.
* 5th or 95th percentile intakes calculated over a number of subjects <60 require cautious interpretation as the results may not be statistically robust(17), and therefore for these dietary surveys/age classes the 5th and 95th percentile estimates are not be presented in the intake results.
Among males, the average intake estimates ranged from 309 to 373 mg/d in adolescents (10 to <18 years), from 357 to 468 mg/d in adults, from 358 to 450 mg/d in elderly people and from 332 to 444 mg/d in very elderly people. These values were all below the AI( 5 ). The 5th percentile of choline intake ranged from 162 to 208 mg/d among adolescents and from 178 to 251 mg/d among adults, elderly and very elderly people. The 95th percentile choline intakes, ranging from 483 to 572 mg/d among adolescents (10 to <18 years old) and from 474 to 773 mg/d among adults, elderly and very elderly people, were below their UL of 3 g/d (adolescents 14–18 years) and 3·5 g/d (adults>19 years). Among females, average intake estimates ranged from 244 to 336 mg/d in adolescents (10 to <18 years), from 291 to 374 mg/d in adults, from 284 to 377 mg/d in elderly people and from 269 to 404 mg/d in very elderly people. As for the male population groups, they were below their corresponding AI( 5 ). The 5th percentile of choline intake ranged from 122 to 175 mg/d among adolescents and from 138 to 633 mg/d among adults, elderly and very elderly people. The 95th percentile choline intakes, ranging from 395 to 744 mg/d among adolescents (10 to <18 years) and from 391 to 633 mg/d among adults, elderly and very elderly people, were also below the corresponding UL values.
Among pregnant women from the Latvian survey, the average choline intake was 336 mg/d in the adolescent age class and was 356 mg/d in the adult age class. These were below the AI of 450 mg/d defined for pregnant women or adolescents( 5 ). The 5th percentile of choline intake in Latvian adult pregnant women was 200 mg/d, whereas the 95th percentile was 592 mg/d.
Overall, choline intake was higher among males compared with females, mainly due to larger quantities of food consumed per day. Indeed, when looking at intake per unit of energy intake (mg/MJ), no difference between the intakes of males and females was observed (data not shown).
Main food contributors
The lowest and highest percentage contributions of the eight main contributing food groups (highest contribution>10 %) to total choline intake across available surveys are presented per age class in Table 4 for males and in Table 5 for females. The main food group contributor to choline daily intake was ‘meat and meat products’, representing >10 % and up to 37 % of the total intake in all population groups. Other main contributing food groups were milk, grain, egg and their derived products, composite dishes and fish and seafood, representing, respectively, 7–40, 6–22, 3·5–23, 0·4–19 and 0·6–14 % over all age groups. Within these main food groups, the detailed contributing foods (FoodEx2 level 2) were animal fresh meat, bread and similar products, milk, whey and cream, unprocessed eggs, ready-to-eat meals (excluding soups and salads) and fish. Food groups with little contribution (highest contribution<10 %) to total choline intake (data not shown in Tables 4 and 5) were water-based beverages (0–0·6 %), alcoholic beverages (0–9·8 %), coffee, cocoa, tea and infusions (0·1–5·1 %), fats and oils (0·2–1·2 %), sugar and confectionery (0·1–2·3 %), legumes, nuts and oilseeds (0·4–3·6 %), products of non-standard diets and food imitates (0–2·3 %), fruits (1·1–6 %), vegetables (1·9–8·4 %), fruit and vegetable juices (0·2–2·9 %), starchy roots and tubers (2·6–7·9 %), additives (0–0·3 %) and seasoning (0·1–1·5 %). The food contributors were the same in males and females, and the percentage contribution was in the same order of magnitude (e.g. for ‘meat and meat products’ 22·8–37·1 % for adult males and 21·6–31·8 % for adult females). Similarity in the contribution of food groups for the different age classes was found in the different surveys (data not shown).
Table 4 Lowest and highest percentage contributions of the main contributing food groups to the mean total choline daily intake across available surveys per each age class, in males
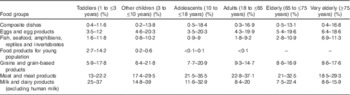
–, No intake recorded.
Table 5 Lowest and highest percentage contributions of the main contributing food groups to the mean total choline daily intake across available surveys per each age class, in females
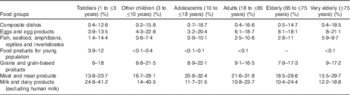
–, No intake recorded( Reference Fischer, daCosta and Kwock 4 ).
Discussion
To our knowledge, this study is the first to estimate the choline intake for different age classes in males and females at the European level. This study was based on detailed, high-quality and partially harmonised food consumption data available at the European level. Indeed, the twelve dietary surveys considered in this study were mostly in line with the requirements defined by the EFSA for the collection of consumption data for risk assessment( 34 ). The surveys were representative of the general population or of specific population groups such as pregnant women; the consumption data have been collected at the individual level, with at least 2 reporting days per subject; subject characteristics involved the same descriptors; and foods were described using the same food classification system (FoodEx2). Surveys were based either on dietary records from 3 to 7 d, or on 24- or 48-h recalls, repeated at least twice. Considering the main sources of choline in the diet – meat, milk, grains, eggs and their derived products – which are commonly consumed foods in Europe, the data collected with such instruments are considered as fit for purpose, without considering the inputs from an FFQ targeting scarcely consumed food. However, due to the different methodologies between the surveys, the resulting estimates cannot be interpreted in country-to-country comparisons. Harmonisation of methodologies for collecting food consumption surveys are underway, but fully harmonised consumption data at the European level are not expected before 2020( 37 ). At the time of this study, it was not known whether choline was common in the supplements consumed by the European population. Choline intake from consumption of supplements has consequently not been taken into account, which may have led to an underestimation of the total intake.
The findings of this study are in line with the limited number of studies available from other jurisdictions( Reference Fischer, Scearce and Mar 6 , 9 – Reference Lewis, Subhan and Bell 13 , Reference Cho, Zeisel and Jacques 38 , Reference Chiuve, Giovannucci and Hankinson 39 ). For example, information obtained from the National Health and Nutrition Examination Survey in the USA showed mean choline intake estimates of 415 mg/d for adult males and 279 mg/d for adult females (20–69 years)( 10 ). In Taiwan, mean choline intake was estimated at 372 mg/d for adult males and 265 mg/d for adult females (18–64 years)( Reference Chu, Wahlqvist and Chang 11 ). Mean estimates for males in the USA and Taiwan fall thereby in the range of the mean total choline daily intake estimated in this study for European adult men aged 18–65 years (357–468 mg/d). For females, the mean estimates in the USA and Taiwan are below the mean total choline daily intake estimated for European adult women in this study (291–374 mg/d). In New Zealand, a study on adult females (18–40 years) had, however, an average choline intake of 316 mg/d, and are thereby similar to the European adult females( Reference Mygind, Evans and Peddie 12 ). In a recent Canadian study( Reference Lewis, Subhan and Bell 13 ), mean total choline intake in women (17–45 years) during pregnancy was estimated at 347 mg/d, which is in the same range as the mean total intake estimated in this study for pregnant Latvian women and adolescents (336–356 mg/d). Nevertheless, direct comparability of choline intake estimates from different surveys available in the literature should be carried out with caution. Even though all the countries( 10 – Reference Lewis, Subhan and Bell 13 ) based their choline intake assessments on the composition data from the USDA Nutrient Database, the usage of different releases of this database may have resulted in variation in choline intake estimates. Especially, an increase in the content of choline for some foods was observed in a new release of the USDA nutrient composition database compared with a previous release published in 2008. For example, a whole raw egg in release 26 published in 2013( 7 ) contains 293·8 mg choline/100 g, whereas it contained 250 mg choline/100 g in release 2 published in 2008( 8 ). Moreover, differences in dietary survey methodology (age classes, number of reporting days, method for data collection) and nutrient intake modelling (i.e. usual intake assessment v. daily intake assessment) may explain the differences in intake estimates published in the literature and the ones estimated in this study. Furthermore, the dietary surveys used in this study have been studied to assess nutrient intakes at the national level, but were not validated for the assessment of dietary choline. To obtain more refined choline intake estimates in the future, it is recommended to validate dietary choline in national surveys.
In this study, the foods contributing highly to the mean daily intake of choline from the diet were meat, milk, grain, egg and their derived products, composite dishes and fish. The contribution of food to choline intake was similar for both sexes. Consistency in the main choline contributors was found when compared with published data( 9 , Reference Chu, Wahlqvist and Chang 11 – Reference Lewis, Subhan and Bell 13 , Reference Cho, Zeisel and Jacques 38 ). For example, in New Zealand, a study on adult women found eggs, red meat, milk and bread as major food contributors to mean total choline daily intake( Reference Mygind, Evans and Peddie 12 ). Main food group contributors in the US population were meat, poultry and fish, grain-based mixed meals, dairy and eggs( 9 ). Any difference in the contribution to the total daily choline intake could be explained by differences in consumption habits in population groups or by the difference in the definition of food groups( Reference Chu, Wahlqvist and Chang 11 ). For example, eggs were found to be the first contributor of choline intake in the adult Taiwanese population, whereas they were the third contributor in the adult US population( Reference Chu, Wahlqvist and Chang 11 , Reference Cho, Zeisel and Jacques 38 ). Nevertheless, an agreement on the major contribution of meat, milk, eggs, grain-based products, composite dishes and fish among the different population groups was found.
The main limitation of this study is related to the absence of choline composition data of European foods. The choline composition data from the USDA database considered in this assessment may not adequately reflect the choline content in foods as purchased and as consumed in Europe. Indeed, choline content can differ due to variations in formulation by manufacturers, different recipes as well as differences in the choline content of individual ingredients( 9 ). Practices of fortification may also be different between the USA and the different European countries taken into account in this study. For example, in the USA, choline is listed on the food additive list of the Food and Drug Administration( 40 ), and in Europe fortification is regulated at a national level where it depends on the country, whether it is added to the food or not( 41 ). In addition, inaccuracies may have occurred in mapping the food composition data from the USDA composition food list according to the FoodEx2 food classification system used in the European food consumption data, especially for foods described by their brand name in the USDA database and foods that are not described at the same level of precision in the FoodEx2 system compared with LanguaL. For example, the averaging of the meat types could have led to misleading results if choline content had been different for the different parts of the animal according to the USDA database( 7 ). However, in meat, little variability was observed in the choline content of the different parts of the animal. Differences in choline content were mainly observed between the different processing technologies (not processed, cooked, roasted, etc.), and these factors were taken into account in the intake assessment. Finally, a number of foods present in the European food consumption data considered in this study had no direct match with the composition data used. For half of them, corresponding to the most consumed foods and/or foods with highest choline content, the missing value was replaced by a value found in a similar food or at the food group level. For the remaining foods, choline contents of 0 were assumed. All these assumptions may have led to underestimation or overestimation of the true total choline intake in the European population.
Conclusion
To our knowledge, this is the first study to provide choline intake estimates for the European population. In most of the population groups considered, the average choline intake was found to be below the AI set in 1998 by the IOM in the USA. Given the definition of AI, no conclusion can be drawn regarding the adequacy of choline intake. These results improve the knowledge about choline intake in Europe, which might be considered for risk management and to initiate further data collections to obtain refined estimates. Especially, in order to improve the quality of the estimates, it is recommended to measure the choline content in the main contributing food items, as available in the European market or in duplicate studies.
Acknowledgements
The authors are grateful to Joseph Shavila (Food Standards Agency, UK) for providing UK consumption data used in this study.
The authors did not receive any funding for this study.
The authors’ contribution are as follows: M. C. O., G. B. M. M., O. L., S. M. V., C. T., L. D’. A., I. M., C. D. and I. S. provided consumption data for the study; F. B. C. V. analysed the composition data and performed the intake assessment; S. I. and L. M. V. assisted with the preparation and interpretation of the data; F. H. assisted with the intake modelling; F. B. C. V. and F. H. wrote the manuscript; F. H. has the primarily responsibility for the final content of the manuscript. All the authors read and approved the final version of the manuscript.
None of the authors has any conflicts of interest to declare.


