


A flurry of epidemiological research into possible preventive roles for vitamin D in chronic diseases such as CVD( Reference Muscogiuri, Sorice and Ajjan 1 , Reference Wang, Song and Manson 2 ), autoimmune disease( Reference Cutolo, Pizzorni and Sulli 3 ) and cancer( 4 ) has been conducted over the past decade. The quality of evidence from these studies has relied heavily upon the means of vitamin D exposure measurement( Reference Millen and Bodnar 5 ). Humans obtain vitamin D via exposure to UVB radiation in sunlight as well as from food and supplements( 4 ).
Self-reporting is a feasible method for assessing lifetime vitamin D exposure in large epidemiological studies, but has known limitations( Reference McCarty 6 ). One of the earliest and most detailed self-report methods for assessing lifetime sun exposure is the Geraldton Skin Cancer Prevention Survey( Reference English, Armstrong and Kricker 7 , Reference Kricker, Armstrong and Jones 8 ), hereafter referred to as the ‘Geraldton survey’. The survey involves self-completion of a pre-interview residential and occupational history calendar covering each year from age 8 years to the respondent's present age, followed by a face-to-face interview. This survey has acceptable test–retest reliability( Reference English, Armstrong and Kricker 7 ), criterion validity( Reference van der Mei, Blizzard and Ponsonby 9 ) and reliability with comparable measures( Reference English, Armstrong and Kricker 7 , Reference Kricker, Vajdic and Armstrong 10 ), and was associated with cutaneous indicators of sun damage in one study( Reference English, Armstrong and Kricker 7 ). However, it imposes appreciable respondent burden and findings for females, who may have poorer recall than males( Reference Kricker, Vajdic and Armstrong 10 ), have been reported only in two studies( Reference Kricker, Vajdic and Armstrong 10 , Reference Yu, Li and Freedman 11 ). Furthermore, the Geraldton survey does not address dietary sources of vitamin D. Questionnaires have been designed specifically to measure dietary vitamin D exposure (e.g. references Reference Thomas, Lloyd-Jones and Thadhani12–Reference Nakamura, Nashimoto and Hori15) but these questionnaires focus upon relatively recent consumption, within the past year.
We developed an efficient, adult lifetime, telephone-administered questionnaire specifically for estimating total vitamin D exposure in Canadian women based on sun and dietary assessment for every tenth year of adult life (e.g. age 20, 30, 40 years, etc.). The aim of the present study was to appraise the utility of our questionnaire for use in a larger study known as the Ovarian Cancer in Alberta (OVAL) Study. Our primary objective was to assess the inter-method reliability of our abbreviated sun exposure questionnaire (the OVAL survey) against the longer Geraldton survey (the assumed ‘gold standard’) and our secondary objective was to estimate total vitamin D exposure, from sun and dietary sources, using the OVAL survey.
Experimental methods
Recruitment
The study was conducted according to the guidelines laid down in the Declaration of Helsinki and all procedures involving human subjects/patients were approved by the Conjoint Health Research Ethics Board at the University of Calgary. Written informed consent was obtained from all participants. Women aged 40–79 years were recruited from March to May 2005 by the Prospective Health Evaluation Unit in the former Calgary Health Region (now Alberta Health Services) using random digit telephone dialling (RDD). We had a final, target sample size of ninety women( Reference Kraemer and Thiemann 16 ) based on the number of women required to rule out an intra-class correlation coefficient (ICC) of 0·40 or lower, using a one-sided test at the 5 % level of significance with 80 % power, and assuming approximately 60 % agreement( Reference Landis and Koch 17 ). A pool of telephone numbers was randomly generated from available prefixes and cross-referenced with business numbers to exclude known business numbers. Eligible women had a confirmed postal code of residence within the health region and the ability to complete an interview in English. At RDD screening, eligible women were informed that participation entailed completion of three self-administered worksheets and two in-depth telephone interviews. Of the 699 residences identified, we successfully screened 625 (89·4 %) households for an eligible participant. Of the 191 eligible women identified, ninety-seven (50·8 %) refused and ninety-four (49·2 %) agreed to participate. Ultimately, four women completed the first interview only and one woman did not complete the diet interview, leaving ninety women in the sun exposure analysis and eighty-nine women in the dietary analysis.
Measurement of lifetime sun and dietary exposures
Participants completed telephone interviews for both the OVAL sun survey and the Geraldton survey( Reference English, Armstrong and Kricker 7 , Reference Kricker, Armstrong and Jones 8 ) eight weeks apart using a randomized crossover design (Fig. 1). The order of interview completion was determined by generating a random number for each participant study number. Those with odd numbers completed the OVAL survey, then the Geraldton survey (n 45); while those with even numbers completed the Geraldton survey, then the OVAL survey (n 45). In preparation for each interview, women were mailed several worksheets to facilitate recall. For the Geraldton survey, women completed a Personal Residence Work Worksheet for each year between 18 and 79 years of age that recorded the following for each age or groups of ages with the same residence/work pattern: calendar year, place of residence, job title or school attended, and number of days per week on and off work/school. For the OVAL survey, women completed the Personal Residence, Work, and Holiday Worksheet for specified ages at 10-year age intervals (20, 30 years, etc.) to age 70 years that recorded the following for each age: calendar year, place of residence, job title or school attended, and number of days per week on and off work/school. It also included winter holidays (1 October–31 March for women residing north of 42°N and 1 April–30 September for women residing south of 42°S) to a location at a lower latitude than normal residence, because winter sun holidays can impact serum vitamin D concentrations significantly in some populations( Reference Brustad, Alsaker and Engelsen 18 , Reference Dawson-Hughes, Harris and Dallal 19 ). The women also completed a past-year dietary worksheet prior to the first interview only (regardless of which sun survey was completed first) that focused on vitamin D-containing foods/beverages (milk, margarine, tuna, salmon, shrimp, oysters, sardines, eggs) and supplements (multivitamins, vitamin D, cod-liver oil tablets or liquid). This was used at baseline in the interview to help women recall their previous patterns of intake.
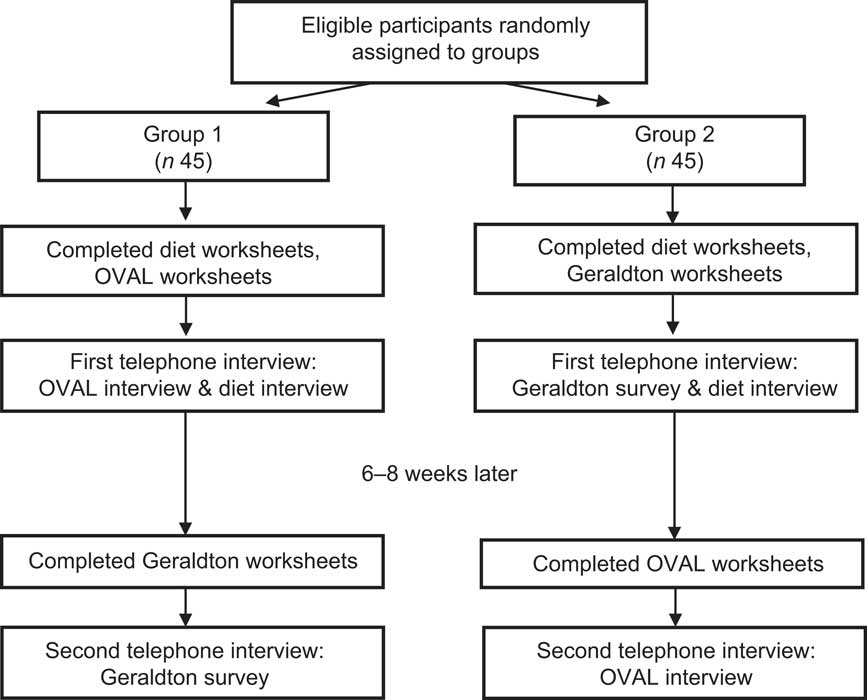
Fig. 1 Flow of participants through the randomized crossover design
To ensure that all worksheets were completed before the interviews, women mailed the completed copy of the worksheets to the study team. Some information (e.g. residential history by age and calendar year) from the worksheets was entered into a computer-assisted telephone interview prior to the interview to reduce interview time.
In the structured telephone interviews, information was recorded that occurred before an assigned reference date (the date of RDD screen) to mirror what would occur in most research studies. The dietary interview, which we developed specifically to estimate vitamin D intake, was adapted from the Canadian modified version of the National Cancer Institute's Diet History Questionnaire( 20 , Reference Csizmadi, Kahle and Ullman 21 ) and estimates, on average, how often and how much vitamin D-containing food was consumed at age 20 years and every tenth year of life thereafter to age 70 years.
Derivation of lifetime vitamin D exposure variables
To estimate average daily dietary vitamin D exposure for each study participant, we summed vitamin D intakes (in international units (IU) per day) for each food in our questionnaire, in each age category (20, 30, 40 years, etc.). Due to smaller numbers of participants, we collapsed the oldest age categories into a representative period of 60+ years. For each food item, average daily vitamin D intake was derived as: (consumption frequency per day) × (portion size in grams) × (vitamin D content per 100 g of food)( 22 ). Precise estimates of consumption frequency and portion size were assigned as for the Canadian adaptation of the National Cancer Institute's Diet History Questionnaire( 20 – 24 ), using the Canadian Nutrient File, or through pilot testing of our questionnaire (for cod-liver oil tablets)( 22 ).
We also estimated the total lifetime and annual mean hours of sun exposure. For the OVAL survey, we used the estimates at every tenth year (20, 30, 40 years, etc.), and applied these to 10-year representative periods (20–29, 30–39 years, etc.) for each of the ninety women. As for the diet variables, we collapsed the oldest age categories into a representative period of 60+ years. For the Geraldton survey, ages with the same sun exposures were determined by each woman (e.g. 20–21, 22–26, 27–34, 35–37 years, etc.), resulting in multiple reported patterns of sun exposure over a fixed 10-year period. To make these estimates analogous to the OVAL survey, we calculated a weighted average of reported exposure with the weight being the number of years for that exposure in the fixed interval. For both instruments, we calculated total lifetime hours by taking a weighted average of weekday and weekend hours spent in the sun, multiplied by number of days in the warmer months per period. We calculated annual averages by dividing total hours by the number of relevant years. In both questionnaires for each pattern of sun exposure, women reported sunscreen use for 1975 and later as never, less than half of the time and greater than half of the time. The OVAL survey is available upon request.
Statistical analysis
Results are expressed as numbers and proportions, means and their standard errors, or medians with interquartile ranges (IQR) for non-normally distributed data. We calculated the statistics in part with SAS version 9·2 and in part with STATA version 11 statistical software packages. Agreement of the Geraldton and OVAL measures was assessed using two-sided t tests, Spearman rank, Pearson, concordance and intra-class correlation coefficients, and a Bland–Altman analysis( Reference Bland and Altman 25 ). The concordance correlation coefficient was calculated using reduced major axis regression analysis, which makes an adjustment to the Pearson correlation for the bias of the regression line away from the line of concordance( Reference Smith 26 , Reference Lin 27 ). For the Bland–Altman analysis, the difference between the Geraldton and OVAL paired measurements represents the mean bias, which is calculated by adding the differences between paired measurements and dividing the sum by the mean of paired measurements. The limits of agreements between methods are defined as the mean difference ±2 sd.
Results
Estimates of total lifetime adult hours of sun exposure for the OVAL survey strongly correlated with comparable measures from the Geraldton survey (Table 1). The average total lifetime sun exposure was 13 913 h in the Geraldton survey which was slightly higher, but not significantly different from the 13 034 h in the OVAL survey. Higher estimates in the Geraldton survey were most pronounced for the 20–29 years age period (Geraldton – OVAL difference: 717 h, 95 % CI 284, 1149 h). For all other age periods, the confidence interval spanned zero, indicating no significant difference between the instruments. Although the Spearman rank correlations were the strongest in older age periods, all estimates for the different types of correlations were very similar within each age period and across all ages. Overall, the total lifetime ICC was 0·77 (95 % CI 0 ·69, 0·86), with each 10-year period ICC ranging from 0·50 to 0·83. The concordance correlations for total hours were almost identical to the Pearson correlations, indicating very small bias corrections.
Table 1 Average differences and correlations between the Geraldton and OVAL survey lifetime measures of sun exposure among randomly selected women (n 90) aged 40–79 years, Calgary, Alberta, Canada, 2004
ICC, intra-class correlation coefficient.
*The concordance correlation coefficient is a measure of agreement on a continuous variable obtained by two different methods. ρ c = ρ × C b, where ρ is the Pearson coefficient and C b is a bias correction factor that measures how far the best-fit line deviates from the 45° line of concordance through the origin.
The estimates of annual average sun exposure from the OVAL survey were also significantly correlated with comparable measures from the Geraldton survey (Table 1). Overall, the annual average ICC was 0·60 (95 % CI 0·47, 0·74), with that for each 10-year period ranging from 0·47 to 0·65. Because the annual average sun exposure was calculated as the total hours divided by the relevant number of years, we saw the same pattern of results as for total hours, with the Geraldton survey having slightly higher estimates than the OVAL survey (Geraldton – OVAL difference: 26 h/year, 95 % CI −5, 57 h/year). This is displayed graphically in a Bland–Altman plot (Fig. 2). The plot scatter suggests little systematic bias by magnitude of estimated sun exposure.

Fig. 2 Bland–Altman plot showing agreement of average annual sun exposure measured from the Geraldton survey and the OVAL survey among randomly selected women (n 90) aged 40–79 years, Calgary, Alberta, Canada, 2004. —— represents the mean difference between the two instruments (Geraldton – OVAL: 26 h/year), – – – – represent the limits of agreement
We also developed an algorithm to convert sun exposure to vitamin D exposure in IU (the same units as for food and supplements and current public health recommendations) using what has been called the ‘Holick formula’( Reference Holick 28 ). In essence, using a number of strong assumptions, we used the minimal erythemal dose (MED; defined as the amount of sun to cause a minimal reddening of the skin) of UVB radiation per hour of sun exposure during the warmer months to estimate a plausible range of the oral vitamin D equivalent in IU for our population. This estimation hinges on the assumption that a full-body exposure to 1 MED of relevant wavelengths of UVB (λ = 290–315 nm)( 29 ) results in a rise in serum 25-hydroxyvitamin D (25(OH)D) that lies between the measurements obtained from oral doses of ergocalciferol (vitamin D2) administered at 10 000 IU (250 μg; plausible lower bound) and 25 000 IU (625 μg; plausible upper bound), estimated to be ≈20 000 IU (500 μg)( Reference Holick 30 ). We also assumed that 1 MED = 250 J/m2( Reference Fitzpatrick 31 ) and that the association of ergocalciferol on serum levels of 25(OH)D is comparable to that of cholecalciferol (vitamin D3)( Reference Millen and Bodnar 5 ). Further assumptions of this model are that a person is lying flat in the equatorial sun at solar noon, at sea level, with the entire body exposed (i.e. 100 % exposure) and is a young to middle-aged adult. We used readily available ambient UV radiation measurements from Edmonton, Alberta, Canada( 32 ), a location that is within approximately 3° latitude and 300 m altitude of our study population. We further assumed that only 17 % of ambient UV actually reaches a person on account of other factors such as shade from buildings and trees, etc.( Reference Diffey 33 ). Using these assumptions we estimated a hypothetical oral vitamin D exposure in IU (with upper and lower bounds) for 1 h of full-body sun exposure during the warmer months of the year 2004. We further assumed that only 10 % of the body was exposed on average( Reference Holick 30 ) on account of individual factors such as time spent standing, wearing clothing, etc. These hypothetical estimates of plausible oral vitamin D equivalents per hour of sun exposure, derived as described for our study population, are provided in Table 2.
Table 2 Hypothetical estimates of oral vitamin D exposure per hour of sun exposure for a given person in Alberta, Canada for the warmer months of 2004
MED, minimal erythemal dose; IU, international unit (to convert to μg, divide IU by 40).
*For Edmonton, Alberta, Canada(32).
†1 MED = 250 J/m2 for Fitzpatrick skin type II, representing a fair Caucasian, used for all calculations(31).
‡From reference 58.
§Assuming that a full-body exposure to 1 MED results in a rise in serum 25-hydroxyvitamin D that is analogous to an oral dose of ergocalciferol (vitamin D2) administered at 20 000 IU (lower bound: 10 000 IU, upper bound: 25 000 IU)(30) with a correction for the assumption that, on average, 17 % of all available ambient UV radiation reaches the skin (due to blockage by clouds, buildings, etc.)(33) and that 10 % of the skin is exposed on average (not 100 %)(30).
∥Weighted average is weighted by the number of days in each month included in the summary value.
¶Example calculation: 2153 J/m2 irradiation divided by 250 J/m2 = 8·6120 MED/d; 8·16120 MED/d divided by 13·9 h/d = 0·6195682 MED/h; 0·6195682 MED/h multiplied by 20 000 IU multiplied by 0·17(33) multiplied by 0·10(30) = 210·7 IU/h.
Using the per hour estimates from Table 2, we also assumed that those aged 60 years or more were 50 % less effective in vitamin D production( Reference MacLaughlin and Holick 34 ). The plausible oral vitamin D equivalent of the self-reported sun exposure from the OVAL survey for women in our study population ranged from a median of 322 (IQR 207, 404) IU/d (8·05 (IQR 5·18–10·10) μg/d) for the 60+ years group to 465 (IQR 332–584) IU/d (11·63 (IQR 8·30–14·60) μg/d) for the 50–59 years group (Table 3). The overall median of dietary and supplement intake of vitamin D in this population was 318 (IQR 176–476) IU/d (7·95 (IQR 4·40–11·90) μg/d). Vitamin D intake increased with increasing age periods, from a median of 212 (IQR 102–425) IU/d (5·30 (IQR 2·55–10·63) μg/d) in the 20–29 years group to 685 (IQR 444–890) IU/d (17·13 (IQR 11·10–22·25) μg/d) in the 60+ years group. We combined these values with the estimates from sun exposure to estimate total combined vitamin D exposure, which ranged from a median of 660 (IQR 421–883) IU/d (16·50 (IQR 10·53–22·01) μg/d) for ages 20–29 years to 1004 (IQR 864–1181) IU/d (25·03 (IQR 21·60–29·53) μg/d) in the 60+ years group. Relating these results to the ‘adequate intakes’ of vitamin D that were recognized when the study was conducted( 35 ), between 51·7 % and 83·3 % of women (depending on age group) met adequate vitamin D intakes through diet and supplements (Table 4). If we add sun exposure as IU of vitamin D, then >90 % of women, regardless of age group, would have met these historical adequate levels during the warmer months of the year. Analogous estimates were made adjusting for sunscreen use (Tables 3 and 4).
Table 3 Estimated vitamin D exposure (IU/d) from self-reported diet, supplement use and sun exposure in the OVAL survey among randomly selected women (n 90) aged 40–79 years, Calgary, Alberta, Canada, 2004
IU, international unit (to convert to μg, divide IU by 40); IQR, interquartile range.
*Derived using approach in Table 2.
†Never (no adjustment); half the time or less (25 % reduction); more than half the time (75 % reduction).
‡Reduced by 50 % to account for reduced vitamin D production in the skin at older ages(34).
Table 4 Percentage meeting recommended intakes (both historical and current) with reported sun and dietary exposures for times of the year with adequate irradiation to stimulate vitamin D production among randomly selected women (n 90) aged 40–79 years, Calgary, Alberta, Canada, 2004
IU, international unit (to convert to μg, divide IU by 40).
*From reference 35.
†Intake includes intake through both diet and supplements.
‡Based on estimates in Table 3.
§From references 45 and Reference Holick, Binkley and Bischoff-Ferrari46.
Discussion
In a randomly sampled population of Canadian women, the results of our study show that the OVAL survey reliably reproduces measurements from the gold standard Geraldton survey for both total hours and average hours per year of sun exposure for months of the year with sufficient UV radiation for vitamin D production. Thus, capturing every tenth year for the purpose of estimating lifetime sun exposure is both reliable and efficient when estimating adult sun exposure. We also collected estimates of vitamin D intake for every tenth year in the OVAL survey, and found that average dietary intake increased with age in our study population. Our success capturing this retrospective vitamin D intake demonstrates feasibility, but we were not able to assess the reliability of the dietary intake estimates as we know of no other instrument that assesses dietary and supplement intake over adult life.
The good to excellent correlations between the OVAL survey and the Geraldton survey suggest that the two instruments are capturing similar information on sun exposure. However, the true validity (against an objective gold standard) of the Geraldton survey or any other sun exposure instrument that captures many years is difficult to assess given the time, resources and expense required to measure sun exposure objectively over an entire adult life through means such as personal UV dosimetry. Self-reported short periods (1 year or less) of sun exposure have been validated using independent observers( Reference O'Riordan, Lunde and Steffen 36 ) or personal UV dosimetry( Reference McCarty 6 , Reference Humayun, Iqbal and Azam 37 ); correlations have ranged from quite low to high depending on the type of sun exposure measured and the length of time assessed. Another validation measure, solar skin damage (actinic damage), was positively associated with greater cumulative hours of sun exposure derived from questionnaires in one study (P for trend = 0·0 0 1)( Reference Karagas, Zens and Nelson 38 ) but had a low correlation (r = 0·05) in another study( Reference John, Schwartz and Dreon 39 ). Greater amounts of reported recent sun exposure also have been significantly correlated with serum 25(OH)D levels (e.g. reference 9), as have short courses of narrowband UVB exposure (e.g. reference Reference Ala-Houhala, Vahavihu and Hasan40). Given that serum 25(OH)D levels can vary with vitamin D intake, season, sun exposure and a number of other factors( 4 , Reference Hypponen and Power 41 ), it is probably not reasonable to use a single serum measure of vitamin D as a surrogate for adult lifetime sun exposure. Thus, a true validation of reported lifetime sun exposures that might influence chronic disease risk( Reference John, Koo and Schwartz 42 , Reference Yang, Veierod and Lof 43 ) continues to be a challenge.
Based on the dietary and supplement intakes only, our results suggests that between 51·7 % and 83·3 % of women (depending on age group) met adequate vitamin D intakes that were in place in Canada when the study was conducted( 35 ). Our estimated intake values are consistent with those estimated from 24 h recalls in the third National Health and Nutrition Examination Survey and the Continuing Survey of Food Intakes in the USA( Reference Moore, Murphy and Keast 44 ). Similar to our results on an individual level, these large surveys also found that total dietary and supplement intake of vitamin D increased with age on a cross-sectional level( Reference Moore, Murphy and Keast 44 ). At face value, these results seem reasonable because the recommended daily intakes of Ca and vitamin D for older individuals increase for bone health( 45 , Reference Holick, Binkley and Bischoff-Ferrari 46 ). These results suggest that vitamin D intakes are not consistent over adult life and that measurement of intake in a 1-year period (such as that in FFQ in cohort studies) may not adequately capture vitamin D intakes that may be relevant to chronic disease diagnoses many years later.
In 2010, the US Institute of Medicine released new dietary recommended intakes for vitamin D( 45 ) in a report commissioned by the US and Canadian governments( 47 ). Also in 2011, a US-directed international task force published similar recommendations for adults at risk for vitamin D deficiency( Reference Holick, Binkley and Bischoff-Ferrari 46 ). Only 12·4 % and 58·3 % of women in our study (depending on age period) would have met these new recommendations based on dietary and supplement intake. Neither the Institute of Medicine nor the task force included sun exposure in its recommendations( 45 , Reference Holick, Binkley and Bischoff-Ferrari 46 ). However, if we accept all the strong assumptions made in estimating sun exposure as IU of vitamin D, then our analysis suggests that, when sun exposure is considered with vitamin D intake, a high percentage of women in our study would have met both the historical and current recommendations (>90 % for historical and 59·6 % to 100 % for current) for the warmer months of the year. Regardless of age, about 28 % of women did not meet the new recommendations with intake and sun exposure which is consistent with an estimated 20–23 % of Canadians having serum values <50 nmol/l (50 nmol/l is roughly consistent with the RDA intake of 600–800 IU (15–20 μg)) during the summer months( Reference Whiting, Langlois and Vatanparast 48 ).
Given the strong assumptions in this analysis, any of our individual estimates of vitamin D exposure via sun exposure must be interpreted cautiously. Cholecalciferol production in the skin depends upon many factors including: exposure to wavelengths of UVB radiation between λ = 290 nm and λ = 315 nm; the amount of UVB exposure; season of the year; latitude, altitude and time of day; fraction of skin exposed to UVB; solar zenith angle, ozone column, cloud cover, ground and cloud albedo; duration of UVB exposure; amount of pre cholecalciferol available in the skin and skin type (amount of pigmentation); sunscreen application; age; BMI; disease status and medications consumed. It is not surprising, then, that other approaches to estimating UVB-derived vitamin D exposure have been described in the literature (e.g. references Reference Giovannucci, Liu and Rimm49 and Reference Fioletov, McArthur and Mathews50) that differ from our own. We did not collect information on BMI, disease status or medications for this reliability study. Nor did we describe our analyses accounting for skin pigmentation( Reference Clemens, Adams and Henderson 51 ) because the women in the study self-identified as white. However, we did account for reported sunscreen use in our estimates of oral vitamin D equivalent (Tables 3 and 4). Whether or not the adjustment for sunscreen use is valid is unknown as some evidence from the literature indicates sunscreen use does not reduce UVB exposures when self-applied( Reference Farrerons, Barnadas and Rodriguez 52 – Reference Matsuoka, Ide and Wortsman 56 ), although sunscreen applied under controlled research conditions at a sufficient thickness and sun protection factor can prevent significant increases in serum 25(OH)D from occurring( Reference Faurschou, Beyer and Schmedes 57 ). Nevertheless, our estimates do support the idea that a substantial proportion of vitamin D comes from sun exposure in the warmer months relative to that from diet and supplements, even with adjustment for sunscreen use.
In this inter-method reliability study, we found that our OVAL survey reliably estimated adult sun exposure relative to the gold standard Geraldton survey for months of the year that are relevant to vitamin D production for our study population. Thus, capturing relevant adult sun exposure every tenth year to estimate lifetime sun exposure is reasonable, reliable and efficient. We also found that diet and supplement intakes of vitamin D were relatively modest in our study population. More speculatively, we found that sun exposure may exceed the contribution of dietary intake to total vitamin D in the everyday, real-life experience of these women in the warmer months of the year. Any means to further improve our ability to capture sun exposure in an efficient and cost-effective manner, either via objective means or self-report, will assist in our efforts to elucidate the role of vitamin D in chronic disease risk.
Acknowledgements
Sources of funding: This research was supported by a grant from the Canadian Institutes of Health Research (MOP-68977). L.S.C. was supported through a Canada Research Chair and the Alberta Heritage Foundation for Medical Research until 2007. Conflicts of interest: The authors declare no conflict of interest in relation to this manuscript. Authors’ contributions: L.S.C. and H.K.N. designed the research; L.S.C. conducted the research; B.L.M., Y.D. and H.K.N. analysed the data; L.S.C., B.L.M., Y.D. and H.K.N. wrote the paper; L.S.C. had primary responsibility for final content. All authors read and approved the final manuscript. Acknowledgements: The authors thank Robert C. Lee for his helpful review of this manuscript.


