


INTRODUCTION
The emergence of resistance to antimicrobial agents is a paramount contemporary healthcare issue [Reference Conly1]. Concern about emerging antimicrobial-resistant organisms (ARO) is increasing both in health professionals and the general public. Efforts to control resistance include, but are not limited to, infection prevention and control practices, prudent use of antimicrobials, and surveillance [Reference Goossens2–Reference Critchley and Karlowsky7]. The Centers for Disease Control and Prevention (CDC) define surveillance as ‘the ongoing systematic collection, analysis, and interpretation of health data essential to the planning, implementation, and evaluation of public health practice, closely integrated with the timely dissemination of these data to those who need to know’ [Reference Thacker and Berkelman8]. There exist a large number of surveillance systems for detection of ARO worldwide that provide information on the occurrence of resistant infections in time and location, identify risk factors for their acquisition, and define their outcome [Reference Mulvey9–Reference Styers13]. Tracking these organisms and their determinants may aid policy-makers in their decisions regarding health-services funding allocation and guide research efforts into means of prevention and control. In addition, knowledge of species distribution and resistant profiles of infectious diseases is frequently touted as a means to improve appropriate antimicrobial utilization.
While it is evident that surveillance data may benefit understanding of the determinants and spread of antimicrobial-resistant infections and may aid clinicians with direct patient care decisions, the value of such information is predicated on its reliability and validity. Invalid ARO surveillance data risks wasting healthcare resources through misguided efforts and may result in patient harm through inappropriate use of antimicrobial agents. Despite the large number of surveillance systems worldwide and vast amounts of published data from resistance surveys, methodological issues surrounding ARO surveillance systems has rarely been the topic of investigation [Reference Bax14–Reference Monnet21].
The objective of this review is to identify and explore potential types and magnitude of bias that may influence the validity or interpretation of surveillance data. The published English literature was reviewed in order to identify potential biases and to assess their magnitude in surveillance systems for ARO. Bias was defined as ‘systematic errors that may occur in collecting or interpreting data’ [Reference Hennekens and Buring22]. Information sources included Medline searches through the Ovid and PubMed platforms and Google Scholar searches between 1988 and 2008, examining bibliographies of selected articles, reviews, and the authors' personal files and research databases. The review focused on surveillance for AROs. However, where data were lacking, examples from infectious diseases in general was used to support the underlying bias concepts.
Several potential biases or issues in interpretation were considered that may affect ARO surveillance systems and we categorized these into six groups as shown in Table 1. Each of these is further reviewed in the following sections.
Table 1. Potential biases in surveillance systems for antimicrobial resistance

POTENTIAL BIASES
Denominator data
How denominator data are utilized in surveillance data may have a significant influence on their interpretation, particularly surrounding the occurrence of an ARO infection. Hospital-acquired ARO infections may be used as an example to illustrate this point. By most definitions, these are infections that are not incubating or present at the time of admission, and are first identified more than 2 days after admission to hospital [Reference Garner23]. While an infection may be acquired within the first 2 days of hospital admission, it probably will not be detected by hospital surveillance in patients who have durations of admission <2 days. Should patients who are admitted for <2 days to hospital be included in the denominator for establishing nosocomial infection rates? If all admissions are used as the denominator, and a large number of patients are admitted for <2 days, then a potentially lower rate will be reported than if the denominator is restricted to those admitted for at least 2 days. In order to assess the degree of magnitude potentially associated with this we calculated the incidence of intensive-care unit (ICU)-acquired ARO bloodstream infections based on one of our previous works [Reference Laupland24]. Using a denominator that restricts the population at risk to ICU admission duration of ⩾48 h, the cumulative incidence and incidence density of ICU-acquired ARO bloodstream infection was 4·6/1000 admissions and 0·62/1000 patient-days, respectively. If all admissions are included, then these rates are substantially lower at 2·2/1000 admissions and 0·54/1000 patient-days, respectively.
A second consideration with denominator data is that if it is not utilized at all, risk may be falsely attributed. An important example of this potential bias is exemplified by the occurrence of bacteriuria in a population [Reference Laupland25]. Figure 1 shows the distribution of positive urinary-tract cultures in residents of the Calgary Health Region, Canada during 2004/2005. Based on these data as presented, one would conclude that women are at much higher risk than men, that there is a gradual increase in occurrence in men with advancing age, and that women have a decreasing occurrence through adulthood with a return to the same level in elderly women (Fig. 1). However, once these same data are expressed by inclusion of denominator data to express as population at risk, the conclusions are dramatically different (Fig. 2). Clearly the very old are at much higher risk, and the gender-related risk in this age group is no longer marked.
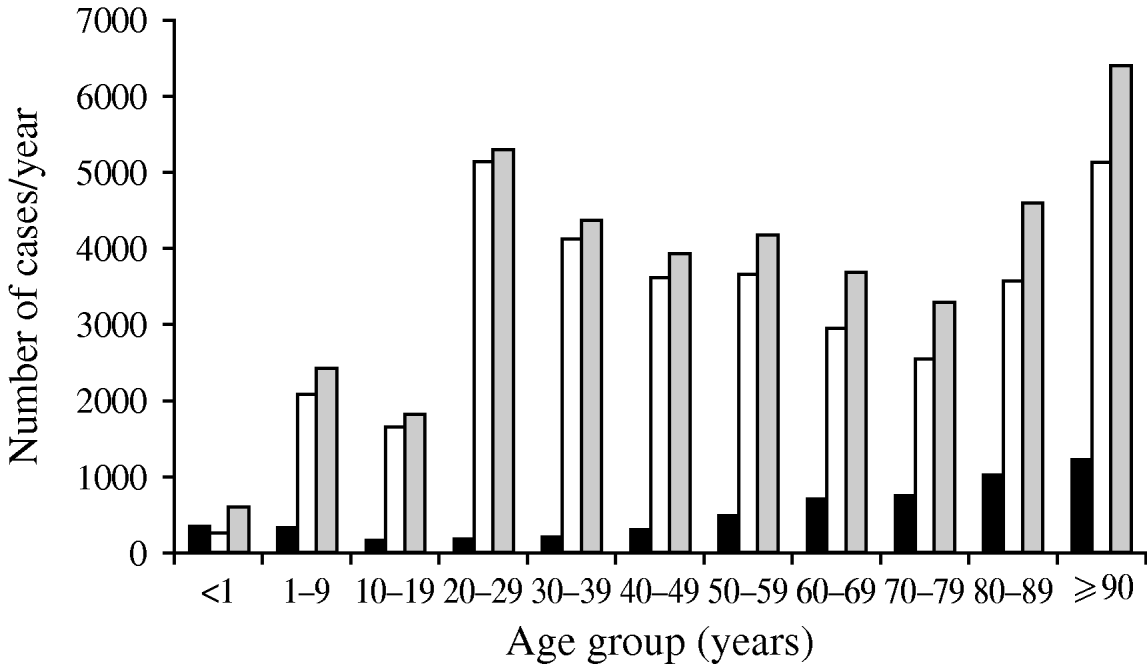
Fig. 1. Number of urinary tract infections in Calgary Health Region 2004/2005. Data are shown as number of cases. ▪, Male; □, female; ![]() , total cases. (Figure adapted from Laupland et al. [Reference Laupland25].)
, total cases. (Figure adapted from Laupland et al. [Reference Laupland25].)
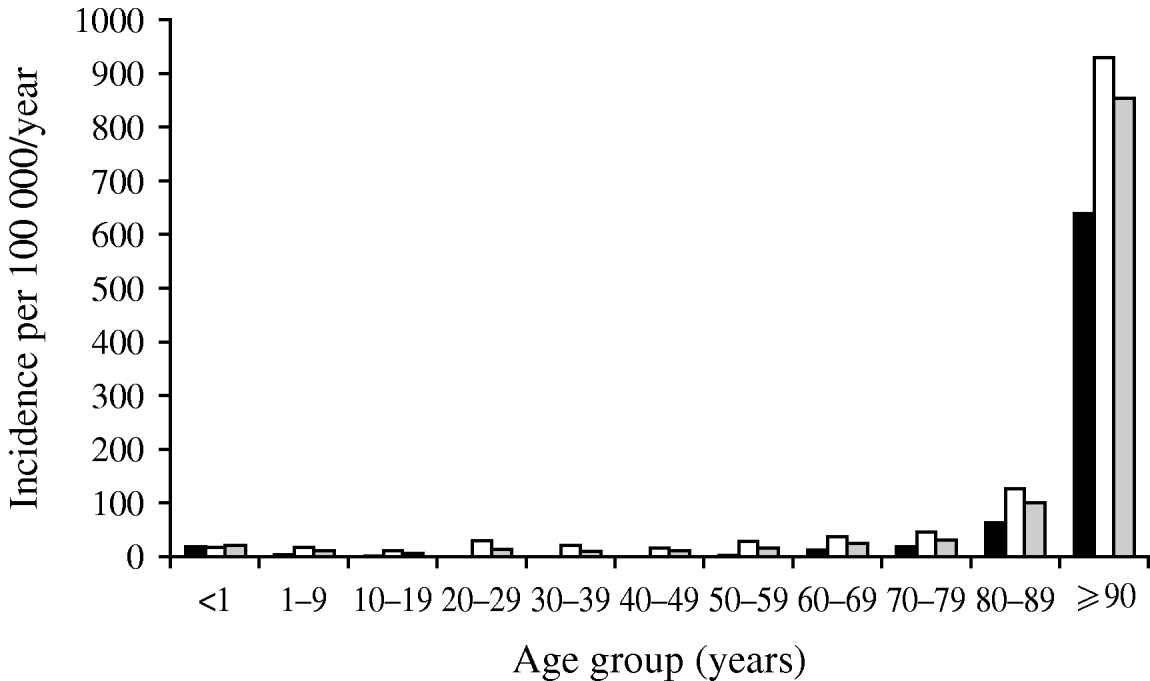
Fig. 2. Incidence of urinary tract infections in Calgary Health Region 2004/2005. Data are shown as incidence per population. ▪, Male; □, female; ![]() , total cases. (Figure adapted from Laupland et al. [Reference Laupland25].)
, total cases. (Figure adapted from Laupland et al. [Reference Laupland25].)
A third consideration is when the rate of resistant organisms is reported as a proportion of all isolates isolated. A false assessment of changes in the occurrence of resistance over time may occur when the denominator is changing due to some other factor. For example, if an antimicrobial is introduced into a setting with a particular pathogen, the result will be a decrease in the proportion of the isolation of susceptible bacteria to that antibiotic [Reference Schwaber, De-Medina and Carmeli26]. In such an instance even if the absolute number of resistant organism remains stable, the proportion (or occurrence) of resistance will be falsely assumed to be increasing [Reference Schwaber, De-Medina and Carmeli26]. Therefore, simply measuring the proportions of resistant bacteria to susceptible bacteria may result in misleading data if it is not interpreted in context.
While it is debatable as to which denominator may be preferred or ‘correct’ in these situations, the important point of consideration is that there is potential for misattribution of risk and occurrence depending on how denominator data are utilized.
Case definition
Bias may arise when a study case definition is not matched to surveillance objectives and/or reporting. Case definitions for infection may be syndromic (a constellation of clinical features) or may be definable based on a specific positive laboratory test such as a culture. This potential bias may be exemplified by urinary tract infections (UTIs). A diagnosis of a UTI involves integration of clinical symptoms (i.e. dysuria, frequency, fever, and/or pain), urinalysis results (pyuria, proteinuria, nitrates, and/or haematuria), and urine culture results [Reference Mehnert-Kay27]. While most UTIs are associated with a positive urine culture, this is not mandatory and a diagnosis may be established using a summation of other criteria. The use of an appropriate case definition is an important consideration in establishing and interpreting rates of resistance to antimicrobials in UTIs. If the surveillance objective is to identify rates of resistance in UTIs, then all episodes fulfilling a case definition would be registered, and those demonstrated to have an ARO identified. The ARO rate would then be determined by dividing the number of cases associated with an ARO by the total number of cases. There are some important potential biases that may exist in this situation. Cases caused by AROs that are culture negative would lead to an underestimate of the true ARO rate; although in theory possible, demonstrating such as bias would be practically difficult to show because AROs are usually identified by culture. More importantly, however, is the potential bias that may arise from surveillance that attempts to determine resistance rates in all UTIs by evaluating urine culture results alone [Reference McIsaac28]. This is because in all patients with UTIs, urine is more likely to be sent for culture in patients with complicated urinary tract anatomy, and prior known resistance and treatment failures who are more likely to have resistant organisms [Reference Wilson and Gaido29]. Thus the rate of ARO in patients who are cultured is not equally distributed, and culture-documented cases of UTI are likely to overestimate the true rate of antimicrobial resistance in all UTIs.
Another consideration with case definitions is that definitions may vary in surveillance studies/programmes and may lead to false interpretation of rates of resistance. For example, Folden et al. conducted a study by examining the charts of residents in a medical centre who had been diagnosed with methicillin-resistant Staphylococcus aureus (MRSA) [Reference Folden30]. The guidelines used for original diagnosis were the CDC guidelines for healthcare-associated MRSA [Reference Folden30]. The researchers reassessed the data using an alternative guideline, the healthcare-associated risk factors guidelines for MRSA, and found that community-acquired MRSA prevalence rates were 5% using the healthcare-associated risk factors criteria and 49% using the CDC guidelines over the same time period [Reference Folden30]. If the same criteria for defining organisms are not used in the various surveillance programmes there is a risk that the resulting resistance data may be not comparable.
Case ascertainment
This bias is related to either incomplete identification of all episodes that meet a case definition within the surveillance population or a failure to exclude those that do not meet that definition. Means by which this case ascertainment bias may arise include selective surveillance, active vs. passive reporting, differential rates of test ordering, and inclusion of cases that are external to the population at risk. Bias may arise when surveillance is conducted in selected subsets of the population at risk. Traditionally, hospitals have been implicated as the primary source of resistant organisms. While this holds true in many cases, it should also be recognized that most studies of resistant organisms have been conducted in hospitalized patients such that they are inherently biased towards this conclusion. Extended-spectrum β-lactamase-producing (ESBL) Escherichia coli were previously thought to be a predominantly hospital-acquired pathogen based on such hospital-based studies. However, when surveillance for ESBL E. coli was conducted in both hospitalized and community-based patients, it became readily apparent that the majority were community-onset cases, many related to international travel [Reference Pitout31].
Another important consideration in ascertainment bias is whether an active or passive approach is taken. Active surveillance investigations apply some form of systematic search or mechanism to identify cases whereas passive surveillance relies on voluntary or routine reporting systems. Passive surveillance is an important risk for bias as it notoriously leads to decreased estimates of disease [Reference Vergison32, Reference Modesitt, Hulman and Fleming33]. Vergison et al. compared a period of passive surveillance followed by active surveillance for invasive pneumococcal disease and found that the rate of identification was twice as high in an active surveillance period compared to a passive surveillance period [Reference Vergison32]. However, they did not report whether or not differences in antimicrobial susceptibilities occurred as a result. In another example, Modesitt et al. found that reporting for AIDS in a passive surveillance system was 36% lower than the number of cases found with retrospective active surveillance [Reference Modesitt, Hulman and Fleming33].
Differential test ordering occurs when differential rates of testing occur due to application of differing criteria or clinical practices. This may arise from testing protocols that may be implemented or as a result of individual clinician's practices. The most striking example of this in the performance of surveillance for asymptomatically colonized cases. For example, implementation of a routine screening policy for all admissions for MRSA will inevitably lead to a higher rate of MRSA isolation than a risk-based or ad-hoc approach. Shannon & French discovered this in a programme screening for MRSA; because the investigators do not screen for methicillin susceptibility, the results are biased towards resistance if resistance rates are compared against a centre that does not actively screen for MRSA [Reference Shannon and French34]. The magnitude of this bias as assessed by Shannon & French was found to be an increase of 6–10% in the resistance frequencies and 10–15% in the number of isolates per year, comparing active surveillance against passive surveillance [Reference Shannon and French34]. Therefore, it is important to define isolates as either clinical specimens or screening specimens and to analyse them separately in order to compare the resistance rates of hospitals that have screening programmes and hospitals that do not [Reference Shannon and French34].
The decision to submit cultures varies greatly between physicians [Reference Smellie, Clark and McNulty35]. Smellie et al. examined culturing rates in different hospitals in the UK and found 3- to 19-fold differences in the amount of testing when comparing the 10% of centres with the highest testing rates and the 10% of centres with the lowest testing rates [Reference Smellie, Clark and McNulty35]. Other studies have suggested that this may be more of a problem with non-invasive infections because a high percentage, if not all episodes, of severe invasive disease will be sent for culture; this is highly variable for surveillance cultures where the resistance rates may be dependent solely on the decision to culture [Reference McNulty36]. Finally, there is also an inherent sampling bias possible in laboratory-based surveillance systems where clinicians are more likely to submit specimens for culture in cases of treatment failure which may result in inflated rates of resistance.
Sampling bias
Hennekens & Buring describe sampling as the ability to ‘draw an inference about the experience of an entire population based on an evaluation of only a sample’ and ‘based on that estimate, we make an inference about the frequency of [disease] in the whole population’ [Reference Hennekens and Buring22]. Sampling bias arises when the sample differs in some systematic way from the larger population. One way to minimize this bias is to conduct population-based studies where all residents in the population at risk fulfilling a case definition are included. However, in many cases these designs are not practical, and sampling is needed. If random sampling is performed in an unbiased fashion then the sample should reflect the true population. However, if a sample of the cases occurring in the base population is taken without true random sampling, then there is a risk for bias to occur as a result of a failure to draw independent random samples from the population in relation to time, space, and location.
In multi-centred surveillance, bias may arise if participating centres are not randomly chosen from within all possible centres representing the population of interest. Typically large, tertiary-care, urban, referral hospitals that have higher rates of severe disease and antimicrobial resistance rates are more likely to participate (‘volunteer bias’) in these systems [Reference Laverdiere37]. This applies to multi-national studies where selected centres participate; the results from these centres may not be representative of the overall country involved if regional differences exist within countries [Reference Laverdiere37, Reference Paterson38]. One study found significant regional differences in resistance rates with Campylobacter spp. infections and this trend was especially evident with resistance to fluoroquinolones; resistance rates were 35·9% in urban areas compared to 27·1% in rural areas [Reference van Hees39]. While results might be reflective of similar locales, they do provide a biased assessment of the overall population.
While it is important to recognize that significant differences may be present between participating centres, it should also be noted that this bias may arise within participating centres. We previously conducted a study that looked at all urine culture submitted to a regional laboratory and compared the species distribution and antimicrobial susceptibility profiles within selected cohorts and then compared them with the overall dataset [Reference Laupland40]. We found that species distributions and resistance rates varied dramatically with sampling during different time periods in the time of day, date, season, and year, with facilities, and between communities [Reference Laupland40].
Many investigators have observed seasonal variations in antimicrobial resistance rates, and sampling restricted to one season may provide a biased assessment of the overall occurrence in the population [Reference Pitout31, Reference van Hees39, Reference Michel41]. Guevara et al. studied the effect of seasonality on the rate of otitis media pathogens and antimicrobial resistance in Costa Rica and found that penicillin-resistant and penicillin-intermediate strains of Streptococcus pneumoniae were more prevalent in the rainy season (39%) than in the dry season (18%) [Reference Guevara42]. Another study performed in The Netherlands found that Campylobacter spp. infections resistant to fluoroquinolones and macrolides were lower in the summer season than in the winter season [Reference van Hees39]. Pitout et al. found that there was significant seasonal variation in ESBL E. coli in Calgary, Canada [Reference Pitout31]. Data from the European Antimicrobial Resistance Surveillance System (EARSS) indicates that the prevalence of penicillin non-susceptible S. pneumoniae is higher in the summer months although in this case the difference was not found to be significant; however, they were unable to account for these seasonal differences in the rates of penicillin non-susceptible S. pneumoniae [43]. Sampling during a particular season has significant potential to lead to biased assessments of overall ARO occurrence.
Multiple counting
When a case is counted more than once for the same episode then bias may result. In ARO surveillance this largely reflects the failure to remove duplicate isolates from the same episode of disease. Numerous publications have investigated the importance of duplicate elimination in the assessment of species distribution/occurrence and resistance rates [Reference Shannon and French34, Reference Lee44–Reference Cebrian50]. The inclusion of duplicates can lead to reporting increased resistance rates as resistant organisms have a higher probability of being isolated multiple times [Reference Cornaglia20, Reference Horvat46]. Shannon & French found that inclusion of duplicates led to a modest increase in reported resistance rates of MRSA, and a much higher rate for gentamicin resistance in Klebsiella pneumoniae isolates, and furthermore, these differences varied depending on the duplicate exclusion period examined [Reference Shannon and French34]. The magnitude of this bias was supported by several other studies that found yearly resistance rates for MRSA and other organisms were significantly affected by the inclusion of duplicates [Reference Lee44–Reference Horvat46]. Both Cebrian et al. and Rodriguez et al. found that the application of time criteria for exclusion of duplicates had a significant bias in determining prevalence, but like Magee found that this did not greatly affect the determination of resistance [Reference Rodriguez48–Reference Cebrian50]. Many investigators did find that the outcome of including duplicates had quite pronounced effects in certain organisms and little or no effect in others [Reference Shannon and French34, Reference Lee44]. In addition, Li et al. found that the magnitude of duplicate removal from in-patients had a significantly greater effect than duplicate removal from outpatients [Reference Li45].
Using routine urine culture data from the Calgary Health Region, we found that using a duplicate exclusion criterion of 1 year, rates of resistance were significantly lower and the species distribution different than if duplicates were included [Reference Laupland40]. There may be a bias associated with inclusion of the same episodes of disease as multiple cultures are often sent to the laboratory. Furthermore, Shannon & French found that there was a 10% difference in resistance rates when a 5-day limit for duplicate removal was compared with a 365-day limit for duplicate removal and Rodríguez et al. found that when the time period for eliminating isolates increased, the percentage of susceptible isolates also increased [Reference Shannon and French34, Reference Rodriguez48].
Laboratory practice and procedures
Policies that direct laboratory testing protocols can introduce bias into surveillance systems. These include non-standardized testing, selective testing, rule-based reporting, and inadequate species-level identification [Reference Smellie, Clark and McNulty35, Reference Heginbothom51–Reference White53]. Laboratories often have different policies regarding which antibiotics to test isolates against and may only test certain antibiotics on an isolate if it is resistant to the first-line antibiotics [Reference Cornaglia20, Reference Heginbothom51]. Researchers found that when comparing different laboratories, the proportion of isolates tested varied from 20% to 90%, showing a marked difference in testing policies. In addition, laboratories often do not completely identify some isolates and therefore, data regarding resistance may be pooled, leading to biased data [Reference Cornaglia20, Reference Heginbothom51, Reference White53]. One study found that for urinary coliforms with pooled estimates of resistance, laboratories reported 7- to 13-fold increased rates of resistance compared to those without [Reference Heginbothom51]. When the data are grouped together and resistant organisms are not completely identified, the restricted test menus can lead to biased resistance rates.
The accuracy of laboratory results used in surveillance systems has been questioned [Reference Tenover52, Reference Hageman54]. A proficiency study testing the abilities of laboratories to identify emerging resistant organisms and reporting procedures conducted by the World Health Organization (WHO) found that only 20% of laboratories reported fully acceptable results, with most laboratories having trouble with only a few isolates [Reference Tenover52]. This is consistent with other studies that have confirmed laboratories often have difficulties isolating only a few resistant organisms [Reference Hageman54, Reference Bronzwaer55]. For example, Heginbothom and colleagues reported on around 300 000 routine community isolates from 14 laboratories in Wales and found that selective testing policies and incomplete species-level testing were associated with falsely elevated levels of resistance [Reference Heginbothom51]. In one example from this study, the rates of ciprofloxacin resistance in Haemophilus influenzae isolates were 0·2% with non-selective testing and 1·8% with selective testing [Reference Heginbothom51].
Standardization can affect the validity of surveillance data. Standardization of laboratory policies and procedures can be important in reducing the associated biases with surveillance data [Reference White53]. Some researchers argue that an international standard for antimicrobial susceptibility testing would improve the accuracy and comparability of results [Reference White53]. One study found that there was significant variation in resistance rates for resistance to ciprofloxacin and concluded that this is due to there being laboratory–laboratory variation in the definition of resistance [Reference Livermore19]. These researchers emphasized that for ciprofloxacin, small variations in definitions of resistance can have major effects of resistance rates [Reference Livermore19]. In studies, a centralized laboratory with explicit techniques, quality control, and interpretation of results is needed to minimize the risk for laboratory-related biases.
DISCUSSION AND CONCLUSION
In this paper we identified and explored six main areas of potential bias related to ARO surveillance systems. It is important to note that there are inevitably other biases or potential for errors in interpretation of surveillance data that we did not identify and discuss. These include issues surrounding maintenance of data integrity and appropriate statistical analysis. If there are errors in the statistical analysis or study design, inferences based on the data may be inaccurate [Reference Hennekens and Buring22]. Other programmatic issues that are not related to bias per se but that are important aspects of surveillance systems include reporting timeliness, cost, responsiveness, and feasibility. It is important to recognize that in many cases that we used in this report to illustrate potential biases are issues related to interpretation and generalization of results rather than necessarily methodological flaws. Our emphasis in this report is on identifying that surveillance methodology is a complex issue and that surveillance data must be interpreted in light of the methodology utilized.
There are a number of surveillance systems in use at present that demonstrate careful methodological design and minimize potential biases. A widely regarded example of a ‘gold standard’ bacterial surveillance system is the CDC Division of Bacterial and Mycotic Diseases Active Bacterial Core Surveillance ABCs programme [56]. The ABCs programme determines the incidence, epidemiological characteristics, and microbiology of invasive disease due to a number of selected bacterial pathogens in several large populations in the USA (total population about 34·2 million). Surveillance is active and all laboratories in the populations under surveillance participate such that sampling bias is minimized. Population census data from the surveillance regions are used as the denominator data. A case definition for invasive disease is used that is based on the isolation of a pathogen from a normally sterile body site. Only cases in residents of the base population are included, only first isolates are included per episode of clinical disease, and samples are referred to a central laboratory for confirmation. While multiple geographical regions of the USA are represented, to our knowledge they were not randomly selected from the overall USA population.
It is our opinion that surveillance reports should routinely identify potential limitations and issues surrounding generalization. There has been a movement towards a more standardized reporting of observational medical research such as with the STROBE statement [Reference von Elm57]. It is our contention that antimicrobial resistance surveillance reports would benefit from a standard means of reporting with areas of methodological limitations, interpretation, and generalization of results highlighted. The biases discussed in this review do have the potential to greatly affect the validity and interpretation of surveillance data. However, the extent to which these biases affect existing reports in the literature remains to be determined and is a topic for future research.
DECLARATION OF INTEREST
None.


