


It is anticipated that in 2050 the elderly population (>60 years) will overcome the population younger than 15 years of age( 1 ). Osteoporosis is major public health problem, particularly in women( Reference Briggs, Cross and Hoy 2 ). Bone mineral density (BMD) measured by dual-energy X-ray absorptiometry is considered an important determinant of osteoporotic fractures( Reference Nguyen, Pongchaiyakul and Center 3 ). In Finland, the incidence of hip fracture as a major osteoporotic fracture increased dramatically until the late 1990s; afterwards, the rise levelled off until 2010. From the late 1990s to 2010, approximately 7500 hip fractures have been reported annually in Finland( Reference Korhonen, Niemi and Parkkari 4 ).
Various factors such as physical activity, nutrient intake, dietary status, ethnicity, hormonal fluctuations, energy expenditure, BMI and genes may be related to BMD and risk of osteoporosis( Reference Curtis, Litwic and Cooper 5 ). The association of diet with bone health can be analysed focusing on single nutrients such as Ca, vitamin D or protein( Reference Dawson-Hughes and Harris 6 , Reference Isanejad, Sirola and Mursu 7 ). A more holistic view on diet quality can be derived by analysing dietary patterns in relation to bone health( Reference Pedone, Napoli and Pozzilli 8 – Reference Denova-Gutiérrez, Clark and Tucker 11 ). Dietary patterns found through a posteriori methods using factorial or principal component analyses have been identified in many studies. Fewer studies have focused on diet quality with the aid of predefined dietary patterns such as the Mediterranean diet (MD) or the Healthy Eating Index (HEI)( Reference Kontogianni, Melistas and Yannakoulia 10 , Reference Rivas, Romero and Mariscal-Arcas 12 , Reference Zagarins, Ronnenberg and Gehlbach 13 ). A dietary pattern approach is justified as the impact of a single nutritional factor is usually relatively small and hard to detect; and by studying the individual nutrients, the unknown dietary factors would be disregarded and the possible interactions of nutrients may be hard to capture. Furthermore, adjustments for other nutrients may be not feasible due to their high multicollinearity. Healthy dietary patterns have shown positive relationship with BMD in some studies( Reference Kontogianni, Melistas and Yannakoulia 10 , Reference Rivas, Romero and Mariscal-Arcas 12 , Reference Shin, Sung and Joung 14 , Reference de Franca, Camargo and Lazaretti-Castro 15 ), but not in all( Reference Zagarins, Ronnenberg and Gehlbach 13 ).
According to our knowledge, the relationship of the Baltic Sea diet (BSD) with BMD has not been reported earlier. This diet is recognized as a healthy eating pattern in Nordic countries (Norway, Sweden, Denmark, Finland and Iceland). The BSD is characterized mainly by high consumption of Nordic berries and fruit, whole grains, vegetables, fish, fat-free or low-fat dairy products, and lower consumption of processed meat and alcohol( Reference Kanerva, Kaartinen and Schwab 16 ). According to the recent studies by Kanerva et al.( Reference Kanerva, Kaartinen and Rissanen 17 – Reference Kanerva, Loo and Eriksson 19 ) and Perälä et al.( Reference Perälä, von Bonsdorff and Männistö 20 ), the BSD had significant positive effects on health status. In addition to this dietary pattern relevant to Finnish food culture, we analysed adherence to the MD as a more commonly used dietary pattern. The MD is characterized by high consumption of fish, legumes, nuts, olive oil, vegetables and fruit, lower intake of full-fat dairy products and red meat, and moderate use of alcohol. The aim of the present study was to assess the association of the BSD and MD with BMD in elderly women in a follow-up of 3 years.
Methods
Participants
The data were from the Kuopio Osteoporosis Risk Factor and Fracture Prevention Study (OSTPRE-FPS) in Kuopio, Finland, during 2003–2007. Of the 13 100 peri- and postmenopausal women born in 1932–1941, a total of 5407 were sent an invitation by mail to participate in the study. The criteria for including the participants were minimum age of 65 years at the end of November 2002, residency in Kuopio province at the beginning of the study and having not participated in earlier BMD measurements in OSTPRE. From the population, 63·5 % responded to the mailed invitation and expressed interest to participate in the intervention. These 3432 women were randomized into two equal groups; one receiving 1000 mg Ca and 25 µg (1000 IU) vitamin D daily and the other receiving no placebo. From these women, 750 were included randomly in a subpopulation in which BMD was measured. The results of the intervention have been published and as the intervention had a positive effect on total body BMD, the intervention group is included in the statistical models( Reference Kärkkäinen, Tuppurainen and Salovaara 21 ). Baseline measurements were carried out from February 2003 to May 2004, and follow-up measurements between January 2006 and May 2007. From 593 women who completed the study and their food record was attained at baseline, 544 women had BMD measurement at the femoral neck and 480 of them at the lumbar spine, the results of whom were applied in the current study.
Questionnaire
Questionnaires were posted to the participants’ homes and returned at the study visit. Alcohol consumption, smoking (current, former, never smoked), current daily or almost daily use of dietary supplements, diseases, time from menopause, use of medicines such as hormone therapy and current mobility were assessed in the questionnaires. Restricted mobility was defined based on a question about current moving ability, with the options of ‘fully mobile’, ‘able to move, but not run’, ‘not able to walk more than 1 km’, ‘not able to walk more than 100 m’, ‘able to move only indoors’ and ‘immobile’. To assess alcohol consumption, participants were asked to quantify their intake of beer and cider bottles (1 bottle equals 330 ml), wine glasses (1 glass equals 120 ml), spirits or strong alcohol portions of 40 ml during the last 4 weeks. Diseases which may have affected BMD were asked in the questionnaire including hyperthyroidism, disease of the parathyroid gland, chronic liver disease, chronic intestinal disease, coeliac disease, ventricular operation, chronic nephropathy, arthritis, osteoporosis and lactose intolerance. Furthermore, medications influencing BMD, such as loop diuretics, insulin, anti-epileptics, glucocorticoids and cancer chemotherapy, were assessed using the questionnaire.
Dietary assessment
At baseline, of those participants who had BMD measurement data, 554 women produced valid dietary intake data( Reference Järvinen, Tuppurainen and Erkkilä 22 ). The participants filled in 3 d food records at home and returned them during the research visit. The instructions for filling the forms were sent beforehand to the participants and they were asked to record their food intake for three consecutive days, two of which were weekdays and one a weekend day. In the case of ambiguity, participants were telephoned by a nutritionist. Participants were asked for the type of fat used on bread, in cooking and in baking in separate questions. Calculation of nutrient intake was done with the software Nutrica program version 2.5 (Finnish Social Insurance Institute, Turku, Finland).
Dietary scores
BSD scoring was based on an earlier study( Reference Kanerva, Kaartinen and Schwab 16 ) with slight modifications due to the different dietary assessment method( Reference Isanejad, Sirola and Mursu 23 , Reference Eloranta, Schwab and Venäläinen 24 ). The Baltic Sea Diet Pyramid and Nordic Nutrition Recommendations were the basis for the original BSD scoring( Reference Kanerva, Kaartinen and Schwab 16 ). To create a BSD score, the intakes of total fruit and berries, vegetables (potatoes excluded as a starchy vegetable), fibre from total cereal products, fish, fat-free and low-fat (<2 % fat) liquid dairy products (milk and fermented milk), sausage, ratio of PUFA to SFA, and total fat intake (percentage of energy) were categorized into quartiles. For fruit and berries, vegetables (potatoes excluded), fibre from cereal products, fish, fat-free and low-fat dairy products and PUFA:SFA, the highest points (3) were allocated to the highest quartile of consumption and 0 points to the lowest quartile; whereas for sausage and total fat the scoring was opposite, awarding highest points to the lowest quartile. Moreover, for alcohol consumption measured with the questionnaire, 1 or <1 portion/week (1 portion equals 12 g) got the highest points (1), and >1 portion/week got the lowest points (0). Quartile scores for foods and nutrients were summed up and ranged from 0 to 25, with higher scores indicating higher adherence to the BSD. The total score was categorized into quartiles.
MD score was defined based on the existing scores in the literature and particularly those studies that have applied the MD score in Nordic cohorts( Reference Tognon, Rothenberg and Eiben 25 – Reference Bamia, Lagiou and Buckland 27 ). It was based on consumption of vegetables (potatoes excluded), fruit, cereals and potatoes, fish, ratio of PUFA plus MUFA to SFA, total meat and eggs, total milk and dairy products and alcohol (derived from the questionnaire). Consumption equalling or exceeding the median consumption was scored 1 point and lower than the median 0 points for the following food groups: vegetables, fruit, cereals and potatoes, fish and PUFA+MUFA:SFA. Scoring was opposite for meat and eggs and dairy products: consumption lower than the median consumption was scored as 1 point. Alcohol consumption of 5–25 g/d was scored 1 point and consumption lower or higher than that scored 0 points. Scores were summed up and ranged from 0 to 8, with higher scores indicating higher adherence to the MD. As for BSD, the total MD score was categorized into quartiles.
Bone mineral density measurement
Measurement of BMD was performed by dual-energy X-ray absorptiometry (Lunar Prodigy instrument; GE Healthcare, Madison, WI, USA) at the lumbar spine (L2–L4), femoral neck and total body( Reference Kärkkäinen, Tuppurainen and Salovaara 21 ). Measurements were done at baseline and after 3 years by trained nurses. The quality and technical monitoring was done every day. The long-term reproducibility (CV) of the instrument for BMD during the study period, as determined by regular phantom measurements, was 0·4 %. Measurement errors were excluded from the analysis. Osteoporosis was defined based on WHO criteria as femoral neck T-score lower than or equal to −2·5 sd of a young reference population.
Anthropometric measurements
Weight and height measurements were done at baseline by use of a calibrated scale (Philips, type HF 351700) and a wall meter, respectively. BMI (kg/m2) calculation was done by dividing weight (in kilograms) by the square of height (in metres).
Statistical analysis
Analysis of the data was done using the statistical software package IBM SPSS Statistics version 21. Baseline characteristics and dietary intake among the BSD and MD score quartiles were compared by one-way ANOVA and respective non-parametric test (Kruskal–Wallis test) followed by appropriate post hoc tests (Tukey), and for categorical variables by the χ 2 test.
The associations of BSD and MD score quartiles with lumbar BMD, femoral neck BMD and total body BMD at baseline and at year 3 were analysed with the mixed model for repeated measurements. Mixed models simultaneously analyse a combination of several factors and covariates in repeated time points, and the effect of missing data is decreased and heterogeneity across individuals is taken into account( Reference Gueorguieva and Krystal 28 ). We entered BMD data from baseline and year 3, as well as dietary scores and confounding factors from baseline, in the mixed model. We analysed the data using an unadjusted model and an adjusted model including smoking, intervention group, habitual vitamin D and Ca supplementation, disease or medication reducing BMD, age, weight, height, duration of hormone therapy and energy intake as potential covariates as fixed effects. Subject effect was entered as a random effect in the models. Similarly, associations of the categories of dietary score components with BMD were analysed using adjusted mixed models.
Given that about half of the women received Ca and vitamin D supplementation, we tested the interaction terms between BSD and MD scores with vitamin D and Ca intervention. There was no significant interaction; therefore, data were pooled for the total population adjusting for the intervention. In addition, the analyses were run only in the control group.
Results
The elderly postmenopausal women had a mean age of 67·9 (sd 1·9) years and mean BMI was 28·8 (sd 4·7) kg/m2, which was in overweight range (BMI≥25·0 g/m2). At baseline 123 women (22·2 %) used hormone therapy, the mean duration of hormone therapy use was 11 years, and time from menopause was 18 years. Among the women, 26 and 23 % had taken self-care Ca and vitamin D supplements, respectively. There were more current smokers in the lowest BSD score quartile than in the other quartiles; however, MD quartiles were not associated with smoking (Table 1). The mean lumbar, femoral neck and total BMD were 1·096, 0·869 and 1·077 g/cm2, respectively. Baseline BMD values were not significantly different across BSD or MD quartiles (Table 1). Further, there were no significant associations of BSD and MD quartiles with osteoporosis.
Table 1 Baseline characteristics of participants in quartiles of Baltic Sea diet (BDS) and Mediterranean diet (MD) scores; Finnish women aged 65–71 years (n 554), Kuopio Osteoporosis Risk Factor and Fracture Prevention Study (OSTPRE-FPS), 2003–2007
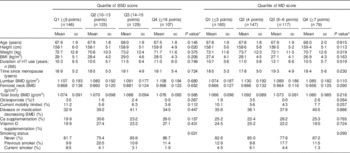
HT, hormone therapy; BMD, bone mineral density.
* One-way ANOVA for continuous variables and Pearson’s χ 2 test for categorical variables.
† T-score lower than or equal to −2·5 sd.
Table 2 describes the mean intakes of main food groups and nutrients according to the BSD and MD score quartile groups. The highest amounts of fruit and berries, vegetables, fish, fat-free and low-fat dairy products, and the lowest amount of sausage, were consumed in the highest BSD score quartile. The consumption of alcohol did not differ significantly between the BSD score quartiles. The highest BSD score was associated with the highest intakes of energy, PUFA:SFA, protein (g/d), carbohydrate (g/d, % of energy) and fibre, and with the lowest fat intake (g/d, % of energy). Participants in the highest BSD score quartile had also the greatest intakes of Ca, vitamin D and vitamin C.
Table 2 Food consumption, energy and nutrient intakes at baseline in quartiles of Baltic Sea diet (BDS) and Mediterranean diet (MD) scores; Finnish women aged 65–71 years (n 554), Kuopio Osteoporosis Risk Factor and Fracture Prevention Study (OSTPRE-FPS), 2003–2007
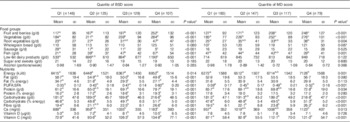
a,b,c,dMean values within a row with unlike superscript letters were significantly different (P < 0·05).
* One-way ANOVA with Tukey’s test for nutrients and Kruskal–Wallis with post hoc test for food groups, alcohol and PUFA:SFA.
Higher MD scores were associated with higher consumption of fruit and berries as well as vegetables (Table 2). On the contrary, fish intake was higher in the lowest MD category as compared with the highest category. Energy intake was higher in the highest quartile than in the lowest and second quartiles. Carbohydrate and fibre intakes as well as PUFA:SFA were higher in the higher MD quartiles.
Quartiles of BSD and MD scores were not associated with femoral neck, lumbar or total body BMD in unadjusted or adjusted models (Table 3). Neither were there significant associations in the control group only (data not shown). In addition to quartiles, we carried out the statistical analysis using BSD and MD scores in tertile categories, and the results showed no significant differences in total, femoral and lumbar BMD in the BSD or MD tertiles (data not shown).
Table 3 Bone mineral density (BMD) in quartiles of Baltic Sea diet (BDS) and Mediterranean diet (MD) scores; Finnish women aged 65–71 years (n 554), Kuopio Osteoporosis Risk Factor and Fracture Prevention Study (OSTPRE-FPS), 2003–2007
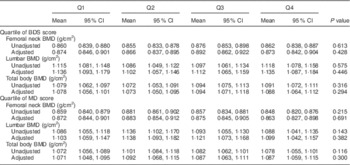
Covariates included in the adjusted mixed model include smoking, intervention group, vitamin D and Ca supplementation, disease or medication reducing BMD, age, height, weight, duration of hormone therapy and energy intake.
Most of the adjusted associations of BSD and MD score components with BMD were not significant, with the exceptions of fat quality as well as alcohol and fruit consumption. Higher MUFA+PUFA:SFA ratio was significantly associated with lumbar BMD (1·090 (95 % CI 1·045, 1·135) and 1·131 (95 % CI 1·098, 1·165) g/cm2 in categories of lower and greater than or equal to the median ratio, respectively, P=0·035) and femur BMD (0·856 (95 % CI 0·827, 0·885) and 0·860 (95 % CI 0·826, 0·894) g/cm2 in categories of lower and greater than or equal to the median ratio, respectively, P=0·037). Alcohol consumption exceeding 1 portion/week was associated with higher BMD at lumbar (1·167 (95 % CI 1·128, 1·207) and 1·088 (95 % CI 1·054, 1·123) g/cm2, respectively, P < 0·001), femoral neck (0·894 (95 % CI 0·867, 0·920) and 0·861 (95 % CI 0·839, 0·884) g/cm2, respectively, P=0·013) and total body (1·097 (95 % CI 1·076, 1·117) and 1·063 (95 % CI 1·044, 1·081) g/cm2, respectively, P=0·001) sites compared with lower consumption. Fruit consumption quartile from the BSD score was associated with total body BMD (quartile 1: 1·069 (95 % CI 1·048, 1·091) g/cm2; quartile 2: 1·095 (95 % CI 1·073, 1·118) g/cm2; quartile 3: 1·065 (95 % CI 1·043, 1·086) g/cm2; quartile 4: 1·082 (95 % CI 1·060, 1·104) g/cm2; P=0·046).
Discussion
The present study assessed the relationship of two dietary patterns, BSD and MD, with BMD in elderly women. Neither dietary pattern was significantly associated with BMD. The dietary patterns did, however, capture overall healthy characteristics of dietary intake.
BSD has earlier been associated with other health outcomes but associations with bone health have not been reported. Higher adherence to the BSD was associated with lower risk of abdominal obesity and lower C-reactive protein as a marker for inflammation( Reference Kanerva, Kaartinen and Rissanen 17 , Reference Kanerva, Loo and Eriksson 19 ) and furthermore with better physical function( Reference Perälä, von Bonsdorff and Männistö 20 ). On the contrary, the BSD was not related to type 2 diabetes risk( Reference Kanerva, Rissanen and Knekt 29 ) and was related to decreased HDL cholesterol( Reference Kanerva, Kaartinen and Rissanen 17 ).
Regarding the MD and BMD, the results have been controversial( Reference Romero Perez and Rivas Velasco 30 ). Adherence to the MD was not associated with BMD in a cross-sectional setting in 220 Greek adult women( Reference Kontogianni, Melistas and Yannakoulia 10 ) or in 1180 Portuguese adolescents( Reference Monjardino, Lucas and Ramos 31 ); on the contrary, a significant association was reported in 200 Spanish women( Reference Rivas, Romero and Mariscal-Arcas 12 ). MD supplemented with nuts or virgin olive oil did not affect BMD in a 1-year intervention( Reference Bullo, Amigo-Correig and Marquez-Sandoval 32 ), which might have been too short a time to observe an effect. Even though MD adherence as such has yielded mixed results in relation to BMD, components of the MD like fruit, vegetables, fish, olive oil and low red meat consumption have been associated with BMD( Reference Kontogianni, Melistas and Yannakoulia 10 , Reference Rivas, Romero and Mariscal-Arcas 12 ). We did not observe such associations, except a weak association for fruit intake. Inconsistent results could result from differences in study populations, small subject numbers and it is of note that most of the earlier studies were cross-sectional.
Use of predefined dietary patterns allows easy comparison of results with dietary recommendations and other studies, as well as interpretation to practical dietary recommendations. In addition to the BSD and MD, there are other predefined dietary patterns that have been studied in relation to bone health. Better-quality diet as indicated by higher Alternative Healthy Eating Index (AHEI) was associated with lower risk of hip fracture in Singapore Chinese aged 45–74 years( Reference Dai, Butler and van Dam 33 ). However, AHEI was not associated with peak bone mass in women aged 18–30 years( Reference Zagarins, Ronnenberg and Gehlbach 13 ), nor was HEI-2005 associated with bone turnover markers in women aged >45 years( Reference Hamidi, Tarasuk and Corey 34 ). The Dietary Approaches to Stop Hypertension (DASH) diet was not related to BMD in adolescents( Reference Monjardino, Lucas and Ramos 31 ), even though that it is characterized by high intakes of fruit and vegetables and low-fat dairy products. A simpler Oslo Health Study dietary index based on the ratio of consumption of soft drinks to that of fruit, berries, fruit juices and vegetables was negatively associated with BMD in adults( Reference Høstmark, Søgaard and Alvær 35 ), but not in adolescents( Reference Monjardino, Lucas and Ramos 31 ).
The predefined dietary patterns have thus shown inconsistent associations with BMD and there were no significant associations in our study. Even so, we would argue that the BSD and MD were able to capture healthy dietary characteristics. Better adherence to the BSD was associated with higher fruit and berries, vegetable, fish and low-fat dairy product consumption and better adherence to the MD was associated with higher fruit and berries and vegetable consumption. Both higher BSD and MD scores were associated with better dietary fat quality as shown by PUFA:SFA. The range of BSD score in our study was comparable to that reported earlier in three Finnish data sets( Reference Kanerva, Kaartinen and Rissanen 17 ), which would indicate that the variability in the score was reliable. Even though the BSD classifies individuals according to overall dietary quality and it relates to other health outcomes, it may not capture adequately the dietary factors that are most relevant for bone health.
Of the components of BSD and MD scores, only MUFA+PUFA:SFA and alcohol and fruit consumption were associated with BMD. This is in line with our earlier results showing that PUFA intake was positively associated with BMD at the lumbar spine and total body( Reference Järvinen, Tuppurainen and Erkkilä 22 ) and that low to moderate alcohol intake was positively associated with BMD at the lumber spine and femoral neck( Reference Sommer, Erkkilä and Järvinen 36 ). It has been suggested that light to moderate alcohol intake may decelerate the rate of bone remodelling in older individuals( Reference Gaddini, Turner and Grant 37 ). Fruit and vegetables have been associated with better bone health at multiple measurement sites( Reference Shin, Sung and Joung 14 , Reference Hardcastle, Aucott and Fraser 38 , Reference Karamati, Yousefian-Sanni and Shariati-Bafghi 39 ). Other components of the scores were not associated with BMD in the current data, which contrasts with several earlier studies. Dairy products have been found to be beneficial( Reference Mangano, Sahni and Kiel 9 , Reference Denova-Gutiérrez, Clark and Tucker 11 , Reference Shin, Sung and Joung 14 ). Greater amount of oily fish consumption has been indicated to have a positive influence on BMD( Reference Kontogianni, Melistas and Yannakoulia 10 , Reference Denova-Gutiérrez, Clark and Tucker 11 , Reference Zalloua, Hsu and Terwedow 40 ); whereas greater intake of protein from red meat and processed food had a negative relationship with BMD( Reference Mangano, Sahni and Kiel 9 , Reference Denova-Gutiérrez, Clark and Tucker 11 , Reference Shin, Sung and Joung 14 ). The results on associations of diet with different bone sites (trabecular or cortical) have been mixed( Reference Pedone, Napoli and Pozzilli 8 , Reference Corwin, Hartman and Maczuga 41 ).
Our study has strengths and limitations. BMD was measured with dual-energy X-ray absorptiometry, which is a reliable determinant for bone health; and low BMD is strongly associated with osteoporotic fractures( Reference Kanis, McCloskey and Johansson 42 ). The duration of 3 years was selected for the original intervention and is regarded as long enough( Reference Weaver, Gordon and Janz 43 ), and it is also quite comparable to the cohort studies with 1–6 years of follow-up( Reference Pedone, Napoli and Pozzilli 8 , Reference Bullo, Amigo-Correig and Marquez-Sandoval 32 , Reference Shams-White, Chung and Du 44 ). BMD in the present OSTPRE-FPS did not differ from the whole OSTPRE study( Reference Kärkkäinen, Tuppurainen and Salovaara 21 ), which is a population-based sample. Population-based design with random selection of the sub-sample is a strength of the present study, even though it was weakened by a response rate of 63·5 %. For dietary assessment, we used the data from 3 d food records, which are regarded as the gold standard or reference method for dietary assessment and are used to validate other nutritional assessment methods( Reference Tucker 45 ). The 3 d food records, however, have limitations in assessment of habitual long-term diet and they do not capture infrequently consumed foods such as fish, which is typically consumed on 1–2 d/week. We did not have information on possible changes in food consumption during the 3-year period due to one baseline assessment. However, all dietary assessment tools include bias sources, and it is suggested that food records could be more accurate than FFQ in assessing absolute intakes when compared with biomarkers even though that is not directly applicable to long-term dietary intake which is relevant in relation to changes in bone health( Reference Freedman, Potischman and Kipnis 46 , Reference Prentice, Mossavar-Rahmani and Huang 47 ). In addition, since the dietary assessment was conducted using self-reported data and accordingly relied on participants’ accuracy, reporting errors are possible. The non-significant results may be related to the number of participants that limited the power of the analyses. Similarly, due to small number of Finnish elderly women, caution should be taken in generalization of the results to other elderly populations. Although we adjusted for several recognized confounding factors( Reference Curtis, Litwic and Cooper 5 , Reference Kanis, McCloskey and Johansson 42 ), we cannot exclude the possibility that the results were affected by factors that we were not able to control. Regarding BMD, the interactions of food consumption, body composition and energy intake and their changes can be difficult to control( Reference Isanejad, Sirola and Mursu 7 , Reference Langsetmo, Poliquin and Hanley 48 ).
Conclusion
Neither of the dietary scores, the BSD or MD, was significantly associated with BMD in elderly women. The results suggest that these dietary patterns may not adequately reflect dietary factors relevant to bone health.
Acknowledgements
Financial support: The OSTPRE-FPS was supported by the North Savo Regional Fund of the Finnish Cultural Foundation (Hulda Tossavainen Foundation), Sigrid Juselius Foundation, Academy of Finland and Kuopio University Hospital EVO grant. Funders had no role in the design, analysis or writing of this article. Conflict of interest: None. Authorship: The original study was planned by M.T. and H.K. This research question was planned by A.T.E. and H.S. The statistical analyses were carried out by A.T.E., H.S. and M.I. The first draft was written by H.S. and A.T.E., and all the authors contributed to critically revising it. Ethics of human subject participation: The study was approved in October 2001 by the ethical committee of Kuopio University Hospital, and the subjects were involved voluntarily. Written informed consent was obtained from all subjects. The study was registered in Clinical trials.gov by the identification NCT00592917.


