


1 Introduction
Commonly used duration models such as the Cox, exponential, Weibull, and Gompertz models assume proportional hazards (PH),Footnote 1 meaning that the relative effect of each covariate remains constant over time. When this assumption does not hold, estimating PH models produces biased parameter estimates and decreases the power of significance tests for all parameters (Box-Steffensmeier and Zorn Reference Box-Steffensmeier and Zorn2001). A variety of tests has been developed to allow researchers to evaluate the PH assumption and determine whether a correction is warranted. Correcting for nonproportional hazards (NPH) typically involves allowing the effect of a variable to change over the course of an ongoing duration spell through the inclusion of an interaction between the offending covariate and some function of time.
These issues are well known in political science and much headway has been made in the diagnosis, correction, and interpretation of NPH over the last two decades (Therneau and Grambsch Reference Therneau and Grambsch2000; Box-Steffensmeier and Zorn Reference Box-Steffensmeier and Zorn2001; Box-Steffensmeier, Reiter, and Zorn Reference Box-Steffensmeier, Reiter and Zorn2003; Box-Steffensmeier and Jones Reference Box-Steffensmeier and Jones2004; Keele Reference Keele2010; Licht Reference Licht2011; Park and Hendry Reference Park and Hendry2015). Despite this progress, however, our review of the literature indicates that the primary correction for NPH often gets implemented incorrectly even when diagnosed properly. Specifically, researchers working with time-invariant covariates (TICs) often fail to recognize that interacting a variable with a function of time requires a shift in the data structure and estimation to account for the presence of time-varying covariates (TVCs) to avoid bias from misspecification. Even among studies that originally have TVCs scholars often fail to adjust the underlying time intervals to correctly reflect the scale of the analysis time, which dictates the values of the time variable used for the correction for NPH.
We evaluate the implementation of corrections for NPH in forty-three political science studies. Of the twenty-one studies that implement a correction, twelve had the opportunity to implement the correction incorrectly. Of these twelve studies, at least seven implemented it incorrectly. At a minimum then, at least sixty percent of studies likely reported inaccurate results. We reestimate these models with the appropriate time-varying setup and find broad differences in the estimates and the resulting statistical and substantive conclusions. Before discussing these results, we provide a brief review of the PH assumption, ways to test it, and how to correct for NPH.
2 The Proportional Hazards Assumption
The Cox, exponential, Weibull, and Gompertz models all imply PH, but discussion largely focuses on the semiparametric Cox model.Footnote
2
Consider $h_{0}(t)$
, which captures the (nonparametric) common baseline hazard across observations:
$h_{0}(t)$
, which captures the (nonparametric) common baseline hazard across observations:
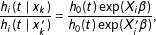
 $$\begin{eqnarray}\displaystyle h_{i}(t\mid X_{i})=h_{0}(t)\exp (X_{i}\unicode[STIX]{x1D6FD}), & & \displaystyle\end{eqnarray}$$
where $\exp (X_{i}\unicode[STIX]{x1D6FD})$
captures how covariates produce deviations from this baseline;
$\exp (X_{i}\unicode[STIX]{x1D6FD})$
captures how covariates produce deviations from this baseline; $i$
denotes observations
$i$
denotes observations $i=1,\ldots ,n$
;
$i=1,\ldots ,n$
; $t$
points in time;
$t$
points in time; $\unicode[STIX]{x1D6FD}$
the vector of coefficients, and
$\unicode[STIX]{x1D6FD}$
the vector of coefficients, and $X_{i}$
the vector of covariates of length
$X_{i}$
the vector of covariates of length $K$
. Considering the ratio of the hazard function at different values of a covariate,
$K$
. Considering the ratio of the hazard function at different values of a covariate, $x_{k}$
and
$x_{k}$
and $x_{k}^{\prime }$
, shows that the relative effect does not change with
$x_{k}^{\prime }$
, shows that the relative effect does not change with $t$
:
$t$
:
 $$\begin{eqnarray}\displaystyle \frac{h_{i}(t\mid x_{k})}{h_{i}(t\mid x_{k}^{\prime })} & = & \displaystyle \frac{h_{0}(t)\exp (X_{i}\unicode[STIX]{x1D6FD})}{h_{0}(t)\exp (X_{i}^{\prime }\unicode[STIX]{x1D6FD})},\end{eqnarray}$$
 $$\begin{eqnarray}\displaystyle & = & \displaystyle \exp (\unicode[STIX]{x1D6FD}(x_{k}-x_{k}^{\prime })).\end{eqnarray}$$
The PH assumption has both substantive as well as statistical relevance since substantive theories often imply nonproportionality. Vermunt (Reference Vermunt1997, p. 101) states that the PH assumption is unrealistic in most applications. Singer and Willett (Reference Singer and Willett1993, p. 186) also warns that “violations of the proportionality assumption are the rule, rather than the exception.” A common example comes from biomedical research in which treatment effects for certain therapies decrease over time as subjects develop resistance. Take Collett’s (Reference Collett1994) illustration of how the effect of an independent variable may change sign over time in cancer treatments. The initial risk of choosing surgery is higher than choosing drug therapy, but the long-run prognosis of patients undergoing surgery is better; thus the surgery treatment increases the hazard initially but decreases it in the long run.
In political science, violations of the PH assumption occur frequently. Licht (Reference Licht2011, p. 228) writes that “essentially, the nature of the political processes of learning, institutionalization, strategic developments, and information transmission which interest us as a discipline are likely to produce frequent violations of the proportional hazards assumption.” One example of institutionalization would be that the effects of the size of alliances on the duration of alliances decrease over time, as illustrated in Box-Steffensmeier and Zorn (Reference Box-Steffensmeier and Zorn2001). Larger alliances last longer because they are more vague in purpose and they demand less from their members (Bennett Reference Bennett1997). However, when alliances have survived for long periods of time, they tend to be self-perpetuating (Zorn Reference Zorn2000).
Scholars should therefore test for violations of the PH assumption (Box-Steffensmeier and Jones Reference Box-Steffensmeier and Jones2004, p. 132), since misspecified models result in biased parameter estimates and decreased power for statistical tests for all parameters. Schemper (Reference Schemper1992, p. 455) notes that this misspecification affects the standard errors for incorrectly specified covariates whose effect actually changes over time due to the incorrect weighting of information at failure times, which in turn spills over to reduce testing power for correctly specified covariates whose effect does not change over time.
Therneau and Grambsch (Reference Therneau and Grambsch2000, pp. 132–133) and also Box-Steffensmeier and Zorn (Reference Box-Steffensmeier and Zorn2001, p. 975) mainly recommend three methods to test for nonproportionality in a Cox model: Piecewise regression, Schoenfeld residuals, and explicitly including interactions of covariates and time. Subsequent studies have furthered our understanding of these tests. For example, Keele (Reference Keele2010) warns that tests for PH, including those using the Schoenfeld residuals, can provide false positives due to other model specification issues such as omitted variables, interactions, and nonlinear functional forms.
Much less attention has been paid to testing for PH in parametric models, but the same issues arise. The options for evaluating the PH assumption are more limited but similar. Again, one can divide up the time scale and fit separate Weibull models to the observations that fail in each period (Collett Reference Collett1994; Box-Steffensmeier and Zorn Reference Box-Steffensmeier and Zorn2001). A drawback of this piecewise regression approach is the choice of how to divide the time scale can have a significant impact on the results. Zuehlke (Reference Zuehlke2013) suggests modeling the shape parameter as a function of covariates and performing a likelihood ratio test of the null hypothesis that $p$
is constant.
$p$
is constant.
3 Correcting for Nonproportional Hazards
Therneau and Grambsch (Reference Therneau and Grambsch2000, pp. 145–147) introduce four strategies to correct for NPH. Box-Steffensmeier and colleagues recommended including an interaction between the offending covariate(s) and some function of time, most commonly the natural log of time (Box-Steffensmeier and Jones Reference Box-Steffensmeier and Jones2004, p. 136). More recent work in political science examining options for the best function of time concludes that untransformed time and the natural log of time are not as desirable as the rank or left-continuous Kaplan–Meier transformations of time (Park and Hendry Reference Park and Hendry2015). Whatever form of time one uses, one must then account for the interactive effect to conduct statistical tests and perform substantive evaluation of the effect of variable of interest since its effect changes over time. These can both be accomplished using visualization as recommended by Licht (Reference Licht2011).
Not only does including the interaction terms change the interpretations of the substantive effects, but it also changes the specification and setup of the models. The inclusion of time as a covariate requires data arranged for TVCs, which can necessitate a change in the data structure if the original data only contains TICs. Further, when the original model already has TVCs, researchers need to check whether the data configuration matches the scale of duration time used to create the interaction. For example, if the outcome variable captures days until failure and the initial set of covariates varies on an annual basis, then the data need to be converted from annual to daily observations so that the interaction with time can change on the same scale as the outcome. Failing to do so introduces misspecification into the models. Intuitively, retaining the TIC setup leads the researcher to include the dependent variable on the right hand side in the correction terms for covariates that exhibit NPH. Moving to TVCs changes this to include the value of the covariate interacted with the value of time at every point at which the observation might fail rather than just with the observed failure time. While the early literature made this clear — Collett (Reference Collett1994, p. 194) warns that models including such interactions “can not be fitted by treating [the interaction] in the same manner as time-invariant covariates in the model” and Therneau and Grambsch (Reference Therneau and Grambsch2000, p. 147) mentions the interaction “would usually vary continuously in time, which presents a computational challenge” — researchers commonly fail to make this adjustment, often with dramatic consequences for their analysis (as we show shortly).
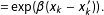
Table 1. Illustration of how to reconfigure data to correct for NPH.
Notes: Running Stata’s st split command to reconfigure the data is one way to correct for NPH. The other way is to use the tvc option for the Cox estimator in Stata. Above this, we show the Stata code to properly reconfigure the data.Footnote 3
Fortunately, the solution is easy to implement. Researchers merely need to ensure that they set up their data for TVCs with the scale of the dependent variable matching the time interval between subsequent observations in the data for each spell. Thus, if the dependent variable marks days, then the data should reflect daily observations for each spell. For the Cox model, of course, one only needs to split spells at all observed failure times since it ignores information from times without failures. The time variable used to correct for NPH can then be created and the interaction generated after reorganizing the data. Table 1 shows an example of improper and proper data configurations. The original data structure in the top panel only has TICs. The variable $X_{1}$
violates the PH assumption. The incorrect modification to adjust for NPH, shown in the middle panel, involves a single command interacting
$X_{1}$
violates the PH assumption. The incorrect modification to adjust for NPH, shown in the middle panel, involves a single command interacting $X_{1}$
with
$X_{1}$
with $\ln (t)$
. By not reconfiguring the data for TVCs this treats the interaction term as a TIC even though time clearly varies over time. In contrast, the bottom panel shows the data reconfigured for TVCs with the interaction generated afterward. Because we estimate a Cox model, we only need observations at observed failure times; were this a parametric model, we would need them at all points of the underlying time scale. Analysis, testing, and interpretation can then proceed as usual with TVCs. In the context of the parametric Weibull estimator, Yamaguchi (Reference Yamaguchi1991) and Box-Steffensmeier and Zorn (Reference Box-Steffensmeier and Zorn2001) suggest the same approach of including interaction terms to correct for nonproportionality (though see Zuehlke (Reference Zuehlke2013)), meaning that one must again make sure the data vary at the same level of time as the outcome variable.
$\ln (t)$
. By not reconfiguring the data for TVCs this treats the interaction term as a TIC even though time clearly varies over time. In contrast, the bottom panel shows the data reconfigured for TVCs with the interaction generated afterward. Because we estimate a Cox model, we only need observations at observed failure times; were this a parametric model, we would need them at all points of the underlying time scale. Analysis, testing, and interpretation can then proceed as usual with TVCs. In the context of the parametric Weibull estimator, Yamaguchi (Reference Yamaguchi1991) and Box-Steffensmeier and Zorn (Reference Box-Steffensmeier and Zorn2001) suggest the same approach of including interaction terms to correct for nonproportionality (though see Zuehlke (Reference Zuehlke2013)), meaning that one must again make sure the data vary at the same level of time as the outcome variable.
4 Replications
To evaluate the extent and consequences of incorrect specification of corrections for NPH in political science we attempted to identify as many relevant studies as possible. We started with Park and Hendry’s (Reference Park and Hendry2015) collection of data from all articles using PH models and published between 1992 and 2012 in the American Journal of Political Science, American Political Science Review, and The Journal of Politics.Footnote 4 In addition to the twenty-nine articles from their database, we identified another fourteen studies between 2001 and 2010 that supplied replication data in journals such as International Studies Quarterly, Legislative Studies Quarterly, and Journal of Peace Research.Footnote 5 We examined these articles to see if they: (1) included a test for the PH assumption; (2) implemented a correction if needed; and (3) configured their data correctly in the adjusted analysis. We further categorized the ones that did not appropriately reconfigure their data into those that did not have TVCs before the correction and those that did but on a different scale from the outcome variable.Footnote 6 Here we report the results of this accounting and provide representative examples to illustrate the possible consequences of incorrectly implementing the NPH correction.Footnote 7 For those interested in seeing the consequences with a known data generating process, our supplemental appendix presents the results of a Monte Carlo analysis that also illustrates the bias from misspecifying the correction.
Table A1 in our supplemental appendix reports the results for these forty-three studies. Thirty-one of them reported testing for NPH and of those thirty-one, twenty-one implemented a correction. Twelve studies had the potential for incorrect implementation. Seven of the ten for which we could obtain replication dataFootnote 8 failed to appropriately reconfigure the data, including three of four that started without TVCs and four of six that had TVCs that were not on the same scale as the outcome variable.
To determine the consequences of implementing the NPH correction without the proper TVC setup, we redid the analysis for all seven studies using the authors’ posted data. We reestimated all of the reported results and then reanalyzed the data after appropriate restructuring. We report the full results in our supplemental appendix.Footnote 9 Table 2 summarizes the differences for the offending variables. Change in slope indicates the coefficient of the interaction term flips sign. Change in sign means the sign of the combined effect changes. When the coverage of the zero line of the 95% confidence interval changes, a change in significance happens. Change in magnitude records an observable difference in the magnitude of the effect. Alternatively, the substantive conclusion remains the same means that we detected no important change in the statistical and substantive conclusions. We intend this as a rough accounting of the general differences between the features of the results to give a sense of what we found given the subjective nature of many of these conclusions, e.g., does the range of significant effects over time change enough to call the difference meaningful? As the table shows, over half the variables exhibit some change that implies a different substantive or statistical conclusion. Nearly half of the effects show a change in sign or slope over time and nearly as many show important differences in magnitude or significance.
Table 2. Summary of replication and reanalysis results.
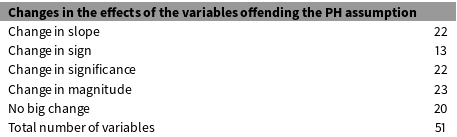
Notes: The categories are not mutually exclusive. The categorization is based on authors’ judgments. See text for more details.
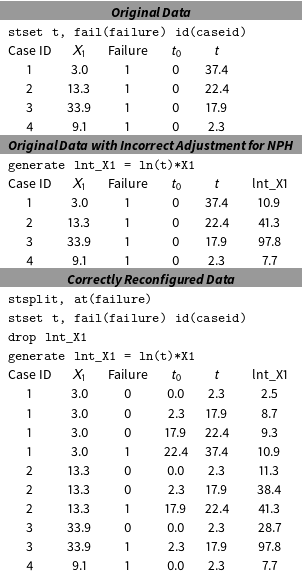
While the complete set of plots appears in our supplemental appendix, we illustrate some of the more dramatic differences here. Figure 1 comes from Chiozza and Goemans’s (Reference Chiozza and Goemans2004) examination of how regime type, conflict and its outcomes affect the tenure of political leaders. In the base models, they include TVCs measured annually, whereas failure time is measured in days. The original results indicate that “…leaders of presidential democracies face significantly higher risks of losing office than leaders who rule over autocratic regimes. …but the higher hazards of losing office tend to dissipate over time.” However, we find the exact opposite results: As shown in Figure 1, at the very beginning, if the leaders of presidential democracies face lower hazards of losing office than autocratic leaders, then the hazards become higher and higher over time.
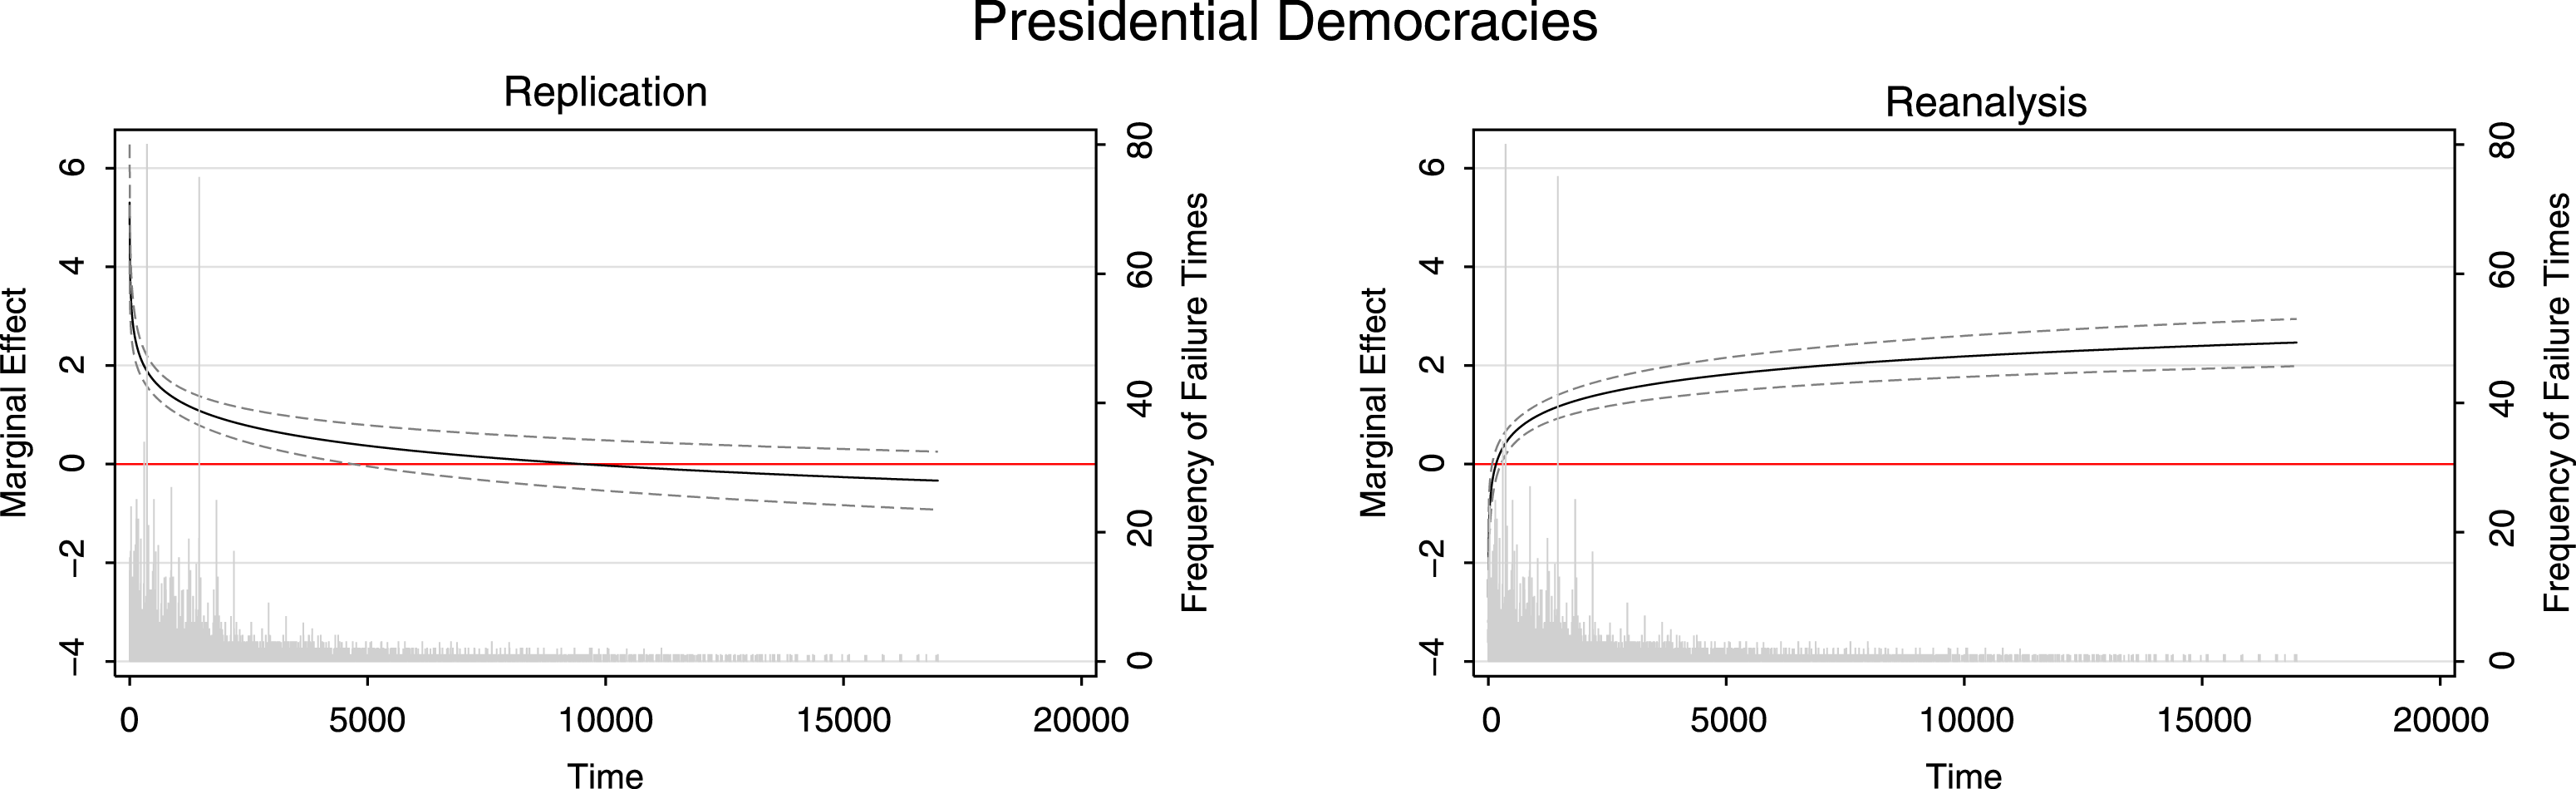
Figure 1. Tenure of political leaders (CG Reference Chiozza and Goemans2004 ).
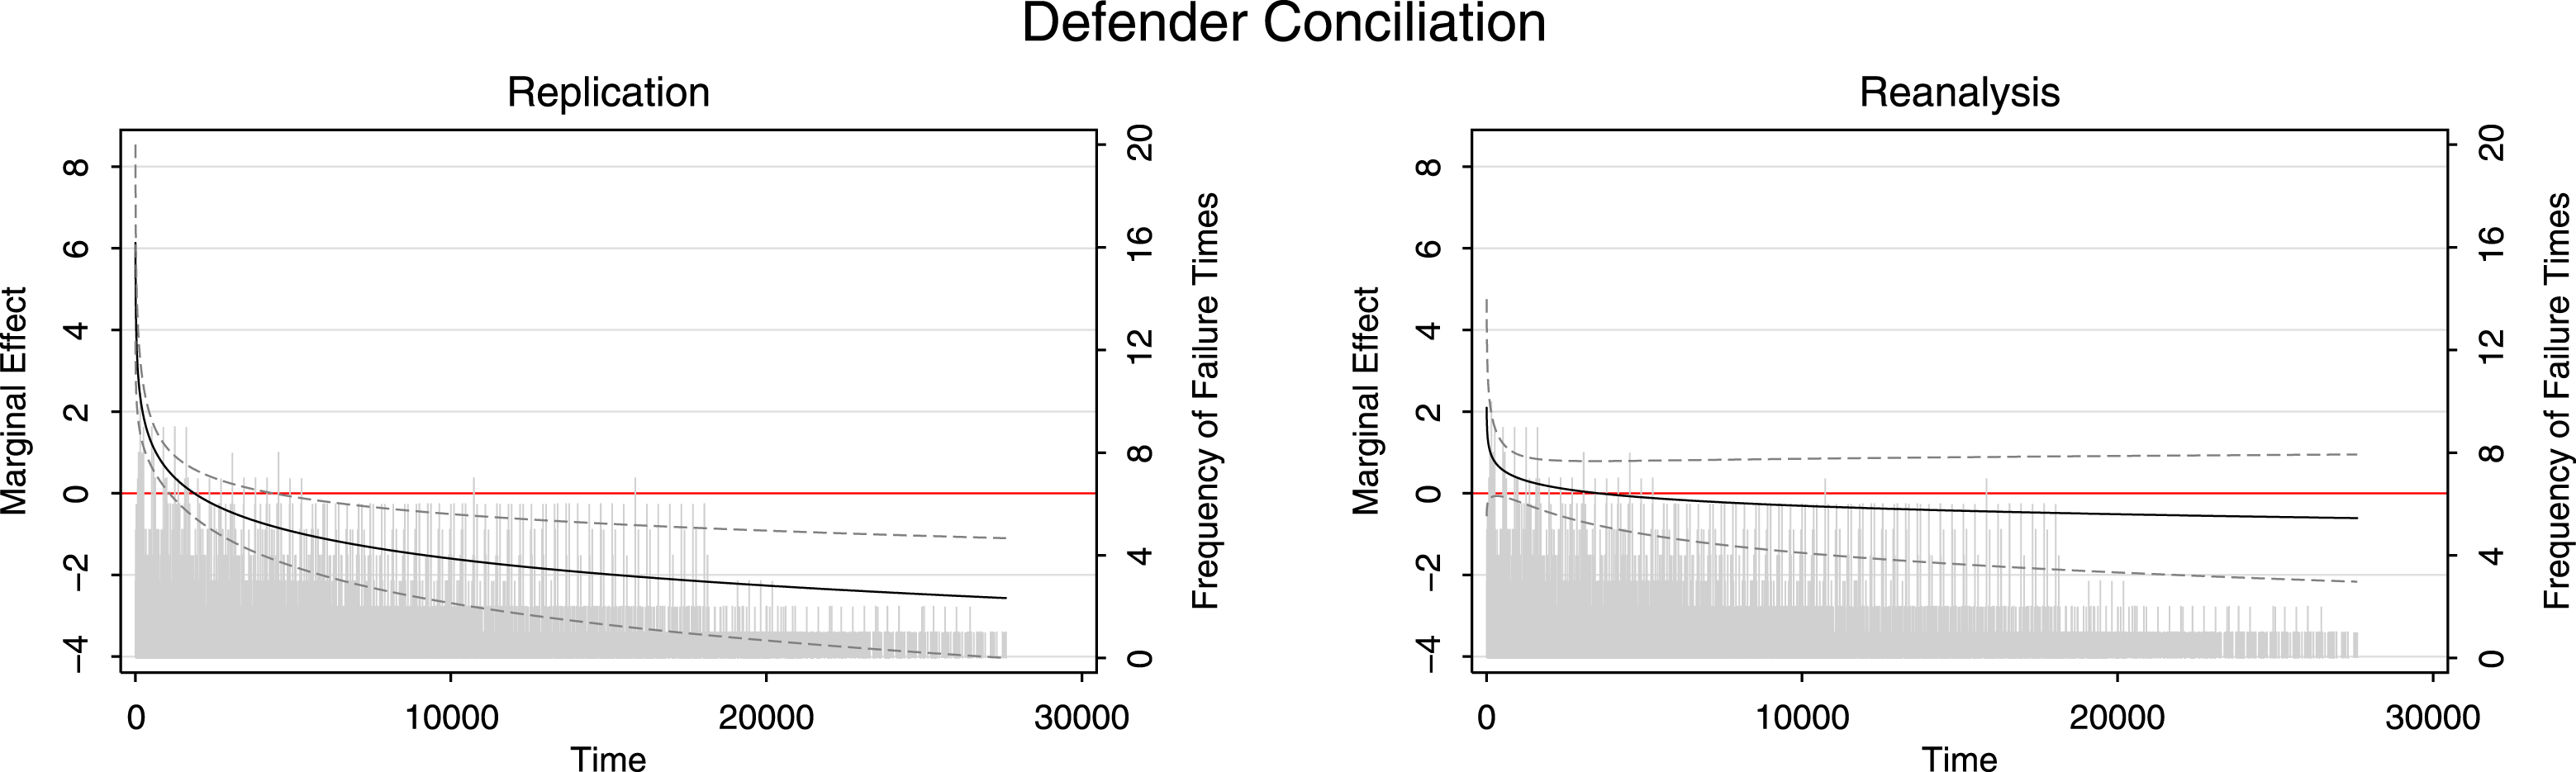
Figure 2. Repetitive military challenges (Grieco Reference Grieco2001 ).
Figure 2 illustrates a case with differences in significance. This comes from Grieco (Reference Grieco2001), which examines the correlates of repetitive military challenges. The dependent variable captures the duration between the end of a given militarized conflict and the beginning of the next conflict in which the two parties retain their roles as challenger and defender. All covariates violate the PH assumption. The results and interpretations of all covariates in the original analysis change dramatically when we implement the correction with TVCs — a large number of covariates lose their statistical significance with the appropriate adjustment.
5 Conclusion
Political science is well aware of the issues related to the PH assumption. The discipline has made progress in diagnosis, correction, and interpretation of NPH models. However, researchers frequently err when implementing the correction. Interacting a variable with time means that one now has TVCs, and the structure of the data must change correspondingly. Misapplication of the correction for NPH can lead to dramatic changes in significance and even sign. Researchers should take care to ensure that their analyses have the proper configuration so as to generate meaningful results.
Supplementary material
For supplementary material accompanying this paper, please visithttps://doi.org/10.1017/pan.2016.16.


