


Indigenous peoples throughout the world, including in Canada, suffer a disproportionate share of health problems compared with their non-Indigenous counterparts( Reference Anderson, Robson and Connolly 1 ). In Canada in 2011, a total of 859 970 individuals reported being First Nations peoples of Indigenous ancestry, representing 3 % of the Canadian population( 2 ). Almost half of these individuals lived on reserves and they were younger than the non-Indigenous share of the Canadian population( 3 ).
Compared with non-Indigenous peoples, First Nations peoples have a lower life expectancy( Reference Anderson, Robson and Connolly 1 ), higher prevalence of chronic and infectious diseases, and are more prone to have mental health issues( 4 – 6 ). Rates of being overweight or obese in First Nations communities are also consistently higher than among other Canadians( 7 ) and the worldwide prevalence of 39 %( 8 ). First Nations peoples are much more likely than other Canadians to have obesity-related chronic diseases such as type 2 diabetes mellitus and CVD( Reference Ayach and Korda 9 , Reference Belanger-Ducharme and Tremblay 10 ). These health disparities result from a complex intersection of factors, many of which have their origin in a long history of colonialism and assaults on indigenous ways of being and knowing. The alienation of lands and resources and the disempowering of Indigenous peoples from self-determination with respect to the stewardship of their environment have contributed to the socio-economic and political marginalization of these peoples( Reference Adelson 11 ).
Traditional food (TF) is the collective name for the fresh or minimally processed foods obtained from the local environments of First Nations peoples. First Nations diets in the pre-colonial and early-colonial periods consisted of a wide range of wild foods such as fish, shellfish, game, fowl, and roots, berries and other plants that were gathered from the land. Many First Nations peoples developed mariculture or horticulture to enhance food production, such as the creation of shellfish and root beds, the burning of forest and prairies, and the active collection and storage of seeds for future crops (corn, beans and squash). TF continues to be important to First Nations peoples for multiple reasons( Reference Willows 12 ). In addition to providing a cost-effective alternative to buying food in a store, TF can contribute to better health and a greater sense of well-being by providing a rich source of nutrients; social cohesion through food preparation and sharing practices; a sense of identity from engaging in customary food procuring traditions; and enhanced physical activity from the exertion required to obtain such foods( Reference Willows 12 – Reference Chan, Receveur and Batal 18 ). The introduction of market or store-bought foods (MF) into the diets of First Nations peoples contributed to a nutrition transition that resulted in the adoption of high-energy, nutrient-poor MF and the corresponding erosion of some customary practices associated with TF harvesting and consumption( Reference Willows 12 , Reference Egeland and Harrison 19 ). Because MF are quite heterogeneous in terms of nutritional quality (e.g. fruits v. carbonated beverages), there is a need to analyse MF with more specificity to better understand their impacts on the quality of the diet of First Nations peoples.
As the study of nutritional sciences evolves, it becomes apparent that one needs to look at more than just nutrients in a diet, and hence better methods of investigating the types of food (e.g. whole v. processed) that are consumed have been developed( Reference Fardet, Rock and Bassama 20 , Reference Monteiro, Moubarac and Cannon 21 ). The NOVA classification enables researchers to classify foods according to the nature, extent and purpose of food processing, and has been used to evaluate the impact of food processing on diet quality and health-related outcomes( Reference Adams and White 22 – Reference Moubarac, Batal and Louzada 27 ).
Studies using the NOVA classification have shown that consumption of ultra-processed foods (UPF) negatively impacts the nutritional quality of diets( Reference Adams and White 22 , Reference Louzada, Martins and Canella 24 – Reference Canella, Levy and Martins 26 , Reference Moubarac, Martins and Claro 28 ) and is associated with weight gain, obesity( Reference Louzada, Martins and Canella 24 , Reference Canella, Levy and Martins 26 , Reference Mendonca, Pimenta and Gea 29 ) and non-communicable diseases (NCD)( Reference Rauber, Campagnolo and Hoffman 30 , Reference Tavares, Fonseca and Garcia Rosa 31 ). UPF are industrial food and drink formulations made mostly from refined substances extracted or derived from other food sources and additives. They include sweet or savoury snacks, carbonated soft drinks, ready-to-eat meals, mass-produced packaged breads and buns, poultry and fish nuggets and other reconstituted meat products( Reference Moodie, Stuckler and Monteiro 32 ). International bodies such as the Pan American Health Organization and WHO have proposed using the energy share of UPF as an overall indicator of diet quality( Reference Vandevijvere, Monteiro and Krebs-Smith 33 ).
An important determinant of obesity and NCD is the proportion of sugar in the diet( Reference Te Morenga, Mallard and Mann 34 , 35 ). The WHO introduced the term ‘free sugars’ in 2002 to refer to monosaccharides (such as glucose, fructose) and disaccharides (such as sucrose or table sugar) added to foods and drinks by the manufacturer, cook or consumer, and sugars naturally present in honey, syrups, fruit juices and fruit juice concentrates( 36 ). The WHO’s latest recommendation states that free sugars be less than 10 % of total energy intake to reduce the risk of overweight, obesity and tooth decay( 37 ).
The objective of the present study was to investigate diet quality by estimating the consumption of UPF in the diets of adult First Nations living on reserves in four provinces in Canada and the impact of UPF on their free sugar consumption and overall diet quality. To our knowledge, this type of study has not been done previously.
Methods
Study
Following the passage of a resolution by the Assembly of First Nations in 2007, calling for the generation of more knowledge on the diet and environment of First Nations living on-reserve south of the 60th parallel, the First Nations Food, Nutrition and Environment Study (FNFNES) was developed to address gaps in these areas with respect to First Nations peoples( Reference Chan, Receveur and Batal 15 – Reference Chan, Receveur and Batal 18 ). FNFNES is a joint project between the Assembly of First Nations, University of Northern British Columbia, University of Ottawa and Université de Montréal, with funding and technical support from Health Canada, to investigate First Nations’ total diet and food-related exposures to environmental contaminants. This study was guided by the Tri-Council Policy Statement: Ethical Conduct for Research Involving Humans, and the First Nations data-related principles of Ownership, Control, Access and Possession (OCAPTM)( Reference Schnarch 38 ). All research activities were planned conjointly with individual communities through a methodology workshop in each targeted region (using Assembly of First Nations’ regions which largely correspond to the Canadian provinces), and original data, tabulated results and reports were returned to the communities mainly via face-to-face meetings with community members and workers before aggregate reports were provided for each region.
Sampling
A random multistage sampling strategy was established based on communities, households and individuals in four Canadian provinces (British Columbia, Alberta, Manitoba and Ontario)( Reference Chan, Receveur and Batal 15 – Reference Chan, Receveur and Batal 18 ). There are 442 First Nation communities in total in these four provinces. Community sampling was conducted based on ecological zones, which are naturally occurring divisions of the earth’s surface based on the distribution and systemic interdependence of plants and animals and their physical environment( Reference Wiken 39 ). Households were then randomly selected within communities. In households where more than one individual aged 19 years or older was present, the person with the next birthday was selected to participate in the research.
From 2008 to 2013, 5355 households in fifty-eight communities were sampled using the aforementioned process. Of the fifty-eight communities included in the analyses, eleven (19 %) were remote (fly-in or winter road only) and an additional twenty-five (43 %) were rural and ≥60 km away from the nearest urban centre. Of the 5355 households, fifty were not eligible (not First Nations, 19 years or older, or living on-reserve; or for health reasons such as deafness, cognitive impairment, etc.) and 138 homes were vacant. A total of 3847 inhabitants of the 5167 households completed an interview for a participation rate of 74·5 %. These participants were aged 19 years or older, living on-reserve and self-identified as First Nations. Pregnant and breast-feeding women were excluded (n 143) as well as individuals with no food intake the prior day (n 4). The final sample size was 3700 individuals from households in participating First Nations communities in the four provinces.
Data collection
Questionnaires were administered to each household participant by trained community members, with the guidance of a trained dietitian, to collect information on dietary patterns, lifestyle, general health status, environmental concerns and food security. Height and weight measurements were both self-reported and measured for individuals who agreed to have these values recorded. Where measured, participants’ weight was recorded using a Seca 803 digital scale (Seca Measuring Systems and Scales, Hanover, MD, USA) with the participant lightly clothed, and height was obtained with participants shoeless on an even surface using a measuring tape. BMI was calculated as weight/height2 (kg/m2) for 3362 participants. In 27·4 % (n 922) of cases, BMI was calculated from measured height and weight; in 20·6 % (n 691) of cases it was calculated from a combination of measured and reported data; and in 52·0 % (n 1749) of cases, it was calculated from reported measures. To test for bias in reported anthropometric values, paired t tests by gender were used to test for differences in BMI values using reported and measured heights and weights for participants who provided both these values. To adjust for a possible reporting bias in each province, if the difference between the reported and measured BMI was significant, then the estimated difference between the means (or estimated bias value) was added to the reported BMI where participants provided only reported values. This was necessary for Ontario and Alberta but not for British Columbia and Manitoba. BMI values were missing for 339 individuals who did not consent to provide anthropometric measures. Participants were considered overweight if their BMI was ≥25·0 kg/m2 and obese if it was ≥30·0 kg/m2 ( 40 ).
The questionnaires included a 24 h diet recall conducted in the autumn. The recall used a three-stage multiple-pass method, i.e. quick list, detailed description and review( Reference Raper, Perloff and Ingwersen 41 ). Portion sizes were estimated using three-dimensional food models (Santé Québec, Montréal, QC, Canada). Because 24 h recalls give reliable estimates of the nutrient intake of groups of individuals, no analyses requiring the evaluation of nutrient cut-offs were done( 42 ). A question on self-reported diabetes was considered in the analysis. This question was not present in the first year of the study in British Columbia and is thus considered in the analysis for only 3314 participants.
Data processing and analysis
All collected data were entered into a database by the research coordinators, except for information derived from the 24 h recalls, which were entered by research nutritionists at the Université de Montréal. Questionnaire data were entered using Epi-Info version 3.4 (Centers for Disease Control and Prevention, Atlanta, GA, USA). The 24 h recalls were analysed using CANDAT (Godin, London, ON, Canada) which is a nutrient analysis software that uses the 2010 Canadian Nutrient File (CNF)( 43 ). In addition to the CNF, a file created by the FNFNES analyst and containing nutritional information on some TF and other MF not available in the CNF was used to complete the CNF and estimate food and nutrient intakes. The accuracy of data entry of the 24 h recalls was ensured using several steps. First, a sub-sample of 10 % of the records were cross-checked and discrepancies reconciled. If many errors were found during this first process, a further 10 % check was conducted. Preliminary analyses were then performed to review for outliers such as unusual foods and intakes that were ±2 sd of the mean for energy and selected nutrients. Finally, all data entry errors were reconciled before finalizing the file for data analyses.
Food processing, as described by the NOVA classification, involves the physical, biological and chemical processes used to modify foods in their natural state. All foods and drinks reported in the 24 h recall data were classified into four NOVA groups: (i) fresh or minimally processed foods (fresh, dried or frozen fruits and vegetables, meats, grains and pasteurized milk); (ii) processed culinary ingredients (sugar, oils, fats and salt used in cooking); (iii) processed foods (canned foods, artisanal breads, cheese and smoked or fermented foods); and (iv) UPF (industrial formulations based on refined substances and additives such as flavours, emulsifiers, etc.)( Reference Adams and White 22 , Reference Moubarac, Batal and Martins 44 , 45 ). Next, mean estimates and se for energy intake and proportion of energy (percentage of energy) were calculated from each NOVA food group and selected subgroups within them. TF consumption was investigated (based on whether TF was reported eaten at least once on the 24 h recall) to determine whether it was associated with the consumption of NOVA food groups.
Free sugar content as a percentage of energy was estimated using a publicly available database developed at the University of Toronto which provided estimates for free sugars for more than 4000 food and drink products sold in Canadian food markets( Reference Kennedy 46 ). Each NOVA food group was matched manually with a corresponding item found in the free sugars database to estimate the proportion of free sugars from total sugar (i.e. both free sugars and naturally occurring sugars in fresh fruits, vegetables and milk). Products were matched by brand name when available, or by using a mean value for the various brands of the product. For items not found in the database, free sugars were estimated using the US Department of Agriculture’s database on added sugars( 47 ). Added sugars are sugars and syrups incorporated into foods during preparation or processing, or added at the table, but not naturally occurring sugars in foods( 47 ). Food items (n 320) in the food database with missing values for total sugars were also corrected using the University of Toronto and the US Department of Agriculture databases.
Diet quality was estimated by comparing the nutrient content of fresh or minimally processed foods, processed culinary ingredients and processed foods (collectively referred to as non-UPF) with that of UPF. Thereafter, the population was divided into quintiles of the proportion of energy from UPF. The first quintile thus included the lowest consumers of UPF and the fifth quintile included the highest consumers. The average dietary content of macronutrients (expressed as % of total energy), energy density (kJ/g) and energy-adjusted micronutrients and fibre (expressed as μg, mg or g/4184 kJ (1000 kcal)) was compared across quintiles of dietary share of UPF. Trend and χ 2 analyses were used to identify differences in the dietary contribution between quintiles of UPF and non-UPF.
The 95 % CI were used to evaluate differences in intake between the NOVA categories and trend analyses (using logistic regression) and χ 2 for differences between quintiles of energy from UPF, with significance at P<0·05. Unweighted data analysis used the statistical software packages SAS/STAT version 9.2 (2009) and IBM SPSS Statistics version 22·0 (2013).
Results
Table 1 summarizes some sociodemographic and health characteristics of the participants. Participants were, on average, 45·1 (95 % CI 44·6, 45·6) years old, had a BMI of 30·2 (95 % CI 30·0, 30·4) kg/m2 and were 62·7 % female. The majority (80 %) of participants were overweight, of whom 46 % were obese. One-fifth (20·5 %) self-reported having diabetes, of which 70·9 % of cases were type 2, 10·8 % were type 1 and 18·3 % were unknown type.
Table 1 Demographic, anthropometric, health and lifestyle characteristics of adults aged 19 years or older from fifty-eight on-reserve First Nations communities in British Columbia, Alberta, Manitoba and Ontario (Canada), 2008–2013
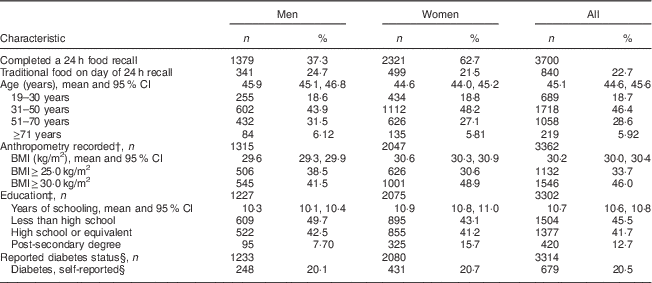
First Nations Food, Nutrition and Environment Study (FNFNES). Data are unweighted, and presented as n and % unless indicated otherwise.
† Number of individuals with self-reported or measured anthropometry was less than those who were interviewed for a 24 h recall.
‡ Number of individuals who reported their education on the questionnaire was less than those who were interviewed for a 24 h recall.
§ Self-reported prevalence based on the question: ‘Have you been diagnosed with diabetes?’ Number of individuals who self-reported having been diagnosed with diabetes or not on the questionnaire was less than those who were interviewed for a 24 h recall.
First Nations participants had a mean energy intake of 8166 (95 % CI 8029, 8303) kJ/d (1952 (95 % CI 1920, 1984) kcal/d). UPF accounted for 53·9 (95 % CI 53·1, 54·7) % of total energy, fresh or minimally processed foods for 36·4 (95 % CI 35·7, 37·2) %, processed culinary ingredients for 6·1 (95 % CI 5·89, 6·42) % and processed foods for 3·5 (95 % CI 3·20, 3·70) % of total energy. Table 2 presents the mean energy intake and dietary share of the NOVA food subgroups in the First Nations diet. MF and TF are distinguished in the table. Energy in the diet from UPF came mostly from fast food and ready-to-eat dishes (15·9 %), commercial breads (9·3 %), carbonated, energy and fruit drinks, and fruit juices (8·0 %), deli and processed meats (4·6 %), and salty snacks (3·6 %). Most of the energy in the diet from fresh or minimally processed foods came from meat and poultry (12·6 % of energy), grains and flours (6·2 %), eggs (3·4 %), and roots and tubers (2·8 %). Energy from market meats was four times that from traditional game and birds (839 kJ/d (201 kcal/d) v. 209 kJ/d (50 kcal/d)), whereas traditional fish provided more energy than market fish (53·1 kJ/d (12·7 kcal/d) v. 27·3 kJ/d (6·52 kcal/d)). Processed culinary ingredients that contributed the most to total energy were sugars (3·0 % of energy) and animal fats (1·9 %), mostly from market sources (6·1 %).
Table 2 Mean energy contribution of NOVA food groups and subgroups to the diet of 3700 adults aged 19 years or older from fifty-eight on-reserve First Nations communities in British Columbia, Alberta, Manitoba and Ontario (Canada), 2008–2013
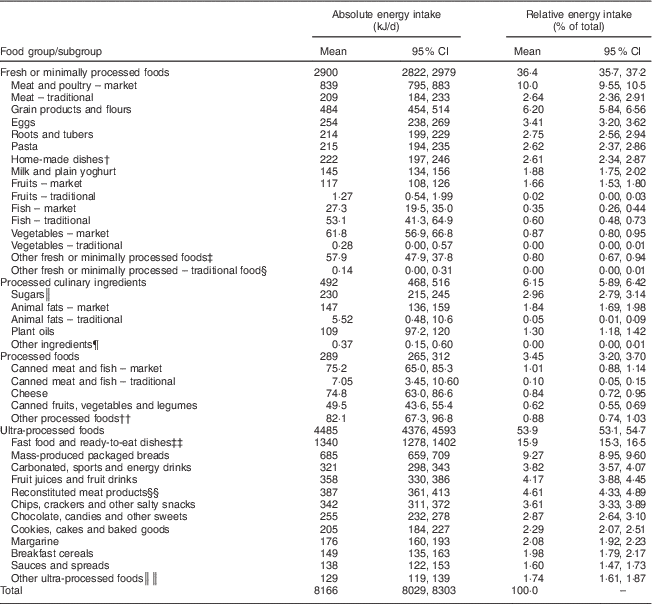
† Soups, salads, sauces, baked goods, stews and other dishes made from fresh or minimally processed foods.
‡ Spices and herbs, pulses, unsalted and unsweetened nuts; coffee, tea.
§ Labrador tea, wild ginger tea and peppermint.
║ White and brown sugar, icing sugar, molasses, honey and maple syrup.
¶ Vinegar, leavening agents, unsweetened cocoa powder, corn starch.
†† Salted, sweetened or oil-roasted nuts or seeds, plain tortillas and potato chips, tofu, soya sauce, condensed milk, peanut butter, French and pita breads, bannock and dumplings.
‡‡ Hot dogs, hamburgers, pizzas and sandwiches from fast-food outlets, commercial pies, canned or dehydrated soups; frozen and prepared French fries and onion rings and frozen meals.
§§ Sausages, luncheon meats, meat spreads, bacon, corned beef, beef jerky and fish sticks.
║║ Cheese products, fish or seafood imitations, meal replacements, sweeteners, supplements and coffee whitener.
Table 3 compares the energy and nutrient content of NOVA food groupings in the First Nations diet. The diet fraction from UPF was more energy-dense compared with the non-UPF fraction (i.e. the sum of minimally processed foods, culinary ingredients and processed foods). Compared with the non-UPF fraction of the diet, the UPF fraction had 3·5 times less vitamin A, 2·4 times less K, 2·2 times less protein, 2·3 times more free sugars and 1·8 times more Na. Saturated fats were equally high in both fractions at over 10 % of energy.
Table 3 Mean energy and nutrients from non-ultra-processed foods (non-UPF)Footnote † and ultra-processed foods (UPF)Footnote † of 3700 adults aged 19 years or older from fifty-eight on-reserve First Nations communities in British Columbia, Alberta, Manitoba and Ontario (Canada), 2008–2013
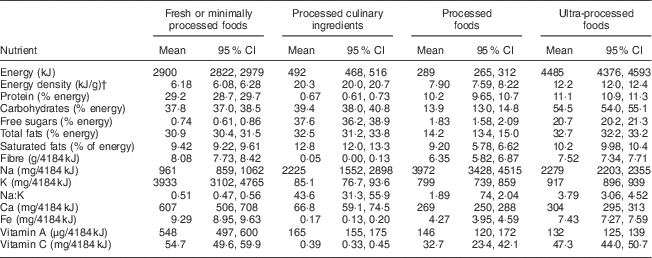
First Nations Food, Nutrition and Environment Study (FNFNES). Data are unweighted.
† Energy density calculated only for the solid fraction of the diet, referring to the sum of energy provided by solid foods divided by the amount of these foods in grams.
Table 4 presents how the mean nutrient content of the diet varied across quintiles of energy from UPF. It also reports the total energy and nutrients across categories. As the dietary contribution of UPF to energy increased, the contribution of energy density, carbohydrate, free sugar, fibre, fat, saturated fat, vitamin C, Na and Ca increased, as did Na:K, while protein, K, Fe and vitamin A intakes decreased. Diets of individuals who ate TF on the day of the recall were higher in fresh and minimally processed foods, processed culinary ingredients and processed foods, and lower in UPF, compared with the diets of individuals who did not eat TF. The percentage of those who ate TF decreased from 42·3 % in the first quintile of energy from UPF to 5·5 % in the highest quintile of UPF intake.
Table 4 Mean nutrients across quintiles of the dietary contribution of ultra-processed foods (UPF) to energy of 3700 adults aged 19 years or older from fifty-eight on-reserve First Nations communities in British Columbia, Alberta, Manitoba and Ontario (Canada), 2008–2013
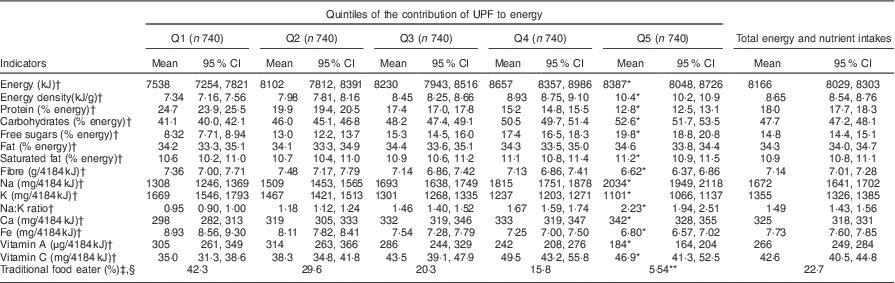
First Nations Food, Nutrition and Environment Study (FNFNES). Data are unweighted.
*P<0·05, **P<0·01.
† Trend analyses across quintiles.
‡ Differences using χ 2 test.
§ Based on whether First Nations traditional food was consumed at least once on the 24 h recall.
Discussion
Organizations such as the FAO have recognized the need to incorporate the collection of information on processed foods into food consumption surveys( 45 ). UPF sales are increasing over time, especially rapidly in low- and middle-income countries and populations around the world( Reference Raper, Perloff and Ingwersen 41 ), and may be related to the rising prevalence of obesity( Reference Louzada, Baraldi and Steele 23 , Reference Canella, Levy and Martins 26 , 48 ) and related NCD( Reference Monteiro, Moubarac and Cannon 21 , Reference Moubarac, Batal and Martins 44 , Reference Monteiro, Cannon and Moubarac 49 , Reference Moubarac, Parra and Cannon 50 ).
Given the legacy of colonialism in Canada, many Indigenous peoples remain caught in a vicious cycle of poverty and food insecurity, violence, educational failure and ill health( Reference Kendall 51 , 52 ). For First Nations peoples, TF systems have vital nutritional, cultural, symbolic and spiritual value. Obstacles to attaining TF and fresh and minimally processed MF are the high cost of healthy, nutritious foods relative to income, along with numerous barriers to the harvesting, sharing and consumption of TF( Reference Willows 12 ). A consequence of the involuntary transition from TF to market-based diets is increased consumption of UPF and a greater burden of obesity and obesity-related diseases( Reference Anderson, Robson and Connolly 1 ). The prevalence of obese (46 %) and overweight individuals (34 %) was very high among First Nations participants in the present study: there is some concern that cut-offs used for determining obesity are different for First Nations peoples( Reference Manjoo, Dannenbaum and Joseph 53 ), but others have confirmed that they are in fact the same as for those of European ancestry( Reference Lear, Humphries and Frohlich 54 ). The proportion of participants who reported having diabetes in our study (21·5 %) is 2·2 times higher than the national average in Canada of 9·3 %( 55 ). In this sample of First Nations peoples, we found high intakes of UPF (54 % of energy), while other studies have consistently shown the benefits of TF( Reference Batal, Gray-Donald and Kuhnlein 13 , Reference Johnson-Down and Egeland 14 , Reference Downs, Arnold and Marshall 56 ). We have also shown that the consumption of TF on the day of the recall was associated with lower energy from UPF.
One striking finding was the diminished contribution of protein to energy as the contribution of UPF to energy increased. Percentages of energy as protein, carbohydrate and fat were within the acceptable macronutrient distribution ranges( 57 ). As with other studies, we found that free sugar increased with higher energy from UPF( Reference Louzada, Martins and Canella 24 , Reference Martinez Steele, Baraldi and Louzada 58 ). These sugars have been associated with weight gain and obesity( Reference Te Morenga, Mallard and Mann 34 ). The contribution of free sugar to energy in the highest quintile of UPF intake was double the WHO recommendation of less than 10 % of energy from free sugars. Saturated fat intake in our study was greater than 10 % of energy in all quintiles of UPF intake in First Nations individuals; higher saturated fat intakes potentially increase CVD( 59 ).
UPF in our study of dietary intake from 2008 to 2013 represented 54 % of energy compared with other studies of intake of non-indigenous populations in Brazil from 2008–2009 (21·5 %)( Reference Louzada, Martins and Canella 24 ), the USA from 2009–2010 (57·9 %)( Reference Martinez Steele, Baraldi and Louzada 58 ) and the UK from 2008–2012 (53 %)( Reference Adams and White 22 ). Because Brazil is classified as middle-income country and UPF are relatively more expensive, a lower intake of UPF would be expected( Reference Monteiro, Moubarac and Cannon 21 ), while our results are consistent with other upper-income countries such as the USA and the UK despite the fact that many First Nations in Canada live in low-income households( Reference Gerber 60 ). Studies based on food expenditure data, which consider household purchases only without accounting for food waste, show 54 % of UPF in Canada (2011)( Reference Moubarac, Batal and Martins 44 ), 28 % in Brazil (2002–2003)( Reference Monteiro, Levy and Claro 25 ) and 63 % in the UK (2008–2012)( Reference Adams and White 22 ).
Our results agree with population-based studies in Canada( Reference Moubarac, Batal and Martins 44 ), the USA( Reference Martinez Steele, Baraldi and Louzada 58 ), the UK( Reference Adams and White 22 ) and Brazil( Reference Louzada, Martins and Canella 24 ) that have consistently shown that UPF are nutritionally inferior compared with non-UPF and are linked to an overall deterioration of diet quality. These foods were found to have a higher content of free sugars, saturated fats and Na, and were more energy-dense compared with non-UPF, whereas UPF were also lower in protein, minerals, most vitamins and fibre. The nutritional quality of the diet fraction of UPF consumed by First Nations peoples in our study was mostly consistent with previous studies, with the exception of higher fibre and vitamin C as UPF increased. The higher content of vitamin C in UPF in Canada can be attributed to fortification practices.
Since the NOVA food categories are a relatively recent development, few studies have been able to evaluate associations of intake with mortality and morbidity( Reference Monteiro, Levy and Claro 25 ). Studies in Brazil indicate the existence of associations between UPF and metabolic syndrome in adolescents( Reference Tavares, Fonseca and Garcia Rosa 31 ), dyslipidaemias in children( Reference Rauber, Campagnolo and Hoffman 30 ) and obesity in all age groups( Reference Louzada, Baraldi and Steele 23 , Reference Canella, Levy and Martins 26 ). A cross-sectional time-series analysis performed on thirteen Latin American countries revealed an association between increased sales of UPF and increased BMI in adults from 2000 to 2009( 48 ). A recent prospective cohort study in Spain found that consumption of UPF was associated with higher risk of overweight and obesity( Reference Mendonca, Pimenta and Gea 29 ). In future studies, we intend to examine the association of UPF intake with NCD and BMI of First Nations peoples who participated in the FNFNES.
As was evident from our data, decreasing K and increasing Na intakes with higher UPF may lead to increased risk of hypertension in an already susceptible population( 61 ). Reduced Na intakes have long been recommended as a public health initiative to reduce blood pressure and CVD( Reference Johnson, Raj and Trieu 62 , 63 ). Concurrently, higher K has a protective effect on blood pressure and related NCD( 61 ). Furthermore, the increasing Na:K is a concern as this has also been associated with blood pressure and CVD( Reference Zhang, Cogswell and Gillespie 64 , Reference Cook, Obarzanek and Cutler 65 ).
TF provides a very important food source for Indigenous populations in Canada( Reference Willows 12 ) and some of the TF most common in such diets are clearly beneficial to health( Reference Kwon, Apostolidis and Kim 66 ). First Nations peoples in Canada have been going through a nutrition transition where MF are increasingly replacing TF in their diets( Reference Willows 12 ). Increased health challenges in some First Nations communities, such as high rates of obesity, diabetes and CVD( Reference Anderson, Robson and Connolly 1 ), make it imperative to identify ways to slow down these epidemics. There is plenty of evidence that diets including TF are more nutrient-dense( Reference Johnson-Down, Labonte and Martin 67 , Reference Johnson-Down and Egeland 68 ); therefore, it can be speculated that diets higher in TF may result in a lower prevalence of obesity and diet-related NCD( Reference Anderson, Robson and Connolly 1 ). An inverse association between TF intake and energy from UPF in our results is an interesting and novel finding that shows the positive benefit of TF consumption for First Nations people. Given the many co-benefits of TF for Indigenous populations (e.g. social cohesion, sense of identity, physical exertion), there is simply no good reason to avoid stressing the importance of TF to decision makers so that access to and concomitant conservation of TF become increasingly possible.
Public health recommendations are made targeting nutrient intakes that may not be easily understood and applied by the general population. Food-based advice is generally easier to follow. A recommendation to decrease UPF intake in First Nations participants could significantly increase protein and K intakes and decrease free sugar, Na and overall energy intakes. A reduction of UPF would also lead to a healthier diet as these foods would potentially be replaced by foods with a better nutritive profile. Doing this would require policy changes that reduce the availability of UPF and allow all Canadians, regardless of income or geography, to choose a diet rich in fresh and minimally processed foods, and additionally address both climate change and pollution of natural resources. Support is also needed for individuals to make these changes through educational initiatives to promote the optimal use of MF and TF, when available.
One of the limitations of our study was missing data, mainly due to a refusal to answer questions about years of education (12·2 % missing data), highest degree obtained (10·8 %), age (7·8 %) and BMI (9·2 %). However, the proportion of missing data was greatest with respect to education and diabetes (10·5 % missing data) because these questions were not included during the first year of data collection (i.e. in British Columbia).
However, the large sample allowed us to identify trends that may not have been evident with a smaller population. While the study may not be representative of all First Nations in Canada, as data from only four out of the ten provinces were represented, and there may be systematic differences in dietary intake across other regions in Canada, further data from across the country will be available when FNFNES is completed in 2018.
A potential limitation of our study is that, due to social desirability bias (i.e. valuing fresh foods more than processed foods), the intake of minimally processed foods and TF may have been over-reported by participants whereas the intake of UPF may have been under-reported( Reference Subar, Freedman and Tooze 69 ); consequently energy intake may have been underestimated. The NOVA food categories were created from the self-reported dietary data, so social desirability bias may have been minimized compared with using an FFQ containing the different NOVA food groups. The standardized methods that we used may help better estimate intake( Reference Raper, Perloff and Ingwersen 41 ). This method may also lead to the overestimation of healthy foods and the underestimation of unhealthy foods that may have influenced our results. The FAO considers 24 h recalls as one of the best ways of collecting data for this type of analysis, as more information is gathered on the types of foods using an open-ended approach( 45 ). However, with one 24 h recall, only the intake of the group can be considered, not the proportion of the population meeting nutrition recommendations. National nutrient databases evolve over time and there is always some possibility of error and missing information on nutrients.
As the NOVA food classification was applied a posteriori from the entry and coding of the recalls, it is possible that some foods were misclassified due to limited food choices in the CNF and a lack of brand names in the database. If data entry had been designed to correspond with the NOVA classification, more accurate distribution may have been obtained and other studies have noted this possible limitation( Reference Adams and White 22 , 45 , Reference Martinez Steele, Baraldi and Louzada 58 ). Since the NOVA food classification does not group foods according to their nutritional quality, but rather based on the degree and nature of processing, some groupings might appear unusual from a nutritional perspective. However, the current study and others have shown the linear relationship between the increased contribution to energy from UPF and reduced diet quality, regardless of the inclusion/exclusion of specific food items in the UPF group and their individual nutrient profile. In addition, CANDAT, our nutrient analysis software, does not allow us to disaggregate mixed foods based on recipes, so it is possible that some UPF used in culinary preparations, such as margarine used in making a traditional First Nations’ quick bread called bannock, may have been included in the fresh and minimally processed foods.
Future studies could benefit from standard guidelines for assignment to NOVA categories, such as brand names, home prepared v. ready-to-consume, and name of restaurant where food is purchased( Reference Adams and White 22 ). Future analyses might identify the MF that, when consumed in combination with TF, will contribute to a diet for First Nations peoples that is more congruent with the current dietary recommendations and more protective against the development of NCD. This, in turn, will allow public health initiatives to better target dietary advice to this particular population, thereby supporting not only better health and nutrition, but also a wide range of other factors that can contribute to the overall well-being and cultural resilience of Indigenous peoples in Canada.
Acknowledgements
Acknowledgements: The authors would like to acknowledge the efforts of the following individuals in the collection of the data used in this study: Olivier Receveur, Harold Schwartz, William David, Laverne Gervais, Lisa Wabegijig, Judy Mitchell and Kathleen Lindhorst. They would like to thank all members of the communities who participated in and worked on the study. Financial support: Funding for this analysis was provided by an operating grant from the Canadian Institutes for Health Research (CIHR) for the research project ‘Pulling Together for Health Research: Food Security in First Nations Communities’ (grant numbers 348833 and 334049). The data used in this article originate from the First Nations Food, Nutrition and Environment Study (FNFNES) funded by Health Canada. At the time of this research, N.W. was the recipient of a Health Scholar award from Alberta Innovates Health Solutions. The funders had no role in the design, analysis or writing of this article. Conflict of interest: No conflict of interest. Authorship: M.B. and N.W. designed the concept, guided the analyses and planned the manuscript. L.C., M.B. and T.S. are Principal Investigators and C.T. is Co-Investigator of FNFNES which provided the data for the current analyses. K.F. helped in the study design and coordinated data collection of FNFNES. M.B. and N.W. wrote the manuscript with the help of L.J.D. T.S., C.T. and L.C. edited the manuscript for content and clarity. J.-C.M. contributed to the literature review, categorized the foods into NOVA groups and designed the analyses. J.-C.M., L.J.D. and A.I. analysed the data. Ethics of human subject participation: This study was conducted according to the guidelines laid down in the Declaration of Helsinki and was guided by the principles of the Canadian Institutes of Health Research Guidelines for Health Research Involving Aboriginal People, and the Tri-Council Policy Statement: Ethical Conduct for Research Involving Humans. All procedures involving human participants were approved by the Research Ethics Board of Health Canada, University of Northern British Columbia, University of Ottawa and Université de Montréal. Written informed consent was obtained from all participants. The present study was approved by ethics boards at the Université de Montréal and University of Alberta.


