

I. INTRODUCTION
Deep learning technology has shown excellent performance in a wide variety of practical applications (e.g. energy [Reference Kelly and Knottenbelt1,Reference Mocanu, Nguyen, Gibescu and Kling2], aviation [Reference Akçay, Kundegorski, Devereux and Breckon3,Reference Zheng, Sheng, Sun and Chen4], software [Reference Shi, Wang, Xu and Chu5,Reference Bahrampour, Ramakrishnan, Schott and Shah6], traffic [Reference Huang, Song, Hong and Xie7–Reference Fang10], etc). Biomedical engineering [Reference Mamoshina, Vieira, Putin and Zhavoronkov11] combines the knowledge of science and techniques of engineering to solve clinical problems in medicine. A common task in biomedical engineering is to classify and predict the presence of diseases in the human body through biological images, sounds, or patient provided information (e.g. alcohol or tobacco consumption, medical history, and symptoms). Although previous studies had already accomplished the detection of disease of abnormal status using one of the above-mentioned biomedical features, using two or more categories of features had rarely been attempted before. To our knowledge, this is the first study to classify voice disorders based on acoustic signals and medical history, which brings great advancements to both modeling techniques and clinical practicability.
From a health science perspective, the pathological status of the human voice can substantially reduce the quality of life and occupational performance, which results in considerable costs for both the patient and the society [Reference Titze12,Reference Stachler13]. Current standards recommend the use of laryngeal endoscopy for the accurate diagnoses of voice disorders [Reference Stachler13], which requires well-trained specialists and expensive equipment. In places without sufficient medical resources, and for patients lack of adequate insurance coverage, correct diagnosis and subsequent treatment may be delayed [Reference Fang14]. A previous study had also noticed that even among professional vocalists, reluctance to seek medical intervention is frequent[Reference Gilman, Merati, Klein, Hapner and Johns15].
To mitigate these problems and lowering the barriers, noninvasive screening methods have been proposed for clinical applications [Reference Vaziri, Almasganj and Behroozmand16]. Because of laryngeal disorders, particularly those originating from the membranous vocal folds, almost always result in the change of voice quality, an automatic recognition framework was developed to detect the presence of vocal diseases based on features extracting from acoustic signals [Reference Fang14].
Voice disorders are one of the most common medical diseases in modern society, especially for patients with occupational voice demand. Common etiologies include neoplasm (e.g., squamous cell carcinoma), phonotraumatic lesions (e.g., vocal polyps and cysts), and neurogenic dysfunction (e.g., unilateral vocal palsy); which can substantially reduce an individuals quality of life [Reference Cohen, Dupont and Courey17]). In recent decades, automatic detection of voice pathologies gathered a lot of academic interest, using various machine-learning-based classifiers such as support vector machine [Reference Arjmandi and Pooyan18–Reference Pishgar, Karim, Majumdar and Darabi22], Gaussian mixture model (GMM) [Reference Arias-Londoño, Godino-Llorente, Sáenz-Lechón, Osma-Ruiz and Castellanos-Domínguez23–Reference Wang and Jo26], convolutional neural network [Reference Wu, Soraghan, Lowit and Di Caterina27–Reference Alhussein and Muhammad29], and long short-term memory [Reference Gupta30,Reference Hsu, Zhu, Wang, Fang, Rudzicz and Tsao31]. Some approaches take advantage of automatic speech recognition for acoustical analysis and assessment of pathological speech [Reference Lee32]. Previous studies had already demonstrated the potential to detect pathological voice samples [Reference Dibazar, Narayanan and Berger33–Reference Henríquez, Alonso, Ferrer, Travieso, Godino-Llorente and Díaz-de María35]. Our recent study used a deep neural network (DNN) approach and achieved the highest accuracy of 99.32% [Reference Fang14] among current literature for a well-established MEEI database [Reference Zhang and Jiang36,Reference Moran, Reilly, de Chazal and Lacy37]. Another study from our research group had also pointed out the potential advantage of using patient-provided information to differentiate several categories of voice disorders [Reference Tsui, Tsao, Lin, Fang, Lin and Wang38].
Despite great success in the detection of abnormal voice signals using various machine learning algorithms and signal processing techniques, a further classification of pathological voice samples into several different etiologies has seldom been attempted before. Epidemiological studies clearly demonstrated risk factors and specific symptoms for different categories of voice disorders [Reference Stemple, Roy and Klaben39]. Personal habitual behaviors may also contribute to the development of voice disorder, e.g., laryngeal neoplasms typically resulted from chronic exposure to tobacco and alcohol [Reference Hashibe40]. In this study, we integrate a more comprehensive data set including demographics, medical history, clinical symptoms, and acoustic signals from dysphonic patients to examine if multimodal learning can be applied to classify common voice disorders. In earlier works, multimodal learning has been used to combine voice signals with other modalities for speech recognition [Reference Ngiam, Khosla, Kim, Nam, Lee and Ng41,Reference Mroueh, Marcheret and Goel42], speech emotion recognition [Reference Hsiao, Sun, Hsieh, Tsai, Tsao and Lee43,Reference Wu, Lin and Wei44], and speech enhancement [Reference Hou, Wang, Lai, Tsao, Chang and Wang45] tasks. Experimental results have confirmed the effectiveness of incorporating the information from additional modalities to improve the performance in target objectives.
This study proposes two multimodal learning frameworks to classify common voice disorders. In the first framework, called hybrid GMM and DNN (HGD), acoustic signals are first converted into a one-dimensional static supervector via a GMM. Then, a DNN fuses supervectors with medical record data and performs classification. The second framework, referred to as two-stage DNN (TSD), performs classification in a two-stage manner. In the first-stage, acoustic signals and medical records are processed by DNNs individually, and each of the two DNNs generates a three-dimensional output vector indicating the possibility of three target voice disorders. The second-stage DNN fuses the output vectors of the first-stage DNNs and generate final probabilities of disease prediction. Experimental results show that the proposed TSD framework outperforms systems that rely solely on acoustic signals and medical records, respectively, with notable accuracy improvements of 10.32% (from 76.94 to 87.26%) and 5.70% (from 81.56 to 87.26%), and UAR improvements of 17.34% (from 64.25 to 81.59%) and 7.94% (from 73.65 to 81.59%). Model-based combination is an effective scheme for diverse-source learning. In contrast with feature-based combination, the key principle is to train a model to characterize each modality individually. Then a fusion module is used to combine model outputs to perform disease diagnoses. To the best of our knowledge, this is the first study combining both acoustic signals and patient-provided information in the task of computerized classification of voice disorders.
II. PATHOLOGICAL VOICE CLASSIFICATION FRAMEWORKS
A) Study subjects
1) Acoustic signals
Pathological voice samples were collected from a voice clinic in a tertiary teaching hospital (Far Eastern Memorial Hospital, FEMH, Taiwan). The database includes 589 samples of three common voice disorders, including phonotraumatic diseases (i.e. vocal nodules, polyps, and cysts), glottic neoplasm, and unilateral vocal paralysis (Tables 1 and 2). The clinical diagnosis of voice disorders is based on videolaryngostroboscopic examination [Reference Stachler13]. All patients received voice recordings of a sustained vowel /a:/ at a comfortable level of loudness, with a microphone-to-mouth distance of approximately 15−20 cms, using a unidirectional microphone and a digital amplifier (CSL model 4150B, Kay Pentax). The sampling rate was 44100 Hz with a 16-bit resolution, saved in the uncompressed.wav format.
Table 1. FEMH data description.
Abbreviations: ♂, male; ♀, female.
Table 2. Phonotrauma data description.
Abbreviations: ♂, male; ♀, female.
2) Medical record
Besides voice recordings, study subjects also completed a detailed questionnaire in Table 3 about demographic features (e.g., age and sex), duration (years and months), and onset of dysphonia, dysphonic symptoms, occupations (e.g., teacher, stage performer, and business), and occupational vocal demands (using a 4-point Likert scale with the following anchors: always, frequent, occasional, and minimal). Cigarette smoking was classified as active, past, and never. Alcohol consumption was classified as never, occasionally, weekly, and daily. Patients were instructed to self-rate their voice quality using a visual analog scale (VAS) with scores ranging from 0 (worst) to 10 (best) and fill out questionnaires with 10-item voice handicap index (VHI-10) and reflux symptom index (RSI) [Reference Aaltonen46–Reference Belafsky, Postma and Koufman48].
Table 3. Medical records of demographics and symptoms feature retrieved from the FEMH database.
B) Feature extraction
1) Acoustic signals
The following six steps must be performed to derive 13-coefficient MFCCs from acoustic signals: pre-emphasis, windowing, fast Fourier transform, Mel scale filter bank, nonlinear transformation, and discrete cosine transform. MFCCs frames were extracted from a window length of 16-millisecond and captured 8-millisecond overlap for time shift.
2) Medical record
To simplify the input parameters, we encode each item into digit numbers. For example, binary data (i.e. yes/no) is recorded as 1/0. In ordinal data such as tobacco and alcohol consumption, we encode it as 0/1/2 (never/past/active) or 0/1/2/3 (never/occasionally/weekly/daily), respectively. Coding and definition of all the 34 input variables are presented in Table 3.
C) Typical combination methods
1) Feature-based combination
Feature-based combination is an intuitive approach to learning from diverse information sources. The basic principle is to concatenate heterogeneous features directly to form a new higher dimensional feature, and then a classifier is trained to perform classification with concatenated features as input. If we consider medical records as an individual dynamic feature, the dimension of the combined feature is (L+d), including d acoustic features and L medical record features. Moreover, if features of acoustic signals contain N frames, then medical records will be duplicated N times and used in all frames. In accordance with the concept of feature-based combination, we establish a one-stage DNN (OSD) system. In OSD, acoustic features and medical records are represented by a sequence of MFCC+delta vectors and digit numbers, respectively. We then derive the concatenated feature by combining the MFCC+delta vectors and the numerical digit. Finally, a DNN is used in OSD to perform classification with concatenated features.
2) Model-based Combination
In this paper, the established model-based combination system is referred to as DNN with Linear Combination (DLC). In DLC, acoustic signals and medical records are processed by DNNs individually. A linear combination function is then used as the fusion module to linearly combine the outputs of the two DNNs. The weights of the linear combination function are estimated based on the training data to maximize classification accuracy.
D) Enhanced feature-based combination algorithm
Although the implementation of feature-based combination is straightforward, the key drawback of OSD is not fully considering the dynamic properties of different information sources. In fact, acoustic waves are rather dynamic compared with the medical record, creating difficulties in model learning. To overcome this limitation, this study proposes an enhanced feature-based combination algorithm, called HGD. In HGD, the acoustic signals are first modeled by a GMM, and then the means of the GMM are concatenated to form a supervector for feature combination instead of using MFCC+delta in OSD.
The basic principle for the GMM-based supervector is to represent a sequence of acoustic features with arbitrary length as a static long vector [Reference Bocklet, Haderlein, Hönig, Rosanowski and Nöth49]. This technique is a standard method and has been validated for speaker recognition tasks [Reference Reynolds, Quatieri and Dunn50]. GMM-based supervector extraction involves two steps. First, one must train the GMM-universal background model (UBM) using a dedicated data set. The training process in this step is performed in an unsupervised manner and does not require classification labels. Then, each utterance is used to adapt the GMM-UBM to generate an utterance-specific GMM. Finally, a supervector is formed by concatenating the mean vectors into a higher-dimensional vector; for instance, by stacking d-dimensional mean vectors of a M-component adapted GMM into a M * d-dimensional GMM-based supervector [Reference Campbell, Sturim and Reynolds51,Reference Kinnunen and Li52].
Figure 1 shows the architecture of the proposed HGD framework. In this framework, a GMM-UBM is first trained based on the entire data set. Then, acoustic features for each utterance were used to adjust the mean parameters of the GMM-UBM. The adjusted mean parameters are concatenated to form a supervector. The size of a supervector is determined by the number of GMM-UBM. Then, a DNN fuses the supervector and medical records to perform classification.
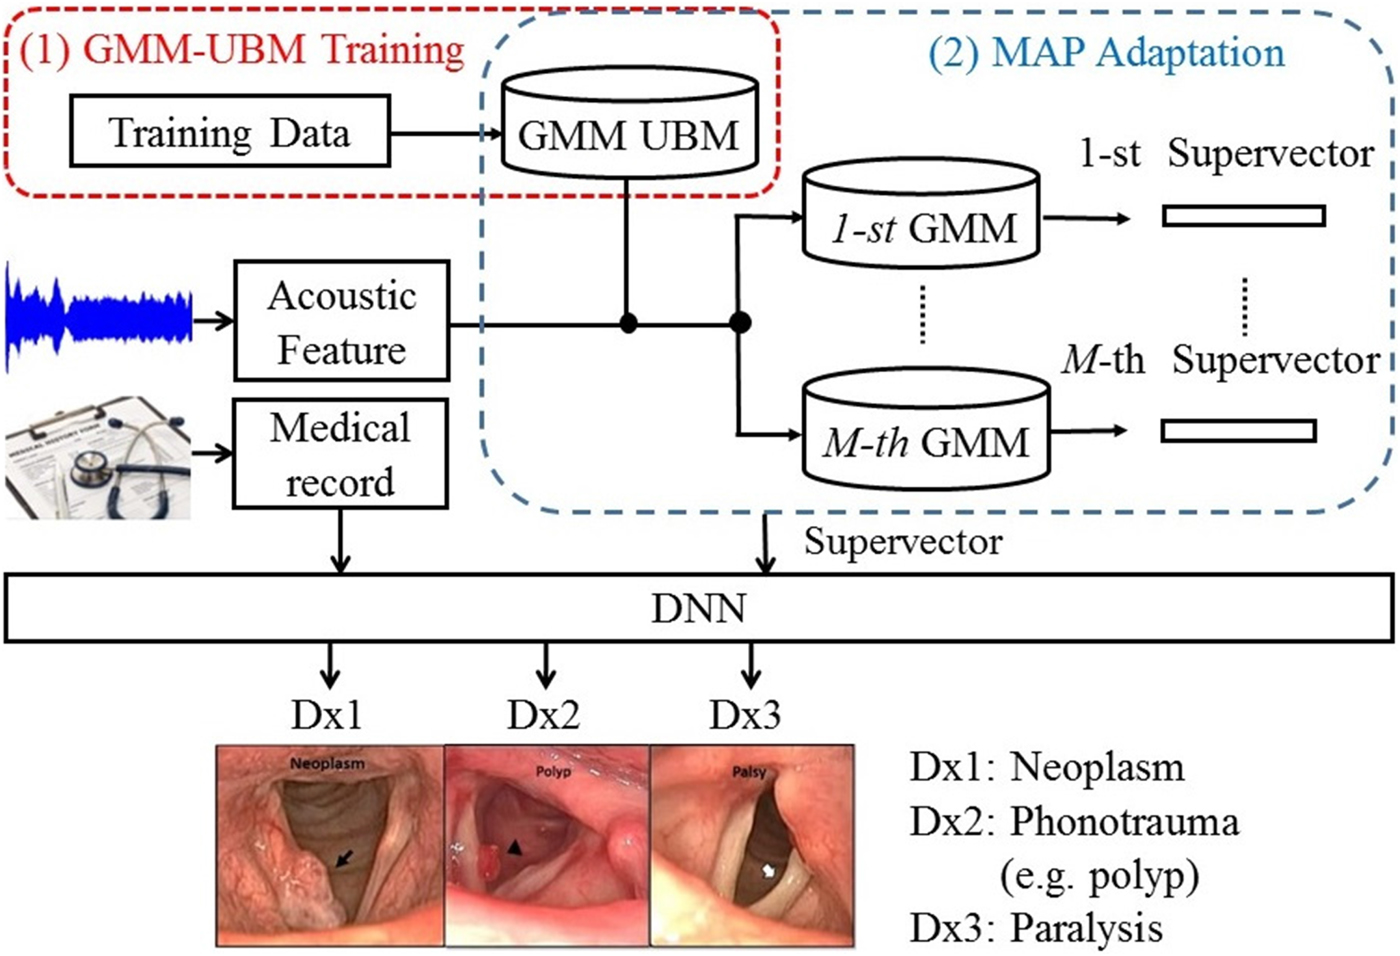
Fig. 1. The block diagram of the proposed HGD framework.
E) Enhanced model-based combination algorithm
To further improve the performance of DLC, we proposed an enhanced model-based combination algorithm referred to as two-stage DNN (TSD). In contrast with DLC, another deep learning model is used as the fusion module to combine the outputs of the DNNs in order to characterize the joint effects of separate modalities, namely, acoustic signals and medical records in this study, more accurately. The architecture of the TSD framework is shown in Fig. 2. It can be divided into two stages. In the first stage, two DNNs (referred to as first-stage DNNs) are used to process acoustic signals and medical records individually. Each of the two first-stage DNNs generates a three-dimensional output vector indicating the probability of three target voice disorders. Unlike DLC, in which the fusion is a linear combination, the fusion mechanism in TSD is an alternative DNN (termed second-stage DNN). Note that the inputs of the second-stage DNN are acoustic signals (26 dimensions), medical records (34 dimensions), and the outputs of the two first-stage DNNs with six-dimensional vectors (3+3 dimensions). The second-stage DNN fuses outputs of the first-stage DNNs, mean of acoustic signal, and medical records, and then performs classification. Additionally, the architecture of all DNNs contains 300 neurons with three hidden layers and having sigmoid function for the activation function.
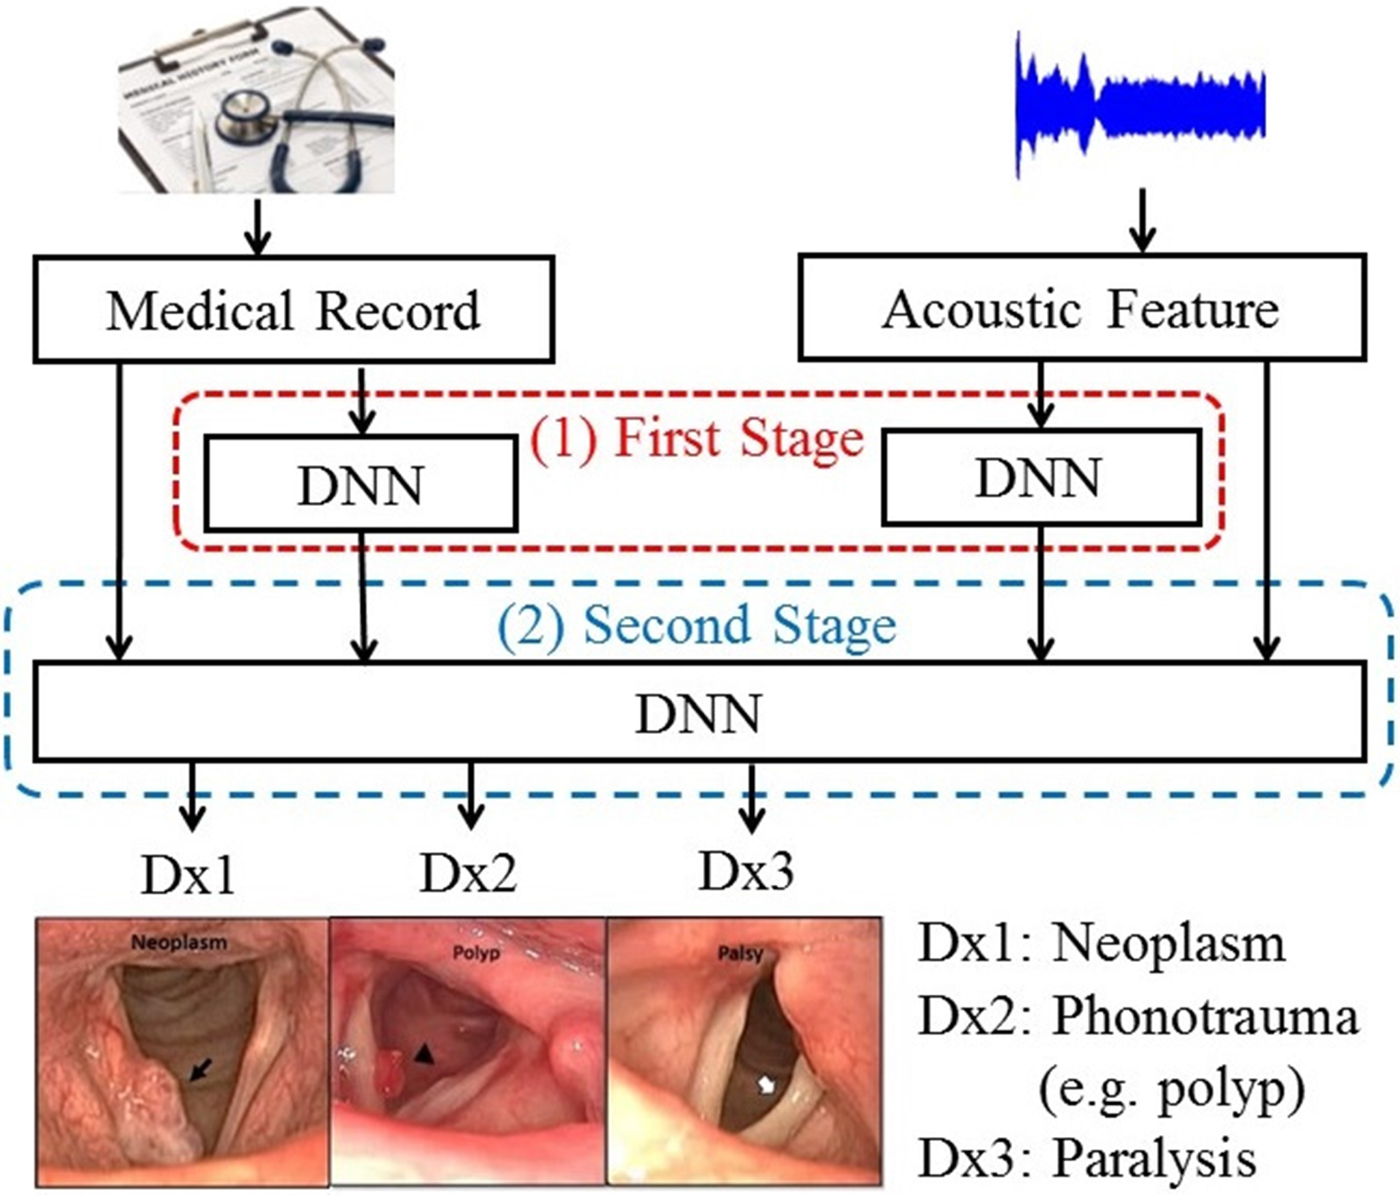
Fig. 2. The block diagram of the proposed TSD framework.
III. EXPERIMENTS AND RESULTS
A) Experimental setup
This study focuses on three typical voice disorders including phonotraumatic lesions (i.e. vocal nodules, polyps, and cysts), glottic neoplasm, and unilateral vocal paralysis. The voice samples are recorded by asking the patients to pronounce a sustained vowel (/a:/) for at least 3 s. During the experimental processes, we randomly divided each class of voice disorders into training (80%) and testing (20%) sets. The performance was verified through five-fold cross-validation. In addition to the 13 MFCCs, we added 13 delta features (the first derivative features of MFCCs) to form 26 dimensional MFCCs+delta feature vectors. The delta feature is obtained from the frames of MFCC over time. Because MFCC is the static cepstral features, adding dynamic information is widely used in many recognition tasks [Reference Fang, Fei, Xu and Tsao9, Reference Kumar, Kim and Stern53–Reference Fang, Chuang and Wang55]. The cepstral variance normalization was then applied to the MFCC(N)+delta feature vectors in such a manner that the normalized feature vectors have zero mean and unit variance.
In this study, we used three performance indexes: overall accuracy (ACC), sensitivity, and UAR. These indexes were widely employed in the classification tasks. First, ACC is the value of the difference between prediction and truth in equation (1), where TP, TN, FP, and FN represent true positive, true negative, false positive, and false negative, respectively.
 $$ACC = 100\%\times {TN+TP \over TN + TP + FN + FP}.$$
Second, as shown in equations (2)(4), the sensitivity for each disorder is also a common index for the classification task, where neo, pho, and pal stand, respectively, for neoplasm, phonotrauma, and vocal palsy; unneo, unpho, and unpal denote non-neoplasm, non-phonotrauma, and non-vocal palsy, respectively.
 $$SN_{neo} = 100\%\times {TP_{neo}\over TP_{neo}+FN_{unneo}},$$
 $$SN_{pho} = 100\%\times {TP_{pho}\over TP_{pho}+FN_{unpho}},$$
 $$SN_{pal}= 100\%\times {TP_{pal}\over TP_{pal}+FN_{unpal}}.$$
Finally, UAR is an alternative index considering unbalanced data, as shown in equation (5), where K denotes the number of classes (K=3 in this study).
 $$UAR = 100\%\times {SN_{neo}+SN_{pho}+SN_{pal}\over K}.$$
B) Experimental results
Figure 3 shows acoustic waves and spectrogram plots of glottic neoplasm, phonotrauma, and vocal palsy voice samples. In the waveform plots, all samples had irregular diversification in each period. Because of the loss of normal muscle tone, voice samples from cases of vocal palsy usually demonstrate much lower amplitude of volume (3b) than others, with weak spectrum in high-frequency harmonics (3e). Glottic neoplasm may invade the deeper structures of the vocal folds, such as vocal ligaments of muscles. In contrast, phonotraumatic lesions are usually confined to subepithelial spaces, as they do not violate the original tissue structure. Accordingly, we observed that the harmonic structure of phonotraumatic samples is generally preserved (3f), while cases of glottic neoplasm showed distorted harmonics (3d). These differences are more prevalent in higher frequency domain. However, owing to the limitations from inter-subject variability, it remains difficult to categorize the pathological voice simply by time-domain waves and frequency-domain signals.
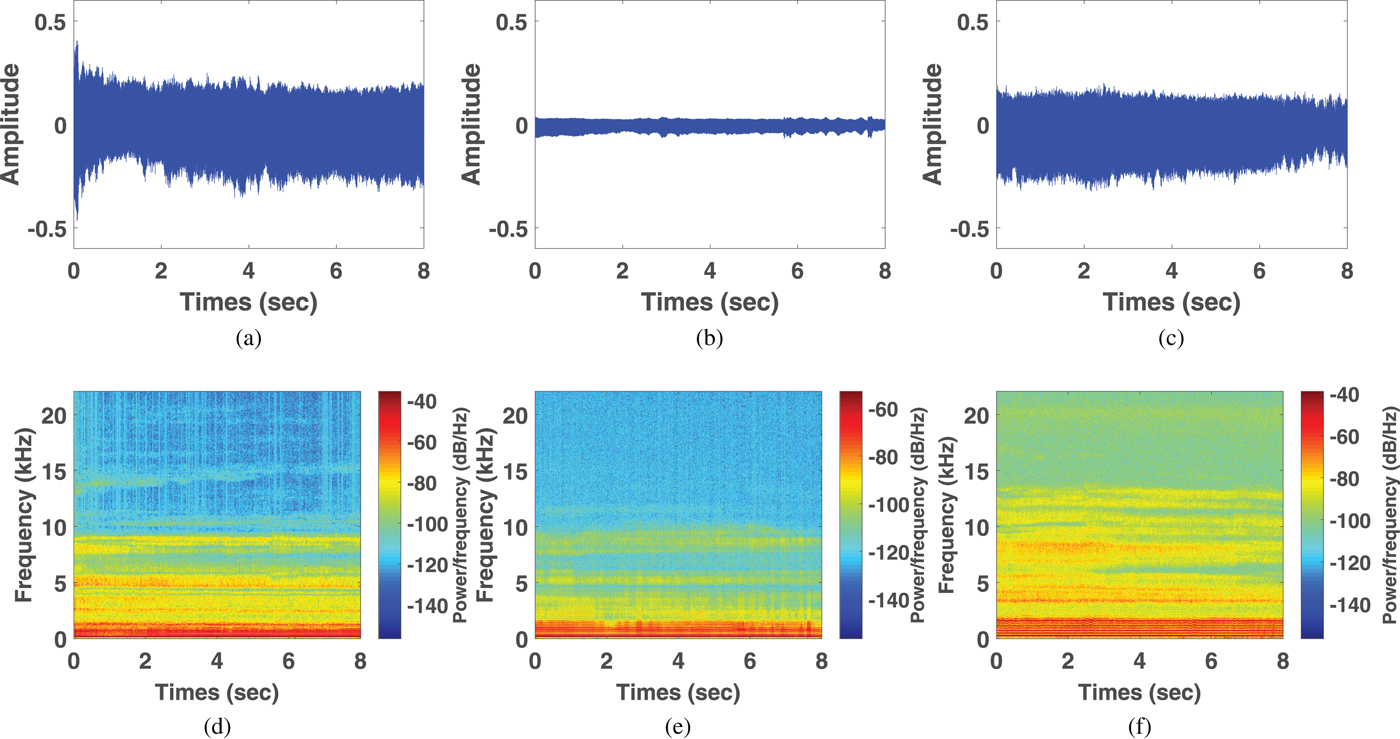
Fig. 3. Waveforms from voice samples of neoplasm (a), vocal palsy (b), and phonotrauma (c). Wide band spectrograms in voice samples of neoplasm (d), vocal palsy (e), and phonotrauma (f).
Additionally, we also plot the feature distributions to better visualize the results via principle component analysis (PCA). PCA is a widely used approach in which a linear transformation is designed to compress the information among features into the relatively lower dimensions [Reference Fang, Chuang and Wang55–Reference Meng and Yang59]. Figures 4 and 5 show the distribution of the first and second principal component among all data sets for acoustic signals and medical record, respectively. Figures 4(b) and 4(c) are the joint distribution in two-dimension principal component space of the first and second principal component for acoustic signals MFCC, respectively. The input data set for PCA is the 26-dimensional MFCCs of all training data. The x- and y-axis in Fig. 4 represent the first and the second principle comments (PC), respectively. The unit of PC is the same as that in MFCC because each PC is, in fact, a linear combination of all MFCCs. By reconstructing the covariance matrix of all training data, the linear weights is determined by the corresponding eigenvalue, which quantifies the information contributed by the corresponding MFCC component. These figures show that the features of three categories almost overlap in the scatter plot, while few neoplasm frames can be distinguished. Figures 4(a) and 4(d) plot the histogram of individual components and show a similar trend. That is, three kinds of voice disorders are overlapped in most area, making the classification difficult while using only two components. We follow the same procedure to plot the histogram of individual components and the joint distribution for medical record, as shown in Fig. 5. Note that the difference between Figs 5 and 4 is that the MFCC feature is frame-based whereas the medical record is individual-based, thus the samples are unequal. More importantly, results show that the medical record seems to has better distinguish ability among three voice disorders. From Fig. 5(b) and 5(c), the overlapped region between vocal palsy and phonotrauma is smaller than Fig. 4. Accordingly, these additional plots supported our idea of including medical records as an adjuvant features to differentiate three categories of vocal disorders.
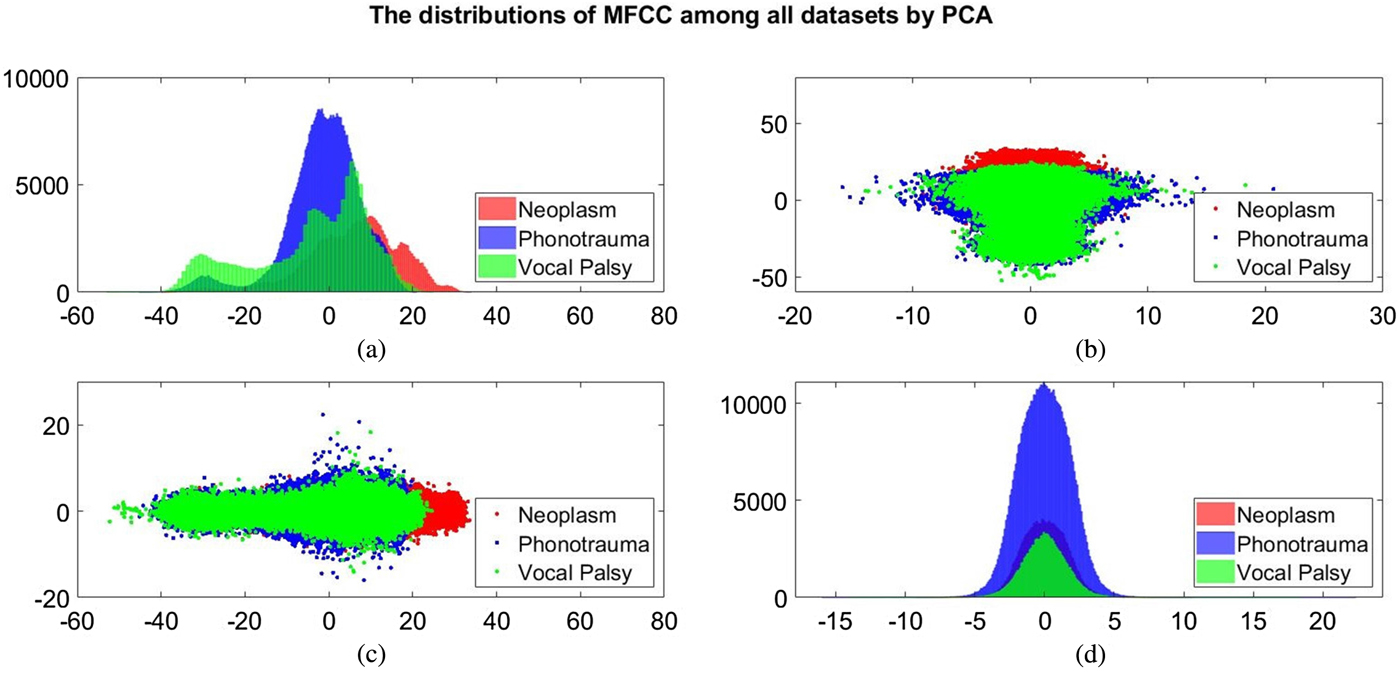
Fig. 4. Distribution of the first and second principal component for acoustic signals MFCC. (a) and (d) Are the histogram of individual components, while (b) and (c) are the joint distribution in two-dimension principal component space (the first and second principal components are placed at different axes in (b) and (c)).
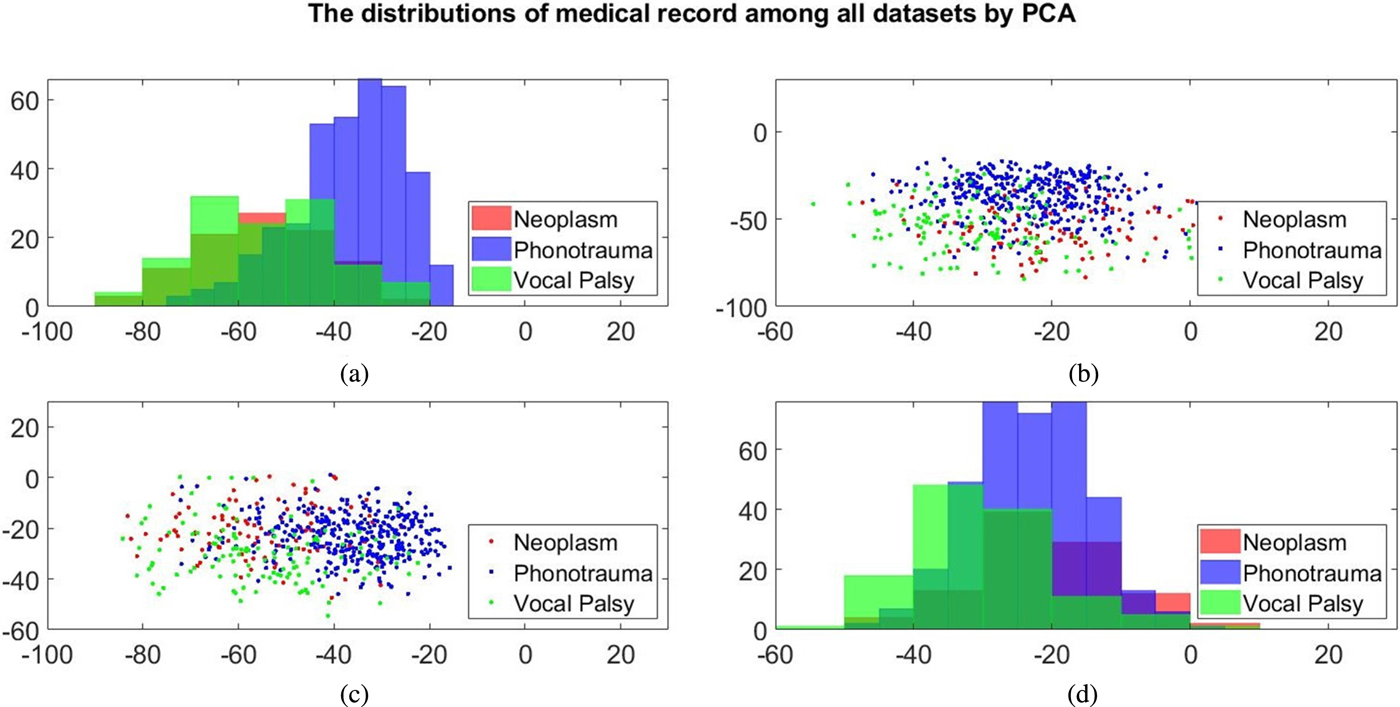
Fig. 5. Distribution of the first and second principal component for medical record. (a) and (d) Are the histogram of individual components, while (b) and (c) are the joint distribution in two-dimension principal component space (the first and second principal components are placed at different axes in (b) and (c)).
Table 4 reports three performance indexes of the OSD, DLC, HGD, and TSD systems. Performance indexes for systems using only acoustic signals or medical records are also listed as the baseline for comparison. From the table, we first note that the system using medical records outperforms the one using acoustic signals, with an accuracy improvement of 4.62% (from 76.94 to 81.56%) and a UAR improvement of 9.40% (from 64.25 to 73.65%), and the difference was statistical significant (p<0.001) (Tables 5 and 6). The results confirm that the medical records can contribute more useful information as compared with acoustic signals when classifying multiple voice disorders.
Table 4. Performance comparison.
Table 5. P-value for accuracy (ACC).
Table 6. P-value for unweighted average recall (UAR).
Furthermore, the results in Table 4 demonstrate that DLC, a typical multimodal learning system, outperforms systems using acoustic signals and medical records alone. More specifically, DLC achieved significant accuracy improvements of 6.64% (from 76.94 to 83.58%) and UAR improvements of 9.83% (from 64.25 to 74.08%), compared with systems using acoustic signals (p<0.001, Tables 5 and 6). We also noticed that DLC (model-based combination) outperforms OSD (feature-based combination) in this task. When comparing to OSD, DLC yields a higher accuracy of 6.10% (from 77.48 to 83.58%) (p<0.001, Table 5).
The results suggest that a direct combination of a dynamic signal source (acoustic feature sequence) and static information (medical records) may be problematic in the feature domain, and thus, the performance does not necessarily improve compared with learning from an individual source. In this case, the model-based combination is a more suitable approach. The same trends have been reported in previous multimodal learning works [Reference Hou, Wang, Lai, Tsao, Chang and Wang45].
Table 4 also shows that the proposed HGD framework outperforms OSD in regard to accuracy (p<0.001, Table 5). Notably, when comparing with OSD and DLC, TSD achieved significant improvements of accuracy and UAR (p<0.001, Tables 5 and 6). Note that OSD uses a simple feature concatenation scheme and DLC uses a simple model combination scheme to learn information from multiple modalities. On the other hand, the proposed TSD processes acoustic features and medical records using the first-stage DNNs, whose outputs are fed to the second-stage DNN. Specifically, the TSD jointly optimizes DNNs for feature processing and for the fusion module for classification and is thus able to achieve higher performance than OSD (optimizing a DNN for the fusion module) and DLC (optimizing DNNs for feature processing).
Finally, we note that TSD outperforms HGD, leading to an accuracy improvement of 3.68% (from 83.58 to 87.26%) and a UAR improvement of 5.46% (from 76.13 to 81.59%) with a borderline statistical significance (Tables 5 and 6). Note that HGD adopts a GMM-based supervector for a more suitable combination of the information in acoustic signals and medical data, and thus achieves better performance than OSD and DLC. However, the GMM-based supervector is an average representation of the whole acoustic feature sequence. On the contrary, the TSD that jointly optimizes first-stage DNNs (for feature processing) and the second-stage DNN (for fusion) in order to generate optimal classification results representing a better approach for this pathological voice detection task.
From the results of Table 4, we can observe an interesting diversity of interaction between disease categories and classification models. The four multimodal learning systems and the systems using acoustic signals and medical records alone perform similarly in phonotrauma, in which all the sensitivities are around 90%. The results suggest that when individual classifiers can already yield satisfactory performance, the multimodal learning generate only marginal performance improvements. However, for glottic neoplasm, although systems using only acoustic signals and medical records do not perform well, the proposed HGD and TSD can yield notable improvements of performance by combining acoustic signals and medical records. The TSD approach achieves best performance among all results reported in Table 4, confirming the advantages of the two-stage learning architecture, which jointly considers feature processing and multimodality fusion in a unified framework.
IV. CONCLUSION
This paper proposes two multimodal learning frameworks, namely HGD and TSD, to efficiently exploit the complementary advantages of acoustic signals and medical records. The HGD framework transforms dynamic acoustic waveforms into a static supervector via a GMM; the supervector is then combined with the medical records to form the input vector for the DNN to perform classification. The TSD framework has a two-stage DNN architecture to jointly optimize the feature processing and the fusion module. Experimental results from 589 samples of glottic neoplasm, phonotraumatic lesions, and vocal paralysis demonstrated that the proposed multimodal learning frameworks outperform systems using simply acoustic signals or medical records for classifying voice disorders, and improves the accuracy and UAR by 2.02–10.32% and 2.48–17.31%, respectively. The proposed frameworks also provide higher accuracy and UAR than typical feature-based and model-based combination methods.
In the future, we plan to deploy the proposed multimodal learning frameworks to detect and predict voice disorders in real clinical scenarios. A potential implementation would be via internet and cloud computation. In such environments, acoustic signals may be distorted by environmental noises, quality of recording devices, and channel mismatches. Furthermore, patients provided information may not be as complete as those gathered from medical facilities. More robust and effective refinements of the proposed multimodal learning frameworks are required to predict diverse categories of voice disorders with scarce training data and low-computational costs.
ACKNOWLEDGEMENTS
The study protocol was approved from the Research Ethics Review Committee of Far Eastern Memorial Hospital, Taipei, Taiwan (No. 105139-E). This study is supported by research grants from the Ministry of Science and Technology, Taipei, Taiwan (MOST 106-2314-B-418-003, 107-2314-B-418-008, and 108-2634-F-155-001).
Shih-Hau Fang (M’07-SM’13) is a Full Professor in the Department of Electrical Engineering, Yuan Ze University (YZU), and MOST Joint Research Center for AI Technology and All Vista Healthcare, Taiwan. He received a B.S. from National Chiao Tung University in 1999, an M.S. and a Ph.D. from National Taiwan University, Taiwan, in 2001 and 2009, respectively, all in communication engineering. From 2001 to 2007, he was a software architect at Chung-Hwa Telecom Ltd. and joined YZU in 2009. Prof. Fang has received several awards for his research work, including the Young Scholar Research Award (YZU, 2012), Project for Excellent Junior Research Investigators (MOST, 2013), Outstanding Young Electrical Engineer Award (the Chinese Institute of Electrical Engineering, 2017), Outstanding Research Award (YZU, 2018), Best Synergy Award (Far Eastern Group, 2018), and Y.Z Outstanding Professor (Y.Z. Hsu Science and Technology Memorial Foundation, 2019). His team won the third place of IEEE BigMM (Multimedia Big Data) HTC Challenge in 2016, and the third place of IPIN (Indoor Positioning and Indoor Navigation) in 2017. He is currently technical advisor to HyXen and PTCom Technology Company Ltd., an Associate Editor for IEICE Trans. on Information and Systems, and serves as YZU President's Special Assistant. Prof. Fang's research interests include artificial intelligence, mobile computing, machine learning, and signal processing. He is a senior member of IEEE.
Chi-Te Wang received his MD degree from the National Taiwan University, Taipei, Taiwan, in 2003. After resident training from 2003 to 2008, he joined Far Eastern Memorial Hospital as an attending physician. He received PhD degree from the Institute of Epidemiology and Preventive Medicine at National Taiwan University in 2014. He received the PhD degree from the Institute of Epidemiology and Preventive Medicine at National Taiwan University in 2014. During his professional carrier, he visited Mount Sinai Hospital (NYC, 2009), Mayo Clinic (Arizona, 2012), Isshiki voice center (Kyoto, 2015), UC Davis voice and swallow center (Sacramento, 2018), and UCSF voice and swallow center (San Francisco, 2018) for continual exposure on the expertise practice. He is a corresponding member of the American Laryngological Society and member of councils on the Taiwan Otolaryngological Society and Taiwan Voice Society. He has a wide clinical and academic interest on different fields, including phonosurgery, automatic detection and classification of voice disorders, real time monitoring of phonation, and telepractice of voice therapy. He is the winner of Society for Promotion of International Oto-Rhino-Laryngology (SPIO) Award on 2015, and Best Synergy Award of Far Eastern Group on 2018.
Ji-Ying Chen received the B.S. and M.S. degrees in electrical engineering from Yuan Ze University, Taoyuan, Taiwan, in 2017 and 2019, respectively. His research interests include artificial intelligence, machine learning, and signal processing.
Yu Tsao received the B.S. and M.S. degrees in electrical engineering from National Taiwan University, Taipei, Taiwan, in 1999 and 2001, respectively, and the Ph.D. degree in electrical and computer engineering from the Georgia Institute of Technology, Atlanta, GA, USA, in 2008. From 2009 to 2011, he was a Researcher with the National Institute of Information and Communications Technology, Tokyo, Japan, where he was involved in research and product development in automatic speech recognition for multilingual speech-to-speech translation. He is currently an Associate Research Fellow with the Research Center for Information Technology Innovation, Academia Sinica, Taipei, Taiwan. His research interests include speech and speaker recognition, acoustic and language modeling, audio-coding, and biosignal processing. He was the recipient of Academia Sinica Career Development Award in 2017 and National Innovation Award in 2018.
Feng-Chuan Lin received the MD degree from the University of Taipei, Taipei, Taiwan, in 2009. He became a speech therapist after graduation. He joined the Department of Otolaryngology, Head and Neck Surgery at Far Eastern Memorial Hospital from 2015. He is currently the president of New Taipei City Speech-Language Pathologists Union. His clinical and academic interests include voice therapy, speech training, and swallowing rehabilitation.
APPENDIX
In order to provide statistically objective results, we repeated the experiments for five rounds and obtained a total of 25 validation data sets and examined the performance between different models using Student's t-tests. Bonferroni method was applied to adjust the significant level of p value, as illustrated below:
0.05 (original significant level of p value)/30 (numbers of repeated statistical tests, Tables 5 and 6) = 0.00167
For easier interpretation, we defined p<0.001 as the adjusted significance level.


 Open access