


A key recommendation from the 2016 Ending Childhood Obesity committee report( 1 ) is to investigate the behavioural responses of children to the modern obesogenic food environment as a critical element to tackle childhood obesity. The report recognised that eating behaviours emerge and stabilise early in life, and are linked with higher energy intakes and rapid weight gain among children <5 years of age( Reference Nishtar, Gluckman and Armstrong 2 ). Whereas a number of genetic, epigenetic and environmental risk factors have been identified in childhood obesity, these often manifest in habitual eating behaviours that support sustained positive energy balance and weight gain( Reference Silventoinen, Rokholm and Kaprio 3 , Reference Hebebrand and Hinney 4 ). Eating behaviours have been shown to be highly heritable and linked with common obesity-related gene variants such as fat mass and obesity-associated protein (FTO)( Reference Carnell, Haworth and Plomin 5 – Reference Wardle, Llewellyn and Sanderson 9 ).
One of the eating behaviours previously studied in the context of energy intake and obesity risk is the rate of eating. Research on adults has shown that people who eat faster tend to consume more energy during a meal( Reference Robinson, Almiron-Roig and Rutters 10 ), and longitudinal studies have shown an increased risk of weight gain independently of other lifestyle factors( Reference Tanihara, Imatoh and Miyazaki 11 ), of becoming overweight or obese( Reference Sasaki, Katagiri and Tsuji 12 – Reference Ohkuma, Hirakawa and Nakamura 15 ) and of a range of metabolic diseases( Reference Sakurai, Nakamura and Miura 16 – Reference Lee, Ko and Gong 18 ). The Behavioural Susceptibility Theory suggests there is a link between genetic factors, appetitive traits and adiposity, and it has been proposed that faster eating rates are a behavioural marker of appetitive traits that predispose children to higher energy intakes and increased risk of weight gain( Reference Llewellyn and Wardle 19 , Reference Carnell and Wardle 20 ). Obese children tend to eat more rapidly than non-obese children( Reference Drabman, Hammer and Jarvie 21 ) and show less variation in their eating patterns( Reference Drabman, Cordua and Hammer 22 ), highlighting stable behavioural eating patterns by pre-school age. Using data from the Twins Early Development Study, Llewellyn et al.( Reference Llewellyn, van Jaarsveld and Boniface 23 ) demonstrated a heritable component in eating rate and a positive association with BMI status among school-aged children. Comparison of microstructural patterns of eating within a meal has shown that obese children have a faster eating rate compared with healthy weight children, achieved by taking larger bites( Reference Laessle, Uhl and Lindel 24 ) and fewer chews per bite( Reference Drabman, Cordua and Hammer 22 , Reference Chei, Toyokawa and Kano 25 , Reference Fogel, Goh and Fries 26 ). However, some studies have failed to show a link between eating rate and weight status( Reference Spiegel 27 , Reference Park and Shin 28 ).
Eating rate has also been identified as a behavioural marker of prospective weight and fat mass gain in longitudinal studies of child growth and development. Variations in eating speed can already be observed at 2–4 weeks postpartum, and vigorous suckling, akin to faster eating, has been linked to higher energy intakes and prospective weight gain up to age 3 years( Reference Agras, Kraemer and Berkowitz 29 ), and was predictive of weight gain at 12 and 24 months( Reference Stunkard, Berkowitz and Schoeller 30 ). In a large population-based study, faster feeding at approximately 3 months of age predicted subsequent weight at 9 months more strongly than weight at 9 months predicted subsequent eating speed (at 15 months), supporting the idea that differences in early feeding speed are likely to influence early weight gain( Reference van Jaarsveld, Llewellyn and Johnson 31 ). In pre-school children, the rate of eating at age 4 years was predictive of prospective weight gain, whole-body adiposity and abdominal adiposity at age 6 years independently of maternal weight status( Reference Berkowitz, Moore and Faith 32 ), supporting a link between rapid eating and weight gain. Whole-body and abdominal adiposity are important risk factors for type 2 diabetes( Reference Freemantle, Holmes and Hockey 33 ) and the metabolic syndrome( Reference Shah, Murthy and Abbasi 34 ), and are particularly problematic in South Asian populations, who show increased levels of adiposity within the healthy-range of BMI, and onset of metabolic diseases at lower BMI( Reference Ramachandran, Wan and Snehalatha 35 ). Previous research has highlighted the need for further studies linking children’s eating behaviours, energy intake and body composition measures across different ethnic groups( Reference Berkowitz, Moore and Faith 32 ). It has been previously demonstrated that the self-reported eating rate shows stronger associations with prevalence of overweight in younger compared with older Asian children( Reference Murakami, Miyake and Sasaki 36 ). No study to date has investigated variations in Asian children’s observed eating rates and related this to their energy intake and body composition. Since BMI is a poor summary measure of adiposity among Asian children( Reference Ramachandran, Wan and Snehalatha 35 ), comprehensive assessments were made to estimate total adiposity using anthropometry and abdominal adiposity by MRI. The present study investigated the relationship between eating rate and ad libitum energy intake during a meal among 4·5-year-old Singaporean children. Second, we explored whether eating rate was related to children’s BMI z-score (BMI z ) and adiposity. We predicted that (i) children who eat at a faster rate would consume more energy during an ad libitum meal and that (ii) faster eating would be associated with higher body weight and adiposity. To examine whether faster eating rate is associated with energy intake during a meal independently of energy requirements, we tested a model in which (iii) the association between body weight and energy intake during the meal is mediated by the children’s eating rate.
Subjects
The 483 mother–child dyads studied were a subset of the larger Growing Up In Singapore Towards Healthy Outcomes (GUSTO) cohort (n 1247( Reference Soh, Tint and Gluckman 37 )). Participants took part in a video-recorded ad libitum buffet lunch task at age 4·5 years (54 (sd 2) months). After removal of videos because of non-compliance with the test protocol (e.g. child leaving the room while eating or children sharing their food with a parent; n 97), the final sample consisted of 386 parent–child dyads from three ethnicities: Chinese (n 210), Indian (n 68) and Malay (n 108), and balanced child sex (n 202 boys and n 184 girls). Children whose data were not included in the analyses did not differ from the analysed sample in energy consumed, frequency of foods chosen, sex, ethnicity, BMI or any other anthropometric measures (P>0·05). The study was approved by the Institutional Review Boards of the hospitals involved (clinical trials registry: NCT01174875) and all participants provided informed consent to participate in the meal. A detailed summary of the participant selection and a number of participants considered in various analyses is summarised in the flow chart (online Supplementary Material).
Methods
Ad libitum meal
Foods served during the meal were provided ad libitum in a buffet and comprised nine commercially available foods and three drinks, selected as familiar and accepted products for this age group based on FFQ data from the same cohort. The foods and drinks served were: white bread (10·89 kJ/g (2·63 kcal/g); six slices; Gardenia), Honey Stars cereal (15·9 kJ/g (3·8 kcal/g); 80 g; Nestle), pancakes (12 kJ/g (3 kcal/g); 70 g; Aunty Jemima), chocolate cake (18·0 kJ/g (4·3 kcal/g); 80 g; Sara Lee), cheese (12·34 kJ/g (2·95 kcal/g; Cowhead); 66 g), chicken cocktail sausage (12·34 kJ/g (2·95 kcal/g); 192 g; Fairprice), chicken nuggets (9·58 kJ/g (2·29 kcal/g); 216 g; CP), apple slices (1·84 kJ/g (0·44 kcal/g); 204 g), canned maize (3·39 kJ/g (0·81 kcal/g); 160 g; Hosen), apple juice (2·1 kJ/ml (0·5 kcal/ml); six boxes; Marigold), full-cream milk (2·72 kJ/ml (0·65 kcal/ml); six boxes; Marigold) and water. Additional portions of each item were also available should any single item have been fully consumed during the meal. Energy content of food items was derived from the Health Promotion Board of Singapore food composition tables( 38 ).
The test room was equipped with video cameras positioned in three corners of the test room. Cameras enabled high resolution video capture of all aspects of the food choice and consumption, and it was possible to zoom in from different angles up to 400 % without the loss of resolution, for the behavioural coding of specific eating behaviours. Children were instructed to consume their normal breakfast at home and abstain from consuming foods for a minimum of 3 h before the meal. Before the meal, mothers were requested not to interfere with children’s food choices or portion size selection, but otherwise were free to interact with their child in the usual way. Participants were told that they could eat as much or as little as they wished during the meal, and that they would be given 20 min to eat. Extensions of 10 min were granted to finish the meal if they ran out of time. All products served were weighed before and after the meal, and intake of each food was recorded (g) and later converted to energy consumed using each food’s energy density (kJ (kcal)).
Behavioural coding analysis
Previous research has highlighted the validity of behavioural coding analysis of video recordings for use in quantifying eating behaviours( Reference Hennequin, Allison and Veyrune 39 ). Video recordings of food intake were coded for oral processing behaviours using specialised behavioural annotation software (ELAN 4.9.1; Max Planck Institute for Psycholinguistics, The Language Archive( Reference Lausberg and Sloetjes 40 )). A coding scheme was developed to record the frequencies of three ‘point’ events (frequency counts of bites, chews and swallows), and duration of a single ‘continuous’ event (total oral exposure time (min)), based on a previous approach( Reference Forde, van Kuijk and Thaler 41 – Reference Ferriday, Bosworth and Godinot 43 ). Using this approach we collected objective oral exposure measures for each food and derived measures to compare eating rates across participants. The time for which food was in the mouth was collected per bite, and cumulated across all bites to produce the total oral exposure time (min), later used to derive mean eating rate by dividing the grams consumed by the total oral exposure time recorded (g/min). Behavioural video coding was completed by a single trained video-coder and later blind-validated by the second trained video-coder through standard reliability measures to achieve an acceptable level of agreement (≥80 %) in line with previously published recommendations( Reference Haidet, Tate and Divirgilio-Thomas 44 ).
Anthropometric measures
Participants were invited to attend a separate test session for anthropometric measurement, which took place either the next day or within a month from the ad libitum buffet task at the same age. These included height, weight, waist and mid-arm circumferences, and triceps, biceps, suprailiac and subscapular skinfold thicknesses. All measures were taken following standard guidelines and using the recommended anatomical landmarks for children in this age group( Reference de Onis, Onyango and Van den Broeck 45 , 46 ). All measurements were taken twice, and a third measurement was taken if the first two measurements differed by >0·5 cm. Some children did not assent to some of the measurements and the sample size for all of these measurements is outlined in the participant flow chart (online Supplementary Material). Height and weight were transformed to BMI z corrected for age and sex according to WHO child growth standards( 47 ) and later used to classify children as healthy weight (BMI z ≤1·96; n 347) or overweight/obese (BMI z >1·96; n 31). For simplicity, overweight/obese children are referred to as ‘overweight’ throughout. Children within the healthy weight group were additionally subdivided into two separate sub-categories to reflect the large variation in their body composition. Children whose BMI z was ≤0 were classified as lower-healthy weight (n 194) and children whose BMI z was >0 but lower than the cut-off point for overweight were classified as upper-healthy weight range (n 153). Skinfold thickness measures were used to calculate a body adiposity index (BA i ) based on the sum of the suprailiac, subscapular, biceps and triceps skinfold thicknesses( Reference Berkowitz, Moore and Faith 32 , Reference Nightingale, Rudnicka and Owen 48 ). Waist and mid-arm circumferences were used in the analyses as non-normalised continuous variables.
MRI scan for abdominal adiposity
Magnetic resonance images of the abdomen were obtained for a subset of 158 participants from a 3T MR scanner (Siemens Skyra, VE11A). In all, sixty axial slices with a 5 mm slice thickness and in-plane resolution of 0·94×0·94 mm were acquired using a water-suppressed half-Fourier-acquired single-shot turbo spin echo (HASTE) sequence (repetition time=1000 ms, echo time=95 ms) and body matrix coil. A fully automated graph theoretic segmentation algorithm was used to segment and quantify the subcutaneous adipose tissue (SAT) and visceral adipose tissue (VA) compartments between the top of the liver and the top of the sacrum( Reference Sadananthan, Prakash and Leow 49 ). The first step of the algorithm employs intensity-thresholding to remove non-fat tissues from the fat tissues and create the fat mask. The mask is then classified into SAT and VA compartments using graph cuts. The resultant output images are then edited manually to remove bowel contents, stomach, spleen, liver, sternum, vertebral body, gall bladder and pelvic bones that get misclassified as fat because of their bright appearance in the image. The number of voxels in SAT and VA were summed and multiplied by the resolution to get the fat volumes.
Statistical analysis
The cumulative frequency of food choice from the ad libitum buffet was compared across the group and showed that all foods were chosen with similar frequency, with the exception of apples and maize, which were chosen with lower frequency. The frequency of foods chosen was compared within the cohort across healthy and overweight children, and faster and slower eaters (χ 2 analysis). A correlation analysis (Pearson’s r) was conducted to test the first prediction that children who eat faster consume more energy content during the meal. This same analysis was then repeated in a two-step regression, adjusting for the control variables, as initial descriptive statistics revealed some variations in eating rate by sex and ethnicity. Sex and ethnicity were then controlled in all subsequent analyses. Some children ate for longer than others during the lunchtime meal, and it was necessary to test that the relationship between eating rate and energy intake was independent of the duration of eating. Children were subdivided into four eating-time quartiles based on active mealtime duration. Moderated regression with simple slopes analysis was conducted to confirm that eating rate was positively linked with energy intake independently of eating duration. Eating rate values were centred for the purpose of simple slopes analysis.
Further analyses compared group differences between the faster and slower eaters. A median split was used to group children into slower (n 192) and faster eating groups (n 194), based on their eating rates. Comparison of the food choices among slower and faster eaters showed no significant trends in the frequency with which individual food items or drinks were chosen (P>0·2). There were no significant differences in energy intakes from liquids between slower and faster eaters (P=0·44), so comparison of energy intakes were based on the intake of solid foods only. ANOVA was then used to analyse adjusted group differences between the slower and faster eaters in energy intake, BMI z , anthropometric measures and abdominal adiposity measured using MRI scanning, while controlling for sex and ethnicity.
A mediation model was used to test the third prediction that the association between children’s BMI z and energy intake during a meal is partially explained by the children’s eating rate. In the mediation analysis, direct links between BMI z and energy intake and indirect associations of BMI z and energy intake within the meal through eating rate were compared. The size of the indirect effect and 95 % bootstrapped CI were used as an index of successful mediation. This was additionally confirmed using the Sobel test to determine the significance (using α level of P<0·05) and magnitude of the mediation effectReference Hayes (50) . Two-tailed tests were used in all analyses and P<0·05 was considered statistically significant. All statistical analyses were performed in SPSS version 23.0 (IBM).
Results
Food choice from the ad libitum buffet
Children were free to choose from any of the nine food items served and at a group level chose all foods with similar frequency, with the exception of apples and maize which were chosen less frequently. Overweight and healthy-weight children did not differ in the frequency of the foods they chose (χ 2≤1·5, P>0·10) or in the variety (number) of foods consumed (t 0·49, P=0·62). Children who ate faster consumed a slightly larger variety of foods (Δ0·5 food item; t 3·55, P<0·001) and chose most foods more frequently, and some significantly more frequently (maize, nuggets, apple and cheese) though these differences in choice were not biased towards foods with higher energy density (χ 2≥4·2, P<0·001). Children who ate at a slower rate selected Honey Stars more frequently (χ 2=36·7, P<0·001). Differences in energy intake were therefore not driven by selection frequency of individual food items. Comparison of the eating rates of the different foods demonstrated that seven of the nine foods in the sample were consumed at a similar rate (range: 9·7–11·6 g/min), while Honey Stars were consumed at a slightly slower rate (5·8 g/min) and cheese at a slightly faster rate (15·08 g/min). Foods consumed slightly slower and slightly faster were of similar energy density (3·8 v. 2·95, respectively).
Eating rate and ad libitum energy intake
Our first aim was to examine whether children who eat at a faster rate consume more energy during an ad libitum meal. The mean eating rate in the sample was 6·9 (sd 3·2) g/min and mean energy consumed during the meal was 1010·0 (sd 551·9) kJ (241·4 (sd 131·9) kcal). Children who ate faster consumed more energy, with a strong linear association between eating rate and energy consumed (r 0·61, P<0·001; Fig. 1). Post hoc power analysis (G*Power 3.1) using exact data distribution in a bivariate normal model with assumed α error probability of 0·05 revealed that the achieved power to detect this effect was 1·0. R 2 obtained in this analysis lay outside the lower and upper critical r levels (–0·09, 0·09), hence the null hypothesis that there is no relationship between children’s eating rate and energy intake during the meal could be rejected. This relationship remained strong after controlling for the possible effects of sex (β –0·11, P=0·033), ethnicity (β –0·05, P>0·05) and BMI z (β 0·21, P<0·001) in a regression model (β 0·60, P<0·001; R 2 0·39; F 4,373=59·91, P<0·001), highlighting the consistency of this association. These results remained consistent when using alternative measures of eating rate such as kJ/min (kcal/min) or bites/min. This demonstrates that regardless of sex, ethnicity and BMI z , children who ate at a faster rate consumed more energy.
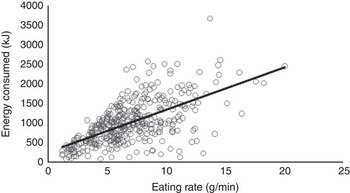
Fig. 1 Relationship between eating rate and energy consumed during lunch (Pearson’s r; P<0·001; n 386).
Children were free to eat for as long as they wanted within the allotted time, and as some children ate for longer than others, it was necessary to test that the relationship between eating rate and energy intake was independent of eating duration. The mean time spent eating was 15·1 (sd 5·1) min, but this varied considerably across the sample, ranging from 2·0–35·1 min. The length of time spent eating was divided into four eating time quartiles from shorter to longer time, and children’s eating rate was compared within each quartile. In a moderated regression analysis, for all children, eating rate was positively linked to energy consumed, independently of meal duration (R 2 0·56; F 7,378=70·93, P<0·001). Fig. 2 shows the positive relationship between eating rate and energy consumed among children in each of the four eating time quartiles. The simple slopes analysis confirmed that children who ate faster consumed more energy within each of the active eating time quartiles.
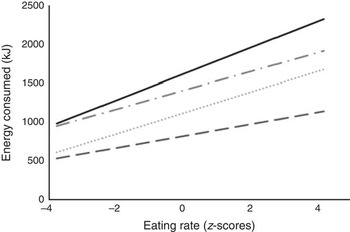
Fig. 2 Simple slopes analysis representing the moderating effects of time spent eating on the relationship between eating rate (z-scores) and energy consumed during lunch (n 386). The four groups represent active mealtime quartiles from 1 (shortest time spent eating) to 4 (longest time spent eating). The following cut-off points were used: 1 (![]() ) (<11·6 min), 2 (
) (<11·6 min), 2 (![]() ) (11·6<15·01 min), 3 (
) (11·6<15·01 min), 3 (![]() ) (15·01<18·8 min), 4 (
) (15·01<18·8 min), 4 (![]() ) (≥18·8 min). Interaction 1 (β 18·26, P<0·001; 95 % CI 11·11, 25·42). Interaction 2 (β 31·99, P<0·001; 95 % CI 26·98, 37·00). Interaction 3 (β 28·81, P<0·001 95 % CI 21·75, 35·87). Interaction 4 (β 40·18, P<0·001; 95 % CI 26·78, 53·58).
) (≥18·8 min). Interaction 1 (β 18·26, P<0·001; 95 % CI 11·11, 25·42). Interaction 2 (β 31·99, P<0·001; 95 % CI 26·98, 37·00). Interaction 3 (β 28·81, P<0·001 95 % CI 21·75, 35·87). Interaction 4 (β 40·18, P<0·001; 95 % CI 26·78, 53·58).
Differences in energy intake based on faster and slower eating rates
A median split was used to group children into slower (n 192) and faster eaters (n 194) to quantify specific group differences in the eating behaviours measured. Direct comparison of mean eating rates revealed that faster eaters were eating approximately twice as fast (9·33 (sem 0·18) g/min) as the slower eaters (4·43 (sem 0·10) g/min). The faster eating group (1283·48 (sem 41·4) kJ (306·76 (sem 9·9) kcal)) consumed on average 549·99 kJ (131·45 kcal) more than the slower eating group (733·50 (sem 25·48) kJ (175·31 (sem 6·09) kcal)), which equates to 75 % more energy consumed during the meal (F 1,381=121·12, P<0·001; 95 % CI (107·6, 154·4); Fig. 3). Effect-size calculation of differences in energy intake among slower and faster eaters with α error probability of 0·05 revealed a large effect size of d 1·15( Reference Cohen 51 ). Faster eaters consumed more of all served foods (t≥1·8, P<0·006), except for the Honey Stars which showed higher intakes among the slower eaters (t 4·5, P<0·001).
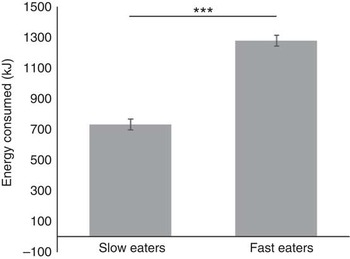
Fig. 3 Energy consumed during lunch by children in the slower and faster eating group. Values are means (adjusted for sex and ethnicity), with standard errors represented by vertical bars (n 386), ***P<0·001.
Comparison of eating rates across healthy-weight and overweight children
Our second aim was to examine the association between eating rate and body composition. Child BMI z increased with children’s eating rate (r 0·20, P<0·001). Specific analysis of group differences between healthy-weight and overweight children (by BMI z ) showed that overweight children ate significantly faster than did the healthy weight children (F 1,371=4·31, P=0·039). When children were further divided into lower-healthy and upper-healthy range of BMI z , there was again a linear increase in eating rate with increase in weight status (F 2,373=5·33, P=0·005), with children in the lower-healthy range of BMI z eating significantly slower than children in the upper healthy (P=0·046) or overweight groups (P=0·008). Group differences are shown in Fig. 4(a) and (b).
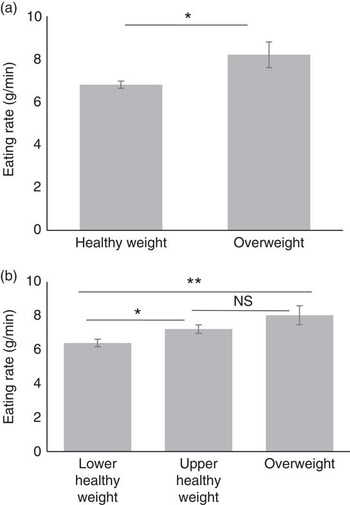
Fig. 4 Group differences in eating rate between children classified as healthy weight (n 347) and overweight (n 31) by BMI status (a) and three groups of children classified as lower (n 194) and upper range (n 153) of healthy weight and overweight (n 31) by BMI status (b). Values are means (adjusted), with standard errors represented by vertical bars. * P<0·05; ** P<0·01.
Relations between eating rates and anthropometric indices of adiposity
There was a positive relationship between eating rate and all anthropometric adiposity indices (Table 1). Examining differences between slower and faster eaters, faster eaters had significantly higher adiposity across all anthropometric measures (Table 1). Adiposity in the biceps and suprailiac region, and the overall BA i showed similar but non-significant trends. These results highlight that those children who ate at faster rates had higher anthropometric indices of adiposity.
Table 1 Relations between eating rate and adiposity indices (Pearson’s r), group differences between slower and faster eaters and group-level summary of the body composition measures, controlled for sex and ethnicity (Mean values and standard deviations; mean values with their standard errors)
BA i , body adiposity index.
* P<0·05; ** P<0·01; *** P<0·001.
Relations between eating rate and MRI measures of abdominal adiposity
MRI scanning for abdominal adiposity was performed on 158 children. The data revealed five outliers with unusually high SAT and/or VA (z>4·0); these children were removed and analyses were completed on a reduced sample (n 153). Comparing faster (n 88) and slower eaters (n 65), faster eaters had 26 % higher SAT volume than did slower eaters (means 571·0 (sem 30·9) v. 452·7 (sem 35·8) cc; F 1,148=6·14, P=0·014), and a non-significant trend to have higher VA (185·8 (sem 5·6) v. 172·3 (sem 6·5) cc; F 1,148=2·44, P=0·12; 95 % CI (24·0, 212·7); Fig. 5). Effect size calculation of differences in SAT between slower and faster eaters with α error probability of 0·05 revealed small-to-medium effect size (d 0·42)( Reference Cohen 51 ).
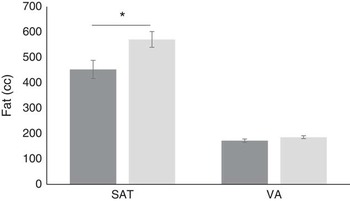
Fig. 5 Differences between slower (![]() ) (n 88) and faster (
) (n 88) and faster (![]() ) eaters (n 65) in subcutaneous adiposity (SAT) and visceral adiposity (VA) in the abdominal area. Values are means, with standard errors represented by vertical bars. * P<0·05.
) eaters (n 65) in subcutaneous adiposity (SAT) and visceral adiposity (VA) in the abdominal area. Values are means, with standard errors represented by vertical bars. * P<0·05.
Mediating effects of eating rate on the relationship between BMI z-score and energy intake
A mediation model was tested which proposes that greater energy intakes occur in the presence of faster eating rates rather than solely as a result of greater BMI z . Mediation analysis showed that there was a weak, non-significant relationship between child BMI z and energy consumed during the meal (direct effect; P=0·072). However, there was an indirect relationship between BMI z and energy intake when children’s eating rate was included in the mediation, indicating a mediating effect of eating rate on the relationship between BMI z and intake. This was supported by 95 % CI 7·48, 21·83, with a medium effect size (ĸ 2=0·14; 95 % BCa CI 0·08, 0·21Reference Preacher and Kelley 52 ). The Sobel test confirmed the statistical significance of this mediation (b 13·58, se 3·34, z 4·06, P<0·001), indicating a significant improvement in the association, and that heavier children tended to eat faster, and faster eating rates were positively linked to increased energy intake. Importantly, the link between BMI z and energy intake was best explained when the child’s eating rate was included as a mediating factor (Fig. 6). This highlights that children with higher BMI z did not necessarily always consume more energy, but they did so when eating at a faster rate. In this regard, greater energy intake occurs in the presence of faster eating rates, rather than strictly as a result of higher body weight and energy needs.
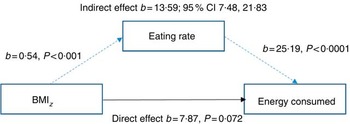
Fig. 6 Model of children’s BMI as a predictor of energy consumed mediated by eating rate (n 378).
Discussion
Children who eat faster had increased ad libitum energy intake, and this was associated with increased BMI z and increased levels of whole-body and abdominal adiposity. Mediation modelling showed that explaining energy consumed during the meal through children’s eating rates led to a stronger association with energy intake, than the direct link between BMI and energy intake in isolation.
These results confirm that faster eating rates were associated with increased energy intake within a meal and demonstrate an association with higher BMI z and adiposity. We found a 2-fold difference in energy content consumed between the slower and the faster eating children, with faster eaters consuming on average 544 kJ (130 kcal) more than the slower eaters. Previous research has demonstrated that slower eating rates occur through smaller bite sizes( Reference Zijlstra, de Wijk and Mars 53 ) and longer chewing times( Reference Fogel, Goh and Fries 26 , Reference Zhu and Hollis 54 ) and have been suggested to enhance the satiating capacity of energy consumed through longer oro-sensory exposure time( Reference de Graaf 55 ). Analyses of the microstructural patterns of eating in children from the current study revealed that children who ate faster did so by taking larger bites that were chewed less and had shorter overall oro-sensory exposure time( Reference Fogel, Goh and Fries 26 ). Longer oro-sensory exposure has dual protective effects against overconsumption by promoting satiation through the earlier termination of eating( Reference de Graaf 56 ) and by increasing inter-meal satiety( Reference Cecil, Francis and Read 57 ). The children in our study were free to consume food for as long as they liked within the allotted time, and we compared eating rates among children who varied in their eating duration. Irrespective of eating duration, children who were eating at a faster rate, consumed significantly more energy and those who ate for the longest duration and at the fastest rate, consumed the most energy. It may be that the children who eat at a faster rate have higher motivation to eat, are more food responsive and may be less sensitive to fullness feelings( Reference Smith, Geiselman and Williamson 58 ). The underlying appetitive traits and motivations that underpin longer and faster eating rates remain unclear, but will be central to a better understanding of the mechanisms behind the obesogenic eating style observed in the current study.
Our study highlights a strong linear relationship between children’s eating rates, energy intake and body composition across a wide range of measurements. This suggests that the higher intake observed among faster-eating children may be indicative of stable and habitual faster eating rates, which support higher energy intake and positive energy balance. At age 4·5 years, children within the upper range of healthy BMI z exhibited eating rates similar to those of overweight children, putting them at risk for future weight gain and indicating a possible role of faster eating rates in the transition from normal weight to overweight and obesity. Among South-Asian populations, measures of BMI z should be considered alongside more detailed adiposity measures, as obesity related metabolic disorders often present at lower BMI z compared with non-Asian populations( Reference Meininger, Brosnan and Eissa 59 , Reference Wulan, Westerterp and Plasqui 60 ). This is particularly the case for the risk of type 2 diabetes, where previous research has highlighted greater insulin insensitivity and higher circulating levels of blood glucose among Asians compared with Caucasians( Reference Dickinson, Colagiuri and Faramus 61 ), and onset of type 2 diabetes occurs at lower ranges of BMI among Asian populations compared with Caucasians( Reference Chiu, Austin and Manuel 62 ). The largest relative differences between the slower and the faster eaters were noted in abdominal SAT with a mean difference of 121 cc. Abdominal adiposity is a risk factor for the metabolic syndrome, type 2 diabetes and other cardiovascular health problems( Reference Wulan, Westerterp and Plasqui 60 , Reference Gishti, Gaillard and Durmus 63 , Reference Sniderman, Bhopal and Prabhakaran 64 ) and as the adipocyte quantity stabilises early in childhood and translates into metabolic risk during adulthood, preventing early childhood weight gain and adipogenesis is key to decreasing future metabolic risk( Reference Spalding, Arner and Westermark 65 ). The relationship between eating rate and fat mass gain is not well understood, although results from animal studies offer potential clues on the mechanisms linking faster eating rates to fat accumulation. Rodent studies on eating rate suggest that a faster eating rate may increase glucose response and over time induce problems with glucose metabolism and fat accumulation( Reference Bae, Hasegawa and Akieda-Asai 66 ). A faster eating rate and shorter oro-sensory exposure time also decreases postprandial thermogenesis and promotes white adipose tissue accumulation( Reference Oka, Sakuarae and Fujise 67 ). Recent human studies provide further support for metabolic effects of eating rate, with increased postprandial thermogenesis among slower eaters( Reference Hamada, Kashima and Hayashi 68 ).
When describing the relationship between eating rate, energy intake and body composition, it is necessary to consider the directionality of the findings. The current data reflect eating rate measured on a single occasion, therefore, it is not possible to confirm whether faster eating rates are causing weight gain, or whether higher weight and adiposity levels encourage faster eating rates to increase energy intake and sustain higher energy needs. Longitudinal research with measures of eating rate, energy intake and body composition over time are needed to further explore the likely direction of the relationship between the rate of eating, energy intakes and the later risk of excess weight gain and adiposity. Previous research has described faster eating as a heritable trait( Reference Llewellyn, van Jaarsveld and Boniface 23 ) that can be identified in the initial months of life( Reference Llewellyn, van Jaarsveld and Johnson 6 , Reference Agras, Kraemer and Berkowitz 29 ). In line with Behavioural Susceptibility Theory, both genetic and environmental factors shape early eating behaviours and appetitive traits, and may emerge across a range of different food-related behaviours such as selecting larger portions, plate-cleaning behaviours and faster eating rates( Reference Birch and Fisher 69 ). There is also a strong learned component to the development of stable eating behaviours and appetitive traits, and children’s trajectory of learning to eat is influenced by their early experiences with food and the family feeding environment. Feeding practices such as breast-feeding( Reference Viggiano, Fasano and Monaco 70 ) and the timing of complementary food introduction( Reference Coulthard, Harris and Emmett 71 ) may interact with genetic risk to influence food texture acceptance, orofacial muscle development and oral stamina( Reference Wang and Ge 72 ). Parental feeding practices such as verbal or physical prompting to eat during a meal have also been linked to promoting faster eating rates and higher energy intakes and may influence overweight and healthy weight children differently( Reference Drucker, Hammer and Agras 73 ). In addition, early life experiences with food textures and feeding practices may influence food preferences and late introduction of food textures may lead to a later aversion to harder foods( Reference Coulthard, Harris and Emmett 74 ), and through this may encourage selection of softer foods that can be consumed at a faster rate.
Eating rate has been identified as a modifiable risk factor for childhood obesity and a potential target for behavioural intervention( Reference Ford, Bergh and Södersten 75 ). Children who eat quickly may naturally have a higher rate of eating, but can also avoid selecting foods that require extensive mastication and can be consumed at a higher rate. Children’s eating rate can be reduced through the use of external timing prompts, and eating rate monitors( Reference Salazar Vázquez, Vázquez and López Gutiérrez 76 , Reference Hamilton-Shield, Goodred and Powell 77 ), which have been shown to successfully reduce eating rate and support successful weight loss in adults and children( Reference Ford, Bergh and Södersten 75 – Reference Ferster, Nurnberger and Levitt 78 ). Rather than relying on external cues to prompt eating rate changes, a more natural strategy for long-term sustainable reductions in eating rate would be to promote smaller bites and longer chewing cycles through modified food textures or serving utensils. Previous research with adults has demonstrated food influences on eating rate( Reference Forde, van Kuijk and Thaler 41 , Reference Ferriday, Bosworth and Godinot 43 , Reference Forde, Leong and Chia 79 , Reference Viskaal-van Dongen, Kok and de Graaf 80 ) and the impact of substituting equally liked food textures within a meal to promote changes in eating rate and reduce overall energy intake( Reference Bolhuis, Forde and Cheng 42 , Reference Forde, van Kuijk and Thaler 81 ). To date, no study has demonstrated the efficacy of a food texture intervention to slower eating rates and reducing energy intake and body weight in children.
The current study surveyed a large representative sample of children, with extensive body composition measures and objective measures of eating behaviours conducted in controlled laboratory setting. However, a limitation of the study was the measurement of eating rate on one meal occasion in a laboratory setting and the modest sample of overweight children by BMI z classification, although this is consistent with national childhood overweight rates for Singapore( Reference Wulan, Westerterp and Plasqui 60 ). To determine whether faster eating rates are playing a causal role in weight gain and adiposity, future studies will need to explore the stability of eating behaviours longitudinally among the same children, and the impact of faster eating on energy intake, body weight and adiposity over time. Moreover, a better understanding of the causes and eating patterns that reinforce faster eating rates will help guide the development of effective strategies to combat the early emergence of this ‘obesogenic’ eating behaviourReference Fogel, Goh and Fries (26) .
Conclusions
Children who ate at a faster rate had increased ad libitum energy intake, and this was associated with increased BMI z and increased levels of whole body and abdominal adiposity. Future research is needed to confirm the stability of these behaviours and their impact on body composition overtime, and a better understanding of the appetitive traits and eating patterns that promote faster eating rates is necessary for the development of approaches to slow down and reduce energy intake.
Acknowledgements
The authors acknowledge the contributions of the study participants, the GUSTO study group and all clinical and home-visit staff involved. The GUSTO study group includes Pratibha Agarwal, Arijit Biswas, Choon Looi Bong, B. F. P. B., Shirong Cai, Jerry Kok Yen Chan, Yiong Huak Chan, Cornelia Yin Ing Chee, Helen Y. H. Chen, Yin Bun Cheung, Audrey Chia, Amutha Chinnadurai, Chai Kiat Chng, Shang Chee Chong, Mei Chien Chua, Chun Ming Ding, Eric Andrew Finkelstein, Doris Fok, M. V. F., Anne Eng Neo Goh, Yam Thiam Daniel Goh, Joshua J. Gooley, Wee Meng Han, Mark Hanson, Christiani Jeyakumar Henry, Joanna D. Holbrook, Chin-Ying Hsu, Hazel Inskip, Jeevesh Kapur, Ivy Yee-Man Lau, Bee Wah Lee, Y. S. L., Ngee Lek, Sok Bee Lim, Yen-Ling Low, Iliana Magiati, Lourdes Mary Daniel, M. J. M., Cheryl Ngo, Krishnamoorthy Naiduvaje, Wei Wei Pang, Anqi Qiu, Boon Long Quah, Victor Samuel Rajadurai, Mary Rauff, Salome A. Rebello, Jenny L. Richmond, Anne Rifkin-Graboi, Lynette Pei-Chi Shek, Allan Sheppard, Borys Shuter, Leher Singh, Shu-E Soh, Walter Stunkel, Lin Lin Su, K. H. T., Oon Hoe Teoh, Mya Thway Tint, Hugo P S van Bever, Rob M. van Dam, Inez Bik Yun Wong, P. C. Wong, F. Y., George Seow Heong Yeo.
This work is supported by the Translational Clinical Research Flagship Program on Developmental Pathways to Metabolic Disease funded by the National Research Foundation and administered by the National Medical Research Council, Singapore (NMRC/TCR/004-NUS/2008). Additional funding is provided by the Singapore Institute for Clinical Sciences, A*STAR and Nestec SA. K. M. G. is supported by the National Institute for Health Research (NIHR) through the NIHR Southampton Biomedical Research Centre and by the European Union’s Seventh Framework Programme (FP7/2007-2013), project Early Nutrition under grant agreement no. 289346.
This study was conceived and designed by C. G. F., A. F., M. F. F. C. and L. R. F. Clinical analyses were performed by S. A. S., S. S. V, A. F., A. T. G., and C. G. F. A. F. and C. G. F. prepared the draft manuscript and carried out data analysis and interpretation and all authors reviewed and approved the final draft. This study was given ethical approval by ethical review boards of the KK Women’s and Children’s Hospital and National University Hospital in Singapore.
K. M. G., Y. S. L. and Y.-S. C. have received reimbursement for speaking at conferences sponsored by companies selling nutritional products. They are part of an academic consortium that has received research funding from Abbott Nutrition, Nestec and Danone. Lisa Fries is an employee of Nestec SA, working at the Nestlé Research Center. The other authors have no financial or personal conflict of interests.
Supplementary material
For supplementary material/s referred to in this article, please visit https://doi.org/10.1017/S0007114517000848


