


It has been predicted that by the year 2020 depression will be the second leading cause of burden on society among all diseases worldwide( Reference Murray and Lopez 1 ). It has been suggested that the increasing prevalence of mental disorders over recent decades might be attributed to lifestyle factors( Reference Sarris, O’Neil and Coulson 2 ). The effect of carbohydrate nutrition on health outcomes and disease has increasingly been the recent focus of research( Reference Gopinath, Flood and Kifley 3 ). However, the link between the various aspects of carbohydrate nutrition and mental health outcomes in adults remains unclear.
Some carbohydrate-rich foods have less of an effect than others to increase blood glucose( Reference Sacks, Carey and Anderson 4 ). This property of individual foods is called the ‘glycaemic index (GI)’, a measure of carbohydrate quality( Reference Sacks, Carey and Anderson 4 – Reference Levitan, Mittleman and Hakansson 6 ). Dietary glycaemic load (GL) is the product of a food’s GI and total available carbohydrate content, and represents both the quantity and the quality of carbohydrates – that is, the total glycaemic impact of a portion of the food( Reference Gopinath, Flood and Kifley 3 , Reference Jenkins, Kendall and Augustin 7 , Reference Schaumberg, Liu and Seddon 8 ). Moreover, other aspects of carbohydrate quality, such as intakes of sugary foods and dietary fibre, are also thought to influence various health outcomes. Recent studies have tried to clarify whether some of these carbohydrate nutrition variables influence mental disorders. A recent cross-sectional study of Iranian adults( Reference Haghighatdoost, Azadbakht and Keshteli 9 ) found that there was a positive association between dietary GI intake and depression, but an inverse link between GL and mental disorders, depression and psychological distress. Similarly, cross-sectional analysis of a US cohort of homebound older adults found that dietary GI intake was positively associated with depression( Reference Mwamburi, Liebson and Folstein 10 ). A cross-sectional Spanish study of institutionalised older adults( Reference Aparicio, Robles and Lopez-Sobaler 11 ) found an inverse link between dietary GL and prevalence of depression. Finally, one of the few longitudinal studies to assess the association between carbohydrate nutrition and depression was a US cohort study of postmenopausal women, which showed that higher GI and sugar intake were associated with an increased risk of incident depression. Conversely, higher consumption of fibre, fruits and vegetables was associated with lower risk of depression in this study( Reference Gangwisch, Hale and Garcia 12 ).
Given the equivocal nature of the findings on the relationship between carbohydrate nutrition and mental health in older adults, the aim of the present study was to clarify the independent association of various aspects of carbohydrate nutrition (total dietary carbohydrate, GI, GL, fibre from different food sources and total sugars) and the major carbohydrate-containing food groups (fruits, vegetables and breads/cereals) with the prevalence of depressive symptoms using a large, population-based data set.
Methods
Study population
The Blue Mountains Eye Study (BMES) is a population-based cohort study of common eye diseases and other health outcomes in a suburban Australian population located west of Sydney. Study methods and procedures have been described elsewhere( Reference Attebo, Mitchell and Smith 13 ). Baseline examinations of 3654 residents aged >49 years were conducted during 1992–1994 (BMES-1, 82·4 % participation rate). Surviving baseline participants were invited to attend examinations after 5 (1997–1999, BMES-2), 10 (2002–2004, BMES-3) and 15 years (2007–2009, BMES-4) at which 2334 (75·1 % of survivors), 1952 (75·6 % of survivors) and 1149 participants (55·4 % of survivors) were re-examined, respectively, with complete data. The University of Sydney and the Western Sydney Area Human Ethics Committees approved the study, and written informed consent was obtained from all participants at each examination. All study methods were performed in accordance with the approved guidelines.
Nutritional assessment
Dietary data were collected using a 145-item, self-administered FFQ, modified for Australian diet and vernacular from an early Willett FFQ( Reference Willett, Sampson and Browne 14 ), including reference portion sizes. Participants used a nine-category frequency scale to indicate the usual frequency of consuming individual food items during the past year. This FFQ included questions about the types of breakfast cereals consumed, which were used to increase the accuracy of the GI calculations. The FFQ showed reasonable agreement for carbohydrates and GI, yielding correlation coefficients of 0·55 and 0·57, respectively, and correctly classifying nearly 80 % of participants within one quintile for carbohydrate intake and 74 % participants within one quintile for GI, in a subset of participants who had completed 12 d of weighed food records over three seasons( Reference Barclay, Flood and Brand-Miller 15 , Reference Smith, Mitchell and Reay 16 ).
A dietitian coded data from the FFQ into a customised database that incorporated the Australian Tables of Food Composition 1995 (NUTTAB 95) and published GI values with the scale of glucose=100( Reference Foster-Powell, Holt and Brand-Miller 17 ). Additional GI data were obtained from the Sydney University GI Research Service online database( 18 ). In total, 88·9 % of GI values were obtained from published values and 11·1 % were interpolated from those of similar food items( Reference Barclay, Flood and Brand-Miller 15 ).
An overall GI value for each participant’s diet was calculated by summating the weighted GI of individual foods in the diet. The weighting was proportional to the contribution of individual foods to total available carbohydrate intake. The GL of each food was calculated by multiplying its GI by the amount of available carbohydrate (g) per serving. Multiplication of each food’s GL by frequency of consumption, summated for all food items, gave the overall dietary GL. We calculated data on total fibre intake as well as the fibre contribution from cereals, vegetables and fruits. Rolled oats and whole-grain/wholemeal bread consumption contributed predominantly to the total cereal fibre intake, that is, 46·9 %. Finally, we analysed the consumption of main carbohydrate-containing food groups: vegetables, fruit, bread and cereals (comprising breakfast cereals, bread (white or other), pasta and rice).
Assessment of depressive symptoms
The Mental Health Index (MHI) component of the 36-Item Short-Form Survey (which is used to determine health-related quality of life) was administered at BMES-2 and consists of five questions regarding nervousness, happiness and low mood, feeling down, and feeling calm or peaceful. Scores were calculated as the sum of questions one to five multiplied by 25 and the result was divided by 100, that is, ∑(MH1–MH5)×25/100. Items MH3 and MH5 were coded in a reverse manner to MH1, MH2 and MH4. A cut-off score of ≤59 out of a total of 100 was used to define persons with significant depressive symptoms( Reference Friedman, Heisel and Delavan 19 ) or those who used antidepressant medications.
The ten-item version of the Center for Epidemiologic Studies Depression (CES-D-10) Scale measures depressive feelings and behaviours experienced during the past week( Reference Andresen, Malmgren and Carter 20 ) and was administered at BMES-3. This modified scale has been validated in older samples and found reliable( Reference Irwin, Artin and Oxman 21 ). Measurement properties of the CES-D-10 have shown satisfactory test–re-test correlation and good predictive accuracy compared with the standard twenty-item CES-D version( Reference Andresen, Malmgren and Carter 20 ). Questions focused on mood (five items), irritability (one item), energy (two items), concentration (one item) and sleep (one item). Each of the ten items was coded on a scale of 0–3 to give a maximum of 30 points. Items 5 and 8 were coded in a reverse manner to the remaining eight items of the CES-D-10 scale. Higher scores indicate a greater burden of depressive symptoms. A cut-off score of ≥10 out of a total possible score of 30 was used to define participants with significant depressive symptoms( Reference Andresen, Malmgren and Carter 20 ) or use of antidepressant medications.
Assessment of covariates
A face-to-face interview with trained interviewers was conducted, and comprehensive data including information about medical histories, hearing, demographic factors, socio-economic characteristics, lifestyle and health risk behaviour such as exercise, and smoking were obtained from all participants. Participants were also asked whether they received a pension, and if so the type of pension they were receiving, for example, age, disability, veteran’s or blind. Medical histories included CVD or other systemic disease and associated risk factors and medications used. A past history of angina, diabetes, myocardial infarction and stroke was determined by responses to a question: ‘Has a doctor advised you that you have any of the following conditions?’. Walking difficulty or use of a cane, walker or wheelchair was observed by a trained examiner and categorised as ‘disability in walking’. Cognitive function was assessed using the mini-mental state exam (MMSE) administered at both the baseline and the follow-up visits. MMSE scores ranged from 0 to 30( Reference Folstein, Folstein and McHugh 22 ), with scores <24 indicating cognitive impairment.
Statistical analysis
SAS 9.2 software (SAS Institute) was used for statistical analyses including t tests, χ 2 tests and logistic regression. Study factors were carbohydrate nutrition (total carbohydrates, GI, GL, sugars and fibre), and the study outcome was the prevalence of depressive symptoms as assessed by the MHI or CES-D-10 scale. Carbohydrate nutrition variables were analysed as categorical variables (tertiles). Carbohydrate nutrition variables were energy adjusted using the residual method described by Willett & Stampfer( Reference Willett and Stampfer 23 ). Multivariable logistic regression models adjusted for age, sex, cognitive impairment (MMSE <24), walking disability, receiving pension, antidepressant use, previous history of stroke and arthritis were used. The logistic regression analyses are expressed as adjusted OR and 95 % CI. Statistical significance was defined as P<0·05.
Results
Carbohydrate nutrition and depressive symptoms as assessed by the Mental Health Index scale
At BMES-2 of the 2334 participants examined, 1918 had complete information on dietary intakes, MHI scale scores and antidepressant medication use, and hence were included in the cross-sectional analysis. Of the 1918, 275 (14·3 %) had depressive symptoms. Participants with depressive symptoms compared with those without were more likely to be female, receive pension, have a walking disability and cognitive impairment, as well as have higher intakes of dietary GI and GL (online Supplementary Table S1). Table 1 shows the association between tertiles of carbohydrate nutrition variables and prevalence of depressive symptoms. After multivariable adjustment, participants in the highest tertile compared with the lowest tertile (reference group) of dietary GI intake had a 55 % higher likelihood of having depressive symptoms (Table 1). Dietary intake of fibre was not associated with the prevalence of depressive symptoms (Table 2). In terms of food group consumption, the only one that showed a significant association with prevalence of depressive symptoms was fruit consumption, comparing the highest v. first tertile of fruit consumption, multivariable-adjusted OR 0·64 (95 % CI 0·46, 0·89); global P=0·04. Vegetable and breads/cereal consumption was not associated with the prevalence of depressive symptoms (data not shown).
Table 1 Association between carbohydrate nutrition and prevalence of depressive symptoms as assessed by the Mental Health Index scale and antidepressant use (Odds ratios and 95 % confidence intervals)

GI, glycaemic index; Ref., referent values; GL, glycaemic load.
* Adjusted for age, sex, cognitive impairment (mini-mental state exam <24), walking disability, receiving pension, antidepressant use, previous history of stroke and arthritis.
Table 2 Associations between baseline intakes of energy-adjusted dietary fibre and prevalence of depressive symptoms assessed by the Mental Health Index scale (Odds ratios and 95 % confidence intervals)
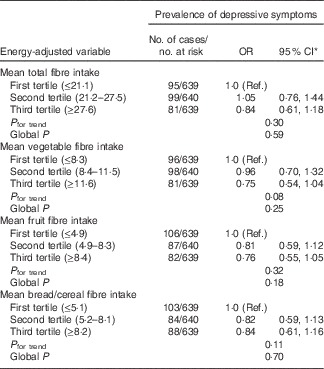
Ref., referent values.
* Adjusted for age, sex, cognitive impairment (mini-mental state exam <24), walking disability, receiving pension, antidepressant use, previous history of stroke and arthritis.
Carbohydrate nutrition and depressive symptoms as assessed by the Center for Epidemiologic Studies Depression-10 scale
Depressive symptoms as assessed by the CES-D-10 scale were only available at BMES-3 onwards; hence, of the 1952 participants examined at BMES-3, 1504 had complete information on dietary intakes and CES-D-10 scores, and therefore were included in subsequent cross-sectional analyses. Of the 1504, 249 (16·6 %) had depressive symptoms. Participants with compared with those without depressive symptoms were more likely to be female, receive pension, take antidepressants, have a walking disability, stroke, arthritis and cognitive impairment, as well as lower intake of breads/cereal fibre (online Supplementary Table S2).
Table 3 shows no significant associations between the dietary intakes of GI, GL and total carbohydrates and prevalence of depressive symptoms. However, we found that participants in the second v. first tertile of total fibre intake and vegetable fibre intake had a 42 and 46 % reduced likelihood of having depressive symptoms, respectively (Table 4). In addition, those in the highest compared with the lowest tertile of bread/cereal fibre intake had 42 % reduced odds of depressive symptoms as assessed by the CES-D-10 scale, multivariable-adjusted OR 0·58 (95 % CI 0·39, 0·86). With regard to food groups, the only significant association observed was with vegetable consumption. Participants in the second tertile compared with those in the first tertile of vegetable consumption had 41 % reduced odds of prevalent depressive symptoms, multivariable-adjusted OR 0·59 (95 % CI 0·40, 0·88); global P=0·02.
Table 3 Association between carbohydrate nutrition and prevalence of depressive symptoms as assessed by the Center for Epidemiologic Studies Depression-10 scale (Odds ratios and 95 % confidence intervals)

GI, glycaemic index; Ref., referent values; GL, glycaemic load.
* Adjusted for age, sex, energy intake, cognitive impairment (mini-mental state exam <24), walking disability, receiving pension, antidepressant use, previous history of stroke and arthritis.
Table 4 Associations between intakes of energy-adjusted dietary fibre and prevalence of depressive symptoms as assessed by the Center for Epidemiologic Studies Depression-10 scale (Odds ratios and 95 % confidence intervals)
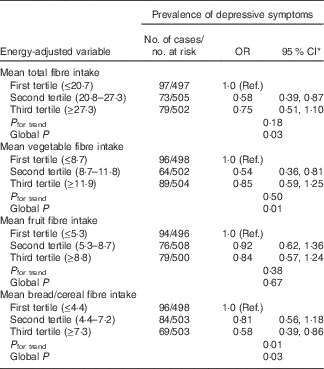
Ref., referent values.
* Adjusted for age, sex, energy intake, cognitive impairment (mini-mental state exam <24), walking disability, receiving pension, antidepressant use, previous history of stroke and arthritis.
Discussion
Our study findings contribute to the existing evidence base, which suggests that carbohydrate nutrition variables could be linked to the presence of depressive symptoms. Cross-sectional analysis showed that participants in the highest tertile of dietary GI intake compared with those in the lowest tertile had 55 % increased likelihood of having depressive symptoms as assessed by the MHI scale and antidepressant use. Moreover, we found that total fibre, vegetable fibre and breads/cereals fibre intakes were inversely associated with the prevalence of depressive symptoms as assessed by the CES-D-10 scale. Consumption of vegetables and fruits appeared to have a modest, beneficial influence on the prevalence of depressive symptoms.
The independent association between higher dietary GI intake and greater odds of depressive symptoms observed in our cohort of older adults concurs with other epidemiological studies, which suggest that high-GI diets could be a risk factor for depression( Reference Haghighatdoost, Azadbakht and Keshteli 9 , Reference Mwamburi, Liebson and Folstein 10 , Reference Gangwisch, Hale and Garcia 12 ). Given that this is an observational study, we were not able to determine the pathways by which dietary GI could influence mental well-being; however, we can hypothesise potential mechanisms. First, greater inflammation as a result of higher-GI intake has already been established( Reference Buyken, Goletzke and Joslowski 24 ), and increased inflammation has also been suggested as a mechanism for depression( Reference Han and Yu 25 ). Second, high-GI diets could also lead to insulin resistance( Reference Willett, Manson and Liu 26 ), which has been associated with a pattern of volumetric and neurocognitive deficits, which are very similar to that found in individuals suffering from clinical depression( Reference Gangwisch, Hale and Garcia 12 , Reference McIntyre, Kenna and Nguyen 27 ).
Conversely, dietary fibre intake was inversely associated with odds of depressive symptoms. Further, higher consumption of fruits and vegetables was also associated with a lower likelihood of depressive symptoms in older adults. Together, our findings confirm those of the recent US study on postmenopausal women, which found that higher consumption of fibre and vegetables was associated with lower odds of incident depression( Reference Gangwisch, Hale and Garcia 12 ). As inflammation has a potential role in depression( Reference Han and Yu 25 ), the protective effect of dietary fibre on mental health could be partly attributed to the avoidance of postprandial hyperglycaemic peaks( Reference Qi and Hu 28 ), because recurrent postprandial hyperglycaemia leads to overproduction of reactive free radical molecules and greater release of inflammatory cytokines( Reference Qi and Hu 28 – Reference Buyken, Flood and Empson 30 ). In addition, older adults with higher consumption of dietary fibre are also likely to be consuming higher amounts of nutrients that are important for a healthy nervous system, which therefore has a beneficial influence on mental health status( Reference Haghighatdoost, Azadbakht and Keshteli 9 ). Moreover, vegetables have low GI and this attribute could explain its consumption being inversely associated with the prevalence of depressive symptoms in older adults.
Our observation that total carbohydrate and total sugar intakes are not associated with depressive symptoms is in line with a US study on women, which also found non-significant links between carbohydrate and total sugar intake and risk of depression( Reference Gangwisch, Hale and Garcia 12 ). The authors of that study hypothesised that this could be due to dietary total sugars comprising a combination of various types of sugars and sugar from different sources( Reference Gangwisch, Hale and Garcia 12 ) and that the food source of sugar influences the GI, with higher fibre content slowing carbohydrate metabolisms and lowering the GI( Reference Gangwisch, Hale and Garcia 12 ). It is also interesting to note that we observed varying associations with the different carbohydrate nutrition variables based on whether depressive symptoms were assessed by the MHI or the CES-D-10 scale. Although there is a moderately high correlation between MHI and CES-D-10 scores( Reference Gopinath, Wang and Schneider 31 ), it has been suggested that both instruments are likely to measure different aspects of mental health, that is, the MHI scale is a measure of psychological distress, whereas the CES-D-10 scale is a measure of current depressive symptoms. Hence, this could explain the differential observations with dietary GI and fibre intake. However, these findings could be due to chance and require validation by other population-based studies.
Strengths of our study are many, including use of a validated food questionnaire to collect dietary information and other questionnaires that permitted detailed assessment of potential confounding variables, as well as a relatively high participation rate. Nevertheless, there are limitations that need to be discussed. First, there is potential for misclassification because information on dietary intake was collected by self-report. Although random within-person variation could attenuate any true association, the FFQ was designed to minimise this error by assessing average long-term consumption during the successive follow-up period( Reference Tsai, Leitzmann and Willett 32 ). These repeated measurements take into account possible changes in diet with time and reduce random variation in reporting. Second, we used the CES-D-10 and MHI scales to assess depressive symptoms, which are screening tools only and not diagnostic tools for clinical depression, such as Diagnostic and Statistical Manual of Mental Disorders, 4th Edition (DSM-IV) criteria. Finally, we have attempted to adjust for a large number of confounding variables in the analyses; however, as with all observational studies, we cannot rule out the possibility that residual confounding (from unmeasured or unaccounted factors) could have influenced the analyses.
In conclusion, we found that carbohydrate nutrition variables such as dietary fibre showed a modest association with the prevalence of depressive symptoms. Given that depression is acknowledged as an important public health problem, it is important that the association between carbohydrate nutrition and mental health status in older adults is explored further, and randomised trials are needed in the future to examine whether changes to dietary GI and/or fibre content of an individual’s diet could be an effective preventative strategy for depression in later life.
Acknowledgements
The Blue Mountains Eye Study was funded by the Australian National Health and Medical Research Council (grant nos 974159, 991407, 211069, 262120) and Westmead Institute. None of the funders had any role in the design, analysis or writing of this article.
The authors’ responsibilities were as follows – B. G. and P. M.: study concept and design; P. M.: acquisition of data; G. B.: analysis of data; B. G., V. M. F., J. C. Y. L. and P. M.: interpretation of data; B. G.: drafting of the manuscript; B. G., V. M. F., J. C. Y. L., G. B. and P. M.: critical revision of the manuscript. All authors read and approved the final manuscript.
None of the authors has any conflicts of interest to declare.
Supplementary material
For supplementary material/s referred to in this article, please visit https://doi.org/10.1017/S0007114516004311


