


Semi-quantitative FFQ are used extensively in epidemiological studies to evaluate food intakes and to explore the diet and associations with specific nutritional profiles, such as the Mediterranean diet(Reference Trichopoulou, Costacou and Bamia1, Reference Mariscal-Arcas, Romaguera and Rivas2). FFQ are relatively easy and inexpensive to administer and can be used to measure dietary intake over a prolonged time period(Reference Cade, Thompson and Burley3, Reference Wakai4). However, because dietary habits vary widely among regions and cultural groups, FFQ must be tailored for use and validated in specific populations(Reference Wakai4–Reference Pakseresht and Sharma6).
No gold standard instrument is available for measuring dietary intake. One approach to the validation of the FFQ is to compare its responses with 3 d diet recall results(Reference Kroke, Klipstein-Grobusch and Voss7–Reference Henn, Fuchs and Moreira10). In these validation studies, an acceptable concordance between the instruments has generally been found for energy or macronutrient intakes but not for micronutrients that do not form part of the daily diet(Reference Willett11–Reference Bountziouka, Bathrellou and Giotopoulou16). In selecting a reference measure for a validation study, the sources of error of the two instruments should be as independent as possible(Reference Willett11, Reference Holmes, Dick and Nelson17). The 24 h recall is not susceptible to the possible misinterpretation of questions in the FFQ, but both instruments share some potential errors, including recall bias and variations in the perception of portion sizes. Nevertheless, multiple-day diet recall is considered an appropriate reference method in FFQ validation studies(Reference Kroke, Klipstein-Grobusch and Voss7, Reference Ortiz-Andrellucchi, Sánchez-Villegas and Doreste-Alonso18, Reference Marisca-Arcas, Caballero-Plasencia and Monteagudo19), and the speed and ease of its administration allow a large number of subjects to be investigated without using excessive resources. Further research is required to improve the methodological approach to this validation process.
The objectives of the present study were to develop and test the repeatability and relative validity of a medium-length semi-quantitative FFQ for measuring the energy and macronutrient intakes of a specific population (Palestinian families in the Hebron area) and to contribute a methodological framework for this procedure. In the event of a successful validation of the instrument, a further objective was to determine the intakes of specific nutrients in the diet of this population and to identify any dietary risk factors for chronic disease.
Experimental methods
Population
The population of interest comprised families living in Hebron and nearby villages in Palestine, recruiting 169 volunteer participants from among female homemakers. After obtaining informed consent for participation in the study, a single researcher gathered data from each participant, using an interviewer-administered questionnaire, on the following variables: sex, age, weight, height, number of family members, number of children, employment, schooling, nutrition-related lifestyle habits (both qualitative and quantitative variables) and dietary behaviour (consumption of breakfast, number of meals per day, special diet, diabetes, calorie restriction, etc.). The FFQ and 3 d diet recall were administered at the same interview (see below).
Development of specific FFQ
Previously, a different group of fifty women from the same region had participated in a preliminary study to determine the food items to include in the FFQ for Palestine. These women were administered 24 h recall questionnaires on three consecutive days (including one non-working day). The data gathered on their daily diet were used to construct an initial FFQ, using a previously established methodology(Reference Mariscal-Arcas, Rivas and Monteagudo20). FFQ results in the same population were subjected to a stepwise multiple regression analysis for each nutrient, with the total nutrient intake as dependent variable(Reference Willett11), in order to select the food items for inclusion in the final FFQ. Nutrients that explained ≥80 % of the between-person variability were included in the final FFQ. Based on these results, the final semi-quantitative FFQ for the Palestinian population, shown in Table 1, included the following food groups: cereals and grain products; starchy roots and tubers; dry grain legumes and legume products; nuts and seeds; vegetables; fruit; sugars, syrups and sweets; meat and poultry; eggs; fish and shellfish; milk and milk products; oils and fats; and beverages. The thirteen food groups contain a total of ninety-eight types of food and the FFQ permits estimation of the consumption of twenty-two nutrients, including energy.
Table 1 Stepwise multiple regression results for selected nutrients, showing the foods included in the FFQ

P < 0·001 for the R2 value of each nutrient.
In both the initial and final FFQ, data were gathered on the consumption or not of an item and the number of times it was consumed per day, week or month during the previous year. The amounts of food consumed were expressed in grams or millilitres or in other common measures, such as a slice, tablespoon or cup, or as standard serving size, modified from European references according to the experience and knowledge of the Palestinian author. Foods were converted to nutrients by using a computer program that included Spanish food tables and FAO food composition tables for the Middle East(21, Reference Murcia-Tomás, Martínez-Tomé and Jiménez-Monreal22). The daily intake of each nutrient was calculated by multiplying the amount reported in the questionnaire by the corresponding value in the food composition tables(Reference Willett11).
Procedure
The 3 d diet recall questionnaire and the final FFQ were administered at home face-to-face by a trained dietitian (M.H.) to the women recruited for the main study. The recall questionnaire covered the previous three days, ensuring that one non-working day was included. According to the application norms, participants were given no advance warning of the day on which it would be presented.
Statistical analysis
The mean and standard deviation for intake of each nutrient were computed for both the FFQ and 3 d diet recall. Stepwise regression models were used to assess the contribution of each food item to the total intake and to determine the between-person variability, with individual food items as independent variables and total nutrient intake as dependent variable. The concordance between the FFQ and 3 d diet recall results (mean of three 24 h diet recalls) was analysed by means of the Wilcoxon signed-rank test, de-attenuated intra-class correlation analysis and the Bland–Altman method(Reference Bland and Altman23), in which the limits of agreement were calculated as the mean difference ± 1·96 (values close to or greater than 95 % = very good compliance). P < 0·05 was considered significant in all tests. The statistical software package SPSS version 15 was used for the statistical analyses.
Results
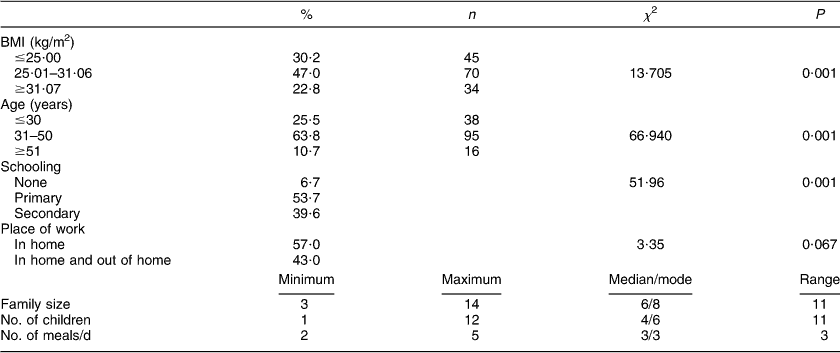
Out of the initial sample of 169 women, twenty (12 %) were excluded for failure to complete the questionnaire or unwillingness to continue in the study, leaving a final study sample of 149 women representing 149 families. The majority of the participants were overweight, were aged between 31 and 50 years, and had only primary schooling. The characteristics of these women are given in Table 2. Slightly more than half of them worked at home as housewives, while 43 % worked both inside and outside the home. Family size ranged from three to fourteen members and the number of children from one to twelve. The median number of meals per day was three (range two to five).
Table 2 Characteristics of the study population: 169 women from Hebron, Palestine
The nutrient intakes estimated from the 3 d diet recall results are given in Table 3, which reports the within-subject CV (among the three 24 h recalls) and the between-subject CV(Reference Willett11). Table 4 and Fig. 1 exhibit the results of Bland–Altman plots for the agreement between the FFQ and the 3 d diet recall, which evidenced a high level of concordance.
Table 3 Within-person (CVw) and between-person (CVb) coefficients of variation in nutrient intakes estimated from the 3 d diet recall (mean of three 24 h diet recalls) among 149 women from Hebron, Palestine

Table 4 FFQ validation: comparison of energy and nutrient intakes estimated by the FFQ and 3 d diet recall (mean of three 24 h diet recalls, 24hR), correlation between the two methods and results of Bland–Altman test of agreement among 149 women from Hebron, Palestine

IQR, interquartile range.

Fig. 1 Bland–Altman plot for FFQ validation: agreement between the semi-quantitative FFQ and the 3 d diet recall (mean of three 24 h diet recalls, 24hR) in estimating (a) energy intake, (b) protein intake, (c) carbohydrate intake and (d) lipid intake among 149 women from Hebron, Palestine. ——— indicates the mean difference; – – – – – indicate the upper and lower limits of agreement
Table 5 shows the mean intakes calculated from the FFQ results and compares them with international recommendations(24). The mean SFA intake was above the recommended daily intake, while deficiencies (<2/3 of the recommended daily intake) were observed in the intakes of vitamin D, folic acid, Ca, Fe and K.
Table 5 Minimum, maximum and mean intakes, and percentages of recommended intake, from FFQ responses among 149 women from Hebron, Palestine

*Percentage of daily intake recommended by the Dietary Guidelines for Americans 2005(24).
Discussion
In the present study, a specifically developed FFQ was validated in a group of mothers from Palestine, using the mean 3 d diet recall results as reference value. In order to capture the intake of nutrients whose consumption varies widely in and among individuals, the mean of multiple-day recalls is often utilized as reference scale for FFQ validation rather than single recall data(Reference Cade, Thompson and Burley3, Reference Hartman, Brown and Palmgren25–Reference Thompson, Subar and Loria27).
The FFQ proposed for this population contained a total of ninety-eight food types in thirteen food groups. These foods correspond to items consumed in the Mediterranean region in general(Reference Mariscal-Arcas, Rivas and Monteagudo20, Reference Trichopoulou, Katsouyanni and Gnardellis28, Reference Mariscal-Arcas, Velasco and Monteagudo29) and in Palestine in particular(21). This FFQ was validated by using the Wilcoxon test to compare its results with those of the 3 d diet recall, finding no significant differences between them in eleven out of the twenty-two nutrients evaluated (energy, protein, total lipids, carbohydrates, fibre, Ca, P, Se, K, Na and vitamin B6), but observing significant differences in the remaining micronutrients. Application of the Bland–Altman test(Reference Bland and Altman23) to compare between the results of the 3 d diet recall and the FFQ showed that only the estimations of Mg, Zn, Fe, vitamins A, E, C and D, thiamin, riboflavin, niacin and folic acid failed to meet the criteria for concordance, which may be attributable to the lower representation of these micronutrients in the diet of this population. Outliers in this analysis ranged from 0 to 5 %. According to these results, the proposed FFQ for the Palestinian population can be considered validated. Table 4 shows the nutrients that are validated in the FFQ (>50 %).
The methodology of our study deserves further comment. Correlation coefficients (r) have been used by some authors to evaluate the concordance between instruments. However, this method can yield the association between two variables but not the degree of agreement; therefore, data with high correlation coefficients may show little concordance. It is therefore recommended to apply other tests, including the Wilcoxon test or Student's t test(30), although it must be borne in mind that a lack of concordance may simply result from an inadequate sample size with these tests. Bland and Altman(Reference Bland and Altman23) proposed establishing the concordance between quantitative instruments by calculating limits of agreement according to the mean (d) and standard deviation of the difference between the measured values. For a normal distribution, the majority of differences should fall between the mean and about 2 sd of the difference variable (d ± 1·96). Generally, this type of distribution is not followed by the measurements themselves, but it is followed by the values of differences. Graphs constructed with the Bland–Altman method permit the investigation of relationships between measurement errors and true values, evaluating the magnitude of disagreement between measurements and identifying outliers.
FFQ and multiple-day recall studies can be considered calibration and correlation rather than validation procedures, given that these methods may share some errors, as noted in the introduction. The use of biomarkers as a reference method is not feasible because there are no markers for many micronutrients and they do not generally offer a good fit with other estimation methods. In the present study, our aim was not to fit questionnaire results to a given nutrient but rather to calibrate a questionnaire for a group of nutrients, i.e. the diet of a specific population. Serra-Majem et al.(Reference Serra-Majem, Bes-Rastrollo and Roman-Vinas31) proposed various criteria for the correct calibration of a nutritional assessment method, including a sample size of 100–200 participants with different characteristics (e.g. age, BMI) from a single region and the use of statistical tests for the validation. These criteria were met in the present study of 169 women from Hebron in Palestine who varied in age and BMI, among other variables. In addition, we applied the Wilcoxon test for comparison of means and de-attenuated intra-class correlation analysis, which is critical to reduce the dependence on inter-individual variations, and we also used the Bland–Altman test to estimate the concordance between quantitative tests. Our study further complied with the above recommendations by gathering data in a face-to-face interview with a trained specialist. Moreover, the 3 d diet recalls covered one non-working day and two working days and were conducted during the same month (August) in two successive years. In their review of 124 validation studies, Serra-Majem et al.(Reference Serra-Majem, Bes-Rastrollo and Roman-Vinas31) assigned quality scores ranging from 0·5 to 6. Based on the same scale, we have estimated a score of about 5 for the present study, considered a very good result. One study limitation was that no data were available to compare the characteristics of participants and non-participants. Moreover, future studies should attempt to recruit a larger number of women.
Application of the proposed FFQ revealed an elevated mean protein intake in this Palestinian population, as reported in the majority of published studies on human groups(Reference Marisca-Arcas, Caballero-Plasencia and Monteagudo19, Reference Mariscal-Arcas, Rivas and Monteagudo20, Reference Serra-Majem, Bes-Rastrollo and Roman-Vinas31), whereas the consumption of Ca, Fe, K, folic acid and vitamin D was deficient (<2/3 of the recommended daily intake), which may be attributable to a reduced intake of dairy products and red meat.
The availability of diet assessment instruments designed for specific populations and cultures is of immense value to researchers and policy makers. The present study describes a simple and effective method to develop and validate an FFQ for a given population of interest.
Acknowledgements
Sources of funding: This study was supported by the Spanish Ministry of Education and Science (FPU Program, R-13-10-2008, PhD fellowship to C.M.), the Spanish Agency for International Development Cooperation (AECID fellowship II-ACV2009/11, BOE-A-2009-14001 to M.H.), the Andalusian Regional Government (Nutrition, Diet, Risks Assessment: AGR255) and the Health Department of Granada City Council (grant no. 2869), Spain. The Spanish Ministry of Education and Science, the Spanish Agency for International Development Cooperation, the Andalusian Regional Government and the Health Department of Granada City Council had no role in the design, analysis or writing of this article. Conflict of interest: The authors state that there are no conflicts of interest. Ethics: The study complied with the guidelines in the Declaration of Helsinki and all procedures were approved by the ethics committees of our institutions (Ethic Committee on Human Research, University of Granada). Authors’ contributions: M.M.-A., J.A.T and F.O.-S. conceived, designed and devised the study; M.H., M.M.-A., C.M., M.L.L.-T. and F.O.-S. collected and supervised the samples, analysed the data and wrote the manuscript; M.M.-A., J.A.T. and F.O.-S. supervised the study; M.H. and F.O.-S. obtained funding. Acknowledgements: The authors thank Richard Davies for editorial assistance.


