


1. Introduction
Investing is an activity in which consumption today is foregone in an attempt to allow greater consumption at a later date. ‘Risk’ is the possibility that this objective won’t be attained.
Warren E. BuffettFootnote 1 , February 2018The Institute and Faculty of Actuaries’ Risk measures working party was initiated with the following Terms of Reference:
to inform discussion of the usefulness of alternative approaches to risk measurement for long-term liability constrained investments, with particular attention as to whether investment strategies might be skewed away from growth assets, to the detriment of long-term gain for customers and may actually increase their risk.
to increase awareness of the possible influence exerted by the use of short term – viz. banking based – risk assessment approaches and their impact on asset allocations in the real economy.
1.1 What risks have been considered?
Investment risk: The possibility that changes in the values of, or income from, assets cause a long-term investor to fail to achieve its goals over its investment horizon.
The categories of long-term investor covered will include those which have liabilities based on some demographic factors and some form of real value or inflation-based guarantees, i.e. a pension fund or insurer with long-term liabilities. Although the background context of industry practices and regulatory aspects originates from a UK perspective, the economic principles are globally applicable.
The focus is on the investor’s long-term investment strategy achieving an optimal economic risk/return payoff, and the numerous challenges in managing stakeholder perceptions, behaviours and actions.
1.2 Research background
The theme of long-term investing is at the core of actuarial science, from its traditional roots in life insurance and pensions, to the present day. In recent years, the advent of the risk-based and market consistent approach of, inter alia, Solvency II (‘SII’) for EEA insurers has emphasised the short horizon over the longer horizon. This paper seeks to consider the appropriateness or otherwise of this short-term-based thinking by taking a fresh look at the fundamental economics underlying long-term investing for insurance and pensions, and some of the constraints and barriers to the practical implementation of ‘alternative’ approaches.
In 2014, the seminal discussion paper Pro-cyclicality and structural trends in investment allocation by insurance companies and pension funds was published by the Bank of England and the Pro-cyclicality Working Group, a joint venture between the IFoA and the Bank of England. This paper looked at the policy issues arising from the trend to short-term investment behaviour by pension funds and life companies, lower equity holdings reflecting reduced willingness to take on risk, and pro-cyclical investing that exacerbates market cycles. All of these factors threaten the security of retirement income and the availability of finance for investment in industry and infrastructure.
The IFoA had a successful seminar on the subject in September 2015 (Expert Panel Pension Funds and Life Companies: Are they Fit for Purpose?) which led to potential areas for future research.
The key issues identified were
marked decline in the willingness of pension funds and insurance companies to take on investment risk, with much lower equity holdings in recent years
significant herding in the way that UK defined benefit pension schemes have been investing
a short-term agenda driven by regulation such as the SII framework
the need for a better understanding of risk; market risk versus investment risk
simpler, more focused institutions that address the structure of the industry and incentives for behaviours
Further details can be viewed on the webpage https://www.actuaries.org.uk/news-and-insights/media-centre/media-releases-and-statements/what-procyclicality.
1.3 The role of long-term investing
In the twenty-first century, the accelerating pace of change seems to create unstoppable pressures for ever-faster processes and transactions. Time horizons for the deployment of cash in securities have shortened. Where silicon has replaced carbon on the trading floors, algorithms trade in a matter of microseconds, and is getting close to the limits of what is possible with known physics (light travels about one foot per nanosecond).
Conversely, creating real economic wealth requires a capital base which is available over sufficient time and depends on an effective allocation of resources, including efficient availability of finance for investment in industry and infrastructure. Since long-term investors comprise the world’s largest asset owners (details in Section 4.1.1), they exert a major impact on the global economy.
1.4 Scope
In this paper we consider the following key areas:
Long-term versus short-term investors/investing
Dimensions of risk: Investment risk versus market risk
Investors and their economic risk capacity
Components of, and approaches to, the measurement of risk
In particular
Section 2 outlines the methodology we have adopted in producing this paper.
Section 3 outlines the findings of our literature review.
In Section 4:
We define the scope of which investors we are considering – as the universe is wide.
For those chosen, we consider what their fundamental economic risks are – by separately considering the investors and their needs and how the universe of available investments meets these needs.
Section 5 considers alternative risk measurement approaches:
Starting with the various aspects that are taken into account in all risk measurement approaches.
Commenting briefly on the use and impact of discounting.
Starting from first principles on how risk measures should be set with reference to the liabilities being provided (i.e. Time horizons of the cash flows or economic asset-liability modelling).
Then considering some different risk measurement approaches (both those currently used and alternative approaches) and how appropriate these are to the risks outlined in Section 4.
1.5 Necessary limitations of coverage
Any paper on the practical aspects of investment risk management can only cover a limited number of selected topics. While acknowledging the reality of the numerous other aspects of the social, political, legal/regulatory, technological, economic and business environment, this paper is not intended to explicitly discuss in any depth details of regulations, pensions funding, considerations such as sponsor covenants and the role of the Pension Protection Fund, UK (‘PPF’), specific details of life insurance/pensions product types, fixed income risk and the impacts of recent monetary policy viz. quantitative easing, pro-cyclicality, herding, macroeconomic risk and systemic risk, the use of hedging strategies and derivative instruments.
More specialist investment topics such as passive versus active investing, growth styles versus value styles, public versus private funding sources, factor investing, algorithmic approaches versus sector and stock selection, details of newer ‘alternative’ investments, and so on are also unfortunately beyond the scope of this paper.
Although the geographical focus of the sections on industry practices and regulatory aspects is on the UK (and not from around the globe), the concepts and principles of long-term investing and shortfall risk are universally applicable to all classes of global long-term investors including individual investors.
2. Methodology
After considering the identified policy issues arising from the trend to short-term investment, the authors decided to first address the need for a better understanding of risk, in particular market risk versus investment risk.
It was considered best to start afresh with the basic fundamental economics, the underlying purposes of long-term investing, what makes financial sense and would most likely be optimal for the ultimate investor, rather than automatically assuming that the recently overarchingly dominant (at least in the UK insurance world) regulatory and accounting rules and conventions were the best approach for business management.
The authors decided to take a practical view rather than focus on theory.
This paper is not intended to be a comprehensive regulatory critique of the Solvency II standard formula Solvency Capital Requirement (‘SCR’) mark to market (‘MTM’) (and equivalents in the pensions domain), but is instead intended to be a broader consideration of risk measurement approaches across different businesses.
The authors present ‘alternative’ perspectives which they consider relevant, some of which were more prominent in actuarial thinking in the past but that have in recent years, in the immediate aftermath of the 2007–2009 global financial crisis trauma, become submerged or been repressed in the wider environment. They deliberately chose to consider perspectives both from across the actuarial profession and independent wider sources.
The objective is not to provide a formulaic ‘full and definitive alternative’ model in all its details or to ‘prove’ anything mathematically, but rather to look at alternative perspectives and approaches in view of overall tendencies and trends, perhaps providing an interpretation that sheds some more light on the many dimensions of investment risk. The authors suggest that a multifaceted view of the future is better than sole allegiance to one enforced paradigm.
3. Literature review
The authors considered and reviewed a range of literature on long-term risk measurement approaches, including historical and more recent work done by, inter alia, the Bank of England, the Institute and Faculty of Actuaries, and the International Monetary Fund (‘IMF’). The actuarial literature review was focused on UK insurance and UK defined benefits pension schemes and ‘financial economics’ (‘FE’) papers.
In addition to printed/electronic literature, materials were assimilated from attendance at public and non-public events, audio/video materials on the Internet, and discussions with a range of knowledgeable and experienced individuals.
3.1 Life insurance
Life actuarial valuation principles have evolved significantly since the 1950s with many published papers on this topic. Historic papers between c.1950s to 1985 on this topic by Haynes & Kirton, Redington and Skerman focused on principles of matching assets to liabilities, as well as considerations for liabilities to be valued in a consistent manner. Skerman also noted in his paper that he felt ‘market values, particularly for equity shares, are too volatile for the purpose of steering the finances of an insurer over the long term because they vary with the market’s assessment of future prospects as regards earnings and dividends for equity shares and as regards rents for property.’
The papers above prior to 1985 pre-dates the application of market consistent valuation approaches, which have grown in favour with insurers for more than a decade. A more recent paper by Kamran Foroughi on this topic (Reference Foroughi2012), Market-consistent valuations and Solvency II: Implications of the recent financial crisis enables the reader to understand the implications for insurers from the use of this approach with a focus on the impact it has on investment decisions.
Foroughi raised in his paper a macroeconomic concern that market-consistent frameworks could lead to pro-cyclicality where falling market values could threaten insurers’ solvency and drive insurers to sell higher risk assets to fund purchases of lower risk assets. Potential ways in which this might be mitigated span:
1) decisions based on multiple metrics and not solely on market-consistent valuations;
2) recognition that the efficient market hypothesis may not hold in financial crises;
3) introduction of flexibility in the regulatory regime at times of financial crisis; and
4) stakeholders ensuring capital requirements during benign periods are sufficient to meet losses during crises.
In 2016-2017, work done by the UK Treasury Select Committee and the numerous contributors to this enquiry raised core questions concerning the impact on ultimate customers of the new EU SII regulations. It was recognised that whilst it would be good for the UK to maintain equivalence with the rest of the EU, there is a risk that standardisation does not work equally for all companies and introduces competitive advantages for some and disadvantages for others. This leads to a cost to the industry and could increase prices for consumers.
The impacts of other considerations such as regulation and accounting are described in Section 4.7, and fuller documentation of all the above-mentioned topics is in Appendix 1.
3.2 General insurers
As General Insurers’ liabilities are relatively short tailed, the time horizons over which General Insurers invest to meet their liabilities are generally too short for consideration in this paper. However, for some insurers, the increasing prevalence of Periodical Payment Orders (‘PPOs’) is shifting the liability, and hence investment, horizon.
PPOs provide personal injury claimants with a continuing series of regular payments to meet their care needs – rather than a single lump sum. PPOs are normally awarded to younger and/or larger claims and can be imposed by the Court if it believes that this is in the best interest of the injured person.
As PPOs were only introduced in 2005, literature on PPOs and the impact on investment approaches is generally limited. Indeed, the IFoA’s PPO Working Party is one of the most active contributors in this area – in particular conducting regular qualitative surveys with insurers on their PPO exposure and approach.
In their most recent survey, the PPO Working Party noted that 7 of the 12 insurers surveyed had changed their investment strategy as a result of PPOs, with their main concerns being around the long duration associated with PPO liabilities and the inability to find assets that track the inflation indexation used for PPOs (which is typically the Annual Survey of Household Earnings)Footnote 2 .
3.3 UK defined benefits (‘DB’) pension schemes valuations through ‘financial economics’ (‘FE’) papers
Pension scheme valuations literature was reviewed, covering this subject chronologically from its earlier roots through to the times when ‘financial economics’ became fashionable. In respect of DB pensions, most of the FE papers were found to assume that financial conditions as at a relevant date will continue to hold unchanged forever, with volatility being treated as risk – contributing to deficits.
Owing to practical constraints, little account has been taken of non-UK literature. (The US actuaries embarked on that path some years earlier than UK actuaries.)
Until 1989 (Arthur & Randall), the pensions papers sponsored by IFoA ignored ‘financial economics’. The most relevant older papers are those by Puckridge, Redington (although not about pensions), Heywood & Lander and Day & McKelvey. Those pension papers addressed the concept that current market values were not necessarily relevant for longer-term ongoing funding assessments.
From 1989 onwards, especially by Exley, Mehta & Smith, it was assumed that only current market values could be relevant for longer-term ongoing funding assessments, the opposite end of the spectrum. With the benefit of hindsight, it may be regarded as surprising that the later papers excluded any back-testing exercises to see how such an approach could have worked.
A fuller discussion of these topics is in Appendix 1.
3.4 Highlights
Whilst the full list of references appears in the References section at the end of this paper and more detailed insurance and pensions summaries are in Appendix 1, some important works which are closest to the central themes of this paper are:
– Bank of England and the Pro-cyclicality Working Group (2014), Pro-cyclicality and structural trends in investment allocation by insurance companies and pension funds
This paper inspired the formation of the Risk measures working party and hence this research.
– IMF Working Paper WP/16/38 (Reference Jones2016) by Bradley A. Jones. Institutionalizing Countercyclical Investment: A Framework for Long-term Asset Owners
This paper distinguishes different investor types and, most critically, their contrasting risk features and economic risk management focus.
– Reinventing Financial Regulation: A blueprint for overcoming systemic risk (Reference Persaud2015) by Avinash Persaud
This book comprises ‘an analysis of the fundamental flaws that plague the current system of financial regulation, one built around the ideas of “risk-sensitivity” and “capital adequacy”.’ It is strongly critical of the financial accounting, credit and risk standards which create risk by forcing market participants to act in response to MTM valuation conventions rather than an actual need for readily available cash.
– Focusing Capital on the Long Term (FCLT) (2015), Reorienting portfolio strategies and investment management to focus capital on the long term
This paper discusses the perils of short-termism and develops ideas for some alternative investment strategies to remedy this problem.
– Market-consistent valuations and Solvency II: Implications of the recent financial crisis (Reference Foroughi2012) by Kamran Foroughi
This paper is described above under UK life Insurance. Inter alia, it highlights ways in which some of the undesirable impacts of market consistent valuation approaches for long-term insurers might be mitigated.
– The materials submitted in 2016 – 2017 to the UK Treasury Select Committee enquiry into The Solvency II Directive and its impact on the UK Insurance Industry
These documents address critical concepts and economic principles relevant to long-term insurance investment. Key ideas from them are summarised in Appendix 1.
4. Understanding investment risk
There is a wide universe of investors, each with different objectives and constraints. To properly understand the underlying economics and concepts of this paper, it is worth considering the very basics first. This section discusses:
which investors are the focus of this paper;
the fundamentals of ‘investment risk’ in terms of how it is defined and what it might cover (and how it is referred to throughout this paper);
how investment risk does, and should, influence risk measurement approaches; and
how these factors apply in the real world for investors with different liabilities and constraints.
4.1 Long-term investors
The focus of this paper is on long-term investors. The notion of ‘long term’ will vary across investors. Some cycles, such as economic, business, investment, or valuation cycles, do provide a rough indication of the minimum time frame which might be considered as long. For this paper, the authors have not sought to be too precise on the definition of long term, so perhaps institutions investing for periods over 15 years could be considered the starting point.
We can probably more clearly identify the short-term investors who are not within scope. In particular we do not focus on those investors who focus primarily on instantaneous market values and volatility and for which crashes in such values would result in irrecoverable losses or crystallisation of risk events.
Investment horizon is the total length of time that an investor expects to hold a portfolio.Footnote 3 Classical actuarial thought suggests that this should be based on the nature of the liabilities. For example, a pension fund might be expected to meet most of its liabilities in the next 20-30 years but still needs to meet liability cash flows covering say 75 years, until the last pension beneficiary dies.
The investment horizon is a key factor in determining the investor’s cash flow needs, and hence capacity to absorb short-term volatility risk. Establishing an appropriate investment horizon should be one of the first steps to creating a portfolio.
As investment horizons increase in length, equities are likely to represent a higher risk-adjusted return than fixed-income securities and cash. This is described in more detail in Section 4.3.
4.1.1 Which investors have we considered?
The world’s largest asset owners include pension funds (AUM $41.4 trillion at end of 2017)Footnote 4 and insurance firms (AUM $23 trillion in 2015)Footnote 5 .
Long-term investors also include sovereign wealth funds, endowments and foundations, Venture Capital/Private Equity funds, mutual funds, corporations, and high net worth individuals, but for the purposes of this paper, the subset of investors considered will span insurers with long-term liabilities and mostly private sector defined benefits pension funds. Although the discussion following (with respect to industry practices and regulatory aspects) originates mainly from a UK perspective, we believe that most of the economic principles are applicable to these investor classes globally.
In the UK, institutional clients continue to account for the majority (79%) of total assets under management (all asset classes, as at the end of 2017). The largest client group remains UK and overseas pension funds, accounting for 44% of total assets. Assets managed on behalf of insurance represented approximately 15% of all assetsFootnote 6 .
4.2 Investment risk components
Any investor faces a multitude of risks that can be categorised in a multitude of ways. Appendix 2 outlines one possible way of categorising risks and the different risks that different entities might face when investing. The key ones which are covered in this paper are:
Market risk (or systematic risk – market beta)Footnote 7 .
This is the ‘undiversifiable’ risk associated with investing in the market that affects all securities. Typically it is assumed that this risk can be measured by the volatility or standard deviation of market values and/or returns.
To some extent, market risks can be further split – by, for example, interest rate risk, equity price/volatility risk, currency risk and credit risk. Appendix 2 contains an outline of the market risks for a number of key asset classes over different time periods.
Liquidity risk
Trading liquidity risk, i.e. an investor’s ability to trade, is the risk of not being able to buy or sell investments in sufficient quantities or without excessive haircuts as and when desired because marketplace opportunities are limited.
However, for the classes of long-term investor addressed in this paper, funding liquidity is usually the primary risk to consider. Funding liquidity risk refers to an entity’s ability to continue to function as a going concern, i.e. meet both anticipated and unanticipated immediate net cash outflow needs (arising from either the liabilities or the assets), and avoid permanent impairment. For example, the risk of an insurer needing to meet mass surrender values or a small pension fund with little or no new money inflows or alternative funding resources meeting sudden large benefit payment outflow.
Liquidity risk arises from uncertainty regarding the investment horizon or asset holding period, the correlation across the cash flow demands of market participants, and short run constraints on market making capital.
Liquidity management is discussed in section 4.4.
The application of these risks, and the other risk categorises outlined in Appendix 2, affects investors with different liabilities differently. These are discussed further in Section 4.6.
4.3 Defining and understanding Investment shortfall risk
The definition of risk depends on who the investor is and their economic risk capacity. Contrary to customary usage, asset classes or types are not intrinsically ‘safe’ or ‘risky’ – the degree of riskiness depends on who the investor is, the nature of their funding sources, what constraints they face, and for what purposes they are holding the asset. A ‘risk free’ government bond with coupons and redemption proceeds fixed in nominal terms might be extremely risky for an investor seeking to a meet 30-year inflation-linked liability – it is likely that the investment proceeds might not meet the investor’s target.
4.3.1 Structural risk capacity and investment strategy
An entity’s economic risk capacity should not be confused with its risk appetite or mood. The former is the investor’s ability to bear some amount of volatility risk, whilst the latter the investor’s willingness or unwillingness to take that risk. The long-term investor has a natural ability/capacity to bear the shorter term pricing fluctuations, owing to the extended future time period over which it becomes liable to pay out cash. An example of this is illustrated in Table 1, where the CPPIB takes a genuinely long-term view. However, an investor’s ability to take risk not only depends on the economics, in terms of the nature of their liabilities, but also on practical or external considerations, for example, in terms of regulation.
Bearing in mind their risk capacity and appetite, an entity will choose an investment strategy which is consistent with both their strategic risk capacity and their risk appetite at a given point in the cycle.
Table 1. CPPIB case study

This topic of structural risk absorptive capacity is covered in greater detail in PersaudFootnote 8 , in which the author describes how ‘The different requirements of short and long-term funding provide a genuine capacity to price an asset differently,’ and notes that not only does this make economic sense for the long-term investor, but it also mitigates systemic risk since “The right place for a risk is where there is a capacity to absorb that type of risk. One critical advantage of placing risk where it can be best absorbed if it erupts is that it becomes less dependent on its size being measured correctly. Incorrect measurement of risk is at the heart of financial crises… If risks in the financial system are in the wrong place, then no reasonable amount of capital will save the system”. Persaud favours reinventing financial regulatory systems to change the focus away from risk-sensitivity towards measuring sizes of mismatches between market volatility risk taken and the investor’s structural risk absorptive capacity.
4.3.2 The importance of, and defining, investment shortfall risk
Although different types of investor will be faced with the same array of risks, the liabilities faced by a particular investor will heavily influence the appropriateness of different investment approaches. In particular, the liabilities affect:
○ The term of investment (short term versus long term).
○ The need for inflation protection from inflation linked assets (e.g. RPI/CPI)
○ The nature of the liability (including size of reserves, certainty of cash outgo, whether there is any new money from premiums/contributions, treating customers fairly)
The liability structure is thus a core influence on the entity’s risk capacity.
To emphasise the importance of the liabilities to the investment approach, in addition to the different categories of risks faced by investors outlined in Appendix 2, the concept of investment shortfall risk is of critical importance.
As previously stated, for the purposes of this paper investment shortfall risk is understood and defined in terms of economic reality over time: and is defined in Table 2.
Table 2. Definition of investment shortfall risk

4.3.3 Understanding Investment shortfall risk
Different types of investor take different approaches and may therefore warrant the use of different risk measurement approaches. By definition, this paper will not be able to fully address the bespoke needs or goals of any specifically identified business entity but will focus on the most important economic fundamentals which should drive strategy decisions.
For the purposes of this paper, the measure of investment horizon shortfall risk will be the extent to which the actual results achieved fall short of these targeted outcomes. The size of the shortfall risk will depend critically on the extent of the match between investment horizon and funding horizon.
Figure 1 shows the concept of shortfall risk, for a single cashflow at a point in the future.
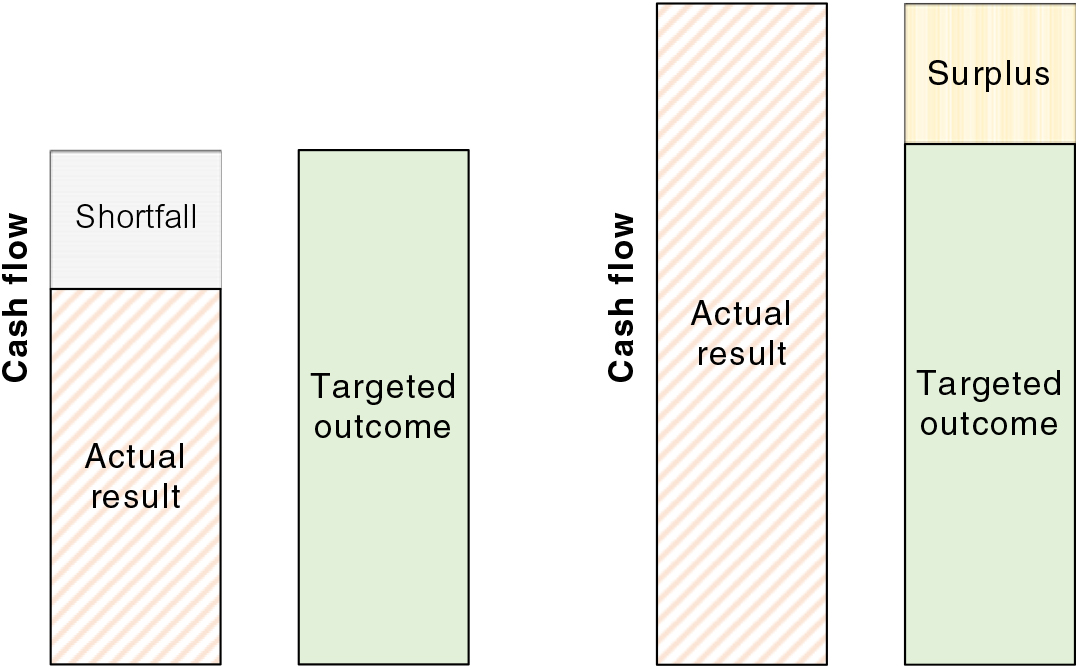
Figure 1. Shortfall/surplus and the concept of shortfall risk – Cash flow (point in time)
4.3.4 Shortfall risk: a global case illustration
Consider a case where the targeted outcome is investment returns which at least preserve the investor’s purchasing power, i.e. returns in excess of inflation. For this study, a constructed S&P 500 Total Returns index was used as a sample proxy for a well-diversified institutional investment portfolio.
Figure 2 shows a comparison of annual S&P 500 nominal total return performance against US inflation over differing periods of investment, providing the average annual excess returns over annual inflation for varying time periods of investment along with the number of instances of underperformance. This chart uses data for over a century from 1913-2017 and considers overlapping periods of investment.
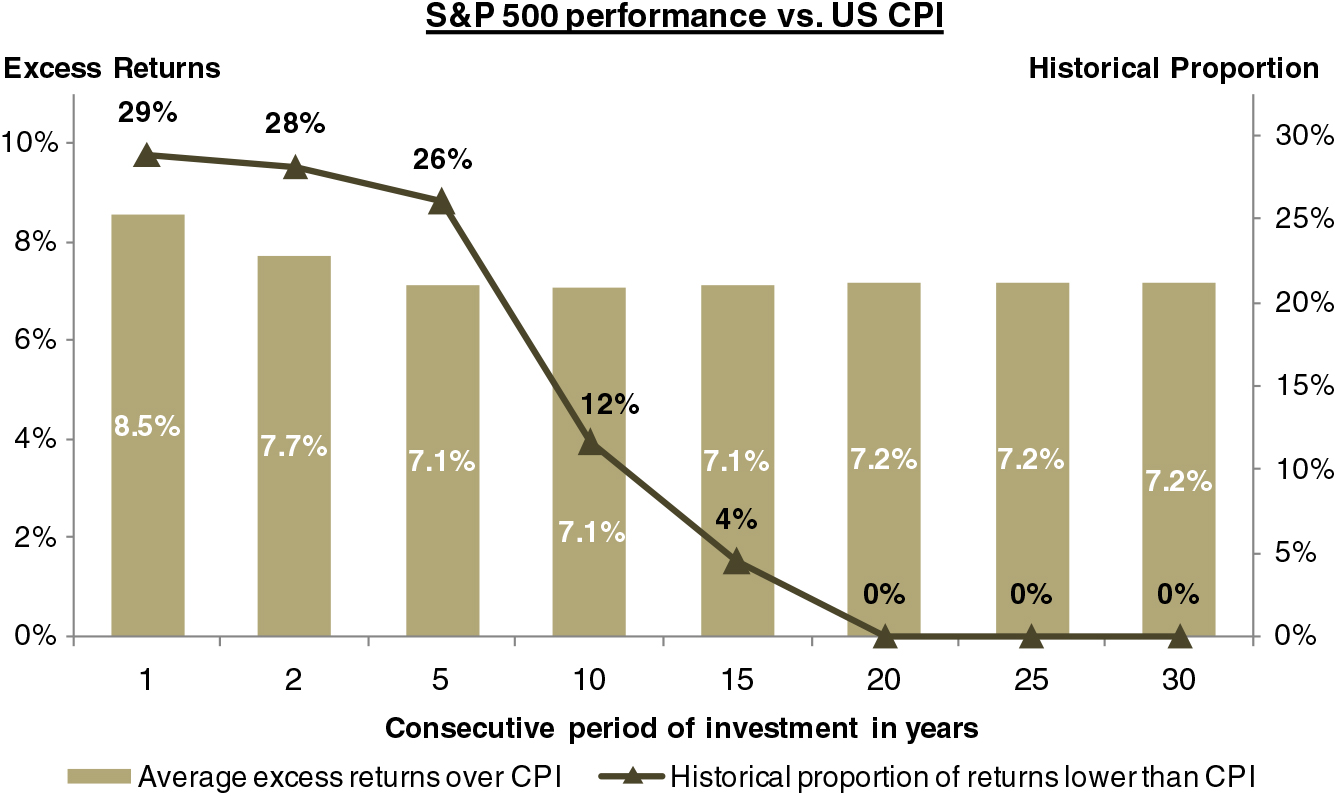
Figure 2. Chart of real annual returns
The data for these returns charts was sourced from the following:
“Board of Governors of The Federal Reserve System of the United States”; “Bureau of Labor Statistics (“BLS”) of the U.S. Department of Labor”; “Federal Reserve Bank of St. Louis Economic Research Division – Federal Reserve Economic Data (“FRED”)”; “Multpl.com, S&P 500 dividend yield by month”; “Multpl.com, S&P 500 historical prices by month”; The World Bank, Databank – Global Financial Development”.
Generally, we would expect that shortfall risk is diversified by time and decreases over increasing time horizons. The chart in Figure 2, which is based on actual market data over the past century, appears to support this hypothesis.
Over the past century, nominal annual equity returns have fallen short of the targeted outcome of earning returns in excess of the inflation in at least 25% of the instances for short-term investment of less than 5 years but it steadily declines to less than 5% for investment terms of 15 years or longer.
The returns profile of long-term investment, particularly that of publicly listed equities, is a noisy one, with short-term variability often obscuring and distorting the path of the long-term trend line.
A number of studies have shown that, with increasing time horizon, the long-term trend tends to reach a point beyond which the effects of the short-term trading noise become far less relevant.Footnote 9 This is shown in Figure 3. Asset valuations tend to oscillate over a multi-year horizon around a fundamental value of future cash streams. Further, for assets which are bought and held, the transient capital value fluctuation does not matter as much.
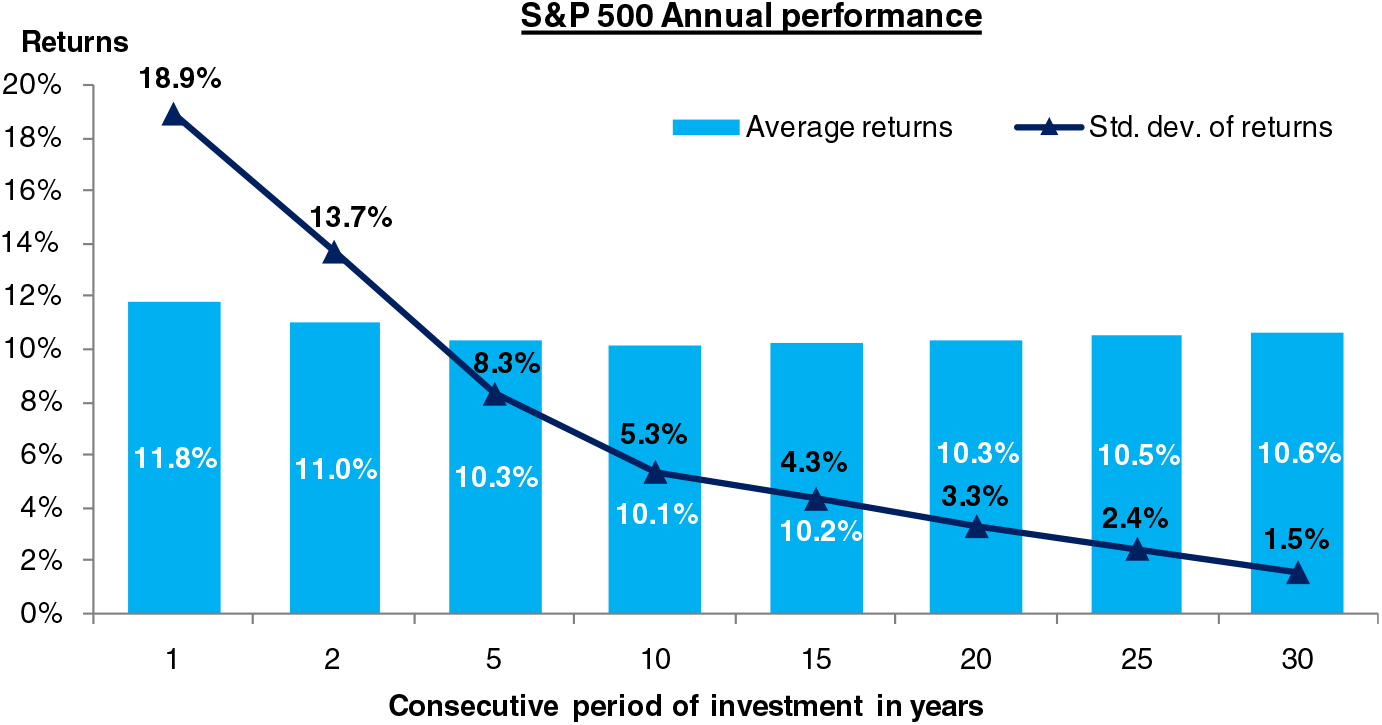
Figure 3. Investment returns over increasing time horizons
This study focuses on review of equity investments especially in the context of a pension scheme with continuous investment inflows requiring sustainable long-term value creation with limited risk of underperformance.
Figure 3 considers the constructed S&P 500 annual Total returns over the past century from 1913 to 2017 for overlapping time period of investment ranging from a year to up to 30 years. This chart shows that returns have been highest over shorter investment horizons before stabilising to marginally above 10% p.a. over longer investment horizons. High volatility (standard deviation in returns) has been experienced over shorter investment horizons but this reduces significantly as the time period of investment increases while the returns are broadly stable around the 10% p.a. mark. These trends appear to imply that equities have provided strong and stable returns over the long term and assist in long-term value creation with relatively low volatility.
Additionally, to more comprehensively assess the risk of underperformance in equities, equity returns were evaluated against alternative low risk investments. In this regard, the constructed equity proxy returns were compared against returns on US 10 year Treasuries for overlapping time periods of investment ranging from a year to up to 30 years during the last century (1913 to 2017). Average annual excess returns over a fixed period of investment along with the number of instances of underperformance with respect to long-term interest rates are shown in Figure 4:
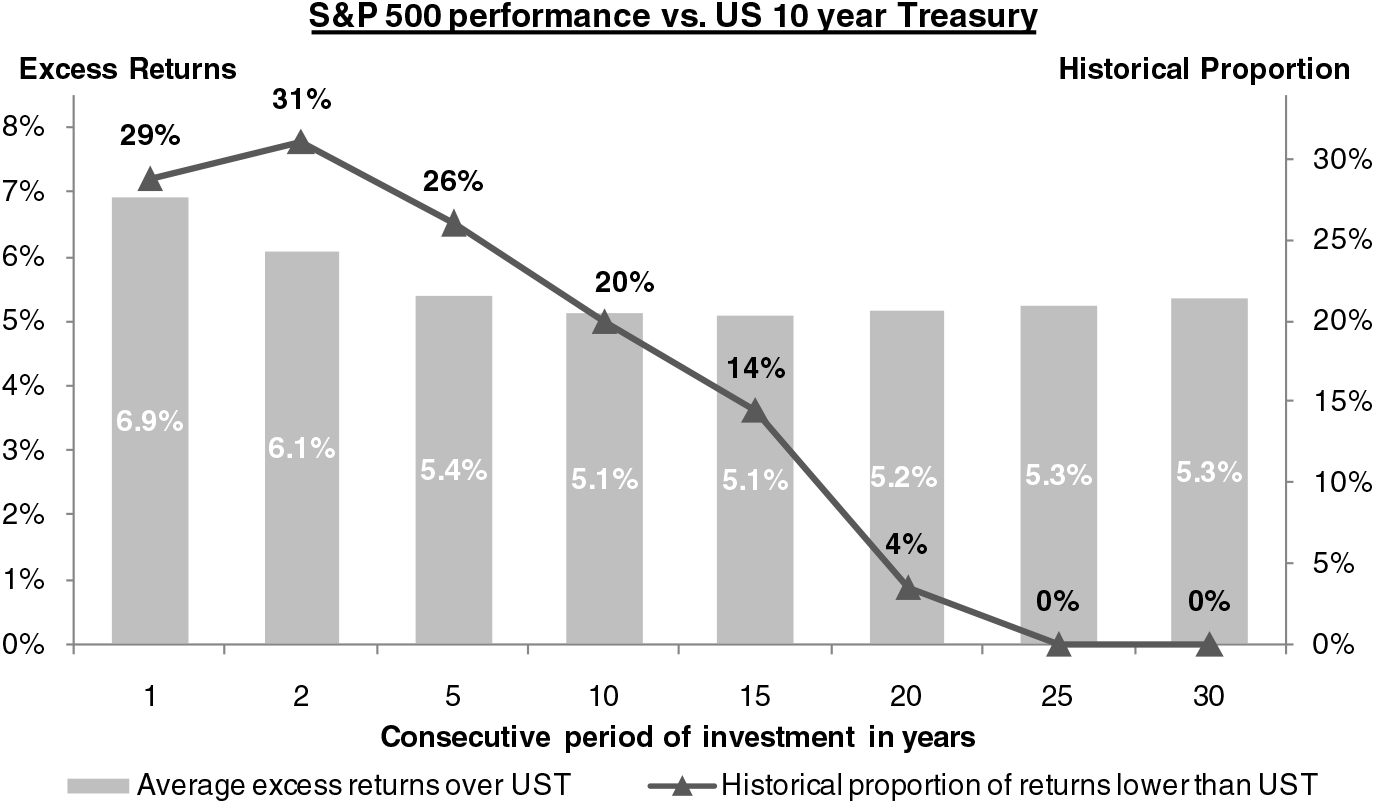
Figure 4. Investment returns of equities versus bonds
The sample equities portfolio has provided higher returns than 10 year Treasury Bond but, historically, the risk of underperformance is large over the short term to the near medium term (five years). Later, the historical proportion of lower equity returns than long-term interest rate reduces significantly and over the far end of the long term (greater than 25 years), reduces to 0%. Thus, historically, these equities have provided approximately 5% p.a. higher returns than the long-term Treasury Bond whenever the period of investment was more than 25 years.
This analysis above examined sample equity performance over the past century including time periods influenced by major economic and geopolitical events like the 1929 Great Depression, the two world wars, and so on. However, past performance may not necessarily provide an indication for the future prediction. (For a fuller description of limitations relating to use of past data, please see the Disclaimer).
4.3.5 Shortfall risk: capturing both sides of the trade off
This feature (the shortfall risk varying by time) drives fundamental differences between different entities – for example, banks versus insurers and pension funds.
The driving principles are well expressed in the IMF Working Paper (Reference Jones2016) which stated that long-term shortfall investment risk could be broken down into
1. The risk of large negative returns causing the fund to lose value, as well as
2. The risk of forgoing large positive returns, thus failing to achieve the targeted long-term return objective.
In other words, shortfall investment risk should be concerned about taking too much and too little risk – i.e. consideration of a risk management approach that takes into account both the left and right tail of the return distribution.
This is in contrast with many market risk management approaches which only focus on the left tail of the return distribution, for example, the use of the value at risk (‘VaR’) measure – which is generally the focus of shorter term investors (referred to as ‘Type 2’ investors in the IMF paper – see Table 3).
Table 3. Distinction of different types of investor. Source: Jones, B.A., (Reference Jones2016). Institutionalizing Countercyclical Investment: A Framework for Long-term Asset Owners, IMF Working Paper WP/16/38
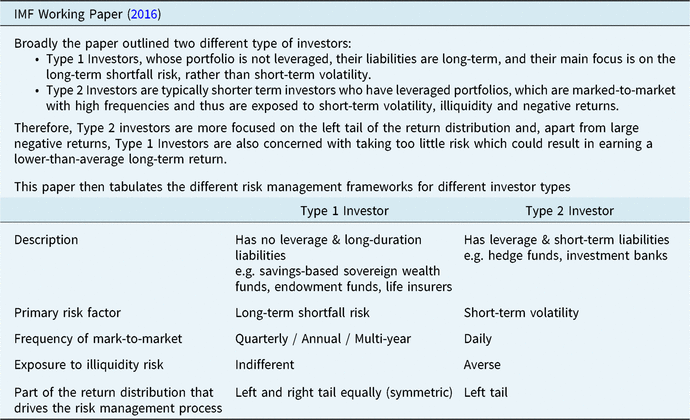
The distinction made in the IMF paper reinforces the points made in this paper; namely that not all investors are ‘Type 2’ investors and the risks faced by longer term investors (‘Type 1’) are of a different nature.
4.4 Liquidity management considerations
For long-term investors, in an economic asset-liability context, the liquidity of both the liabilities and the assets must also be considered. Liabilities can be essentially categorised as negative assets and thus the greater the liquidity of liabilities the more risk it poses to the issuer of the liabilities. For example, a financial entity that takes demand deposits allows depositors to withdraw their balance at will, which presents a high degree of liquidity risk to the entity. On the other hand, in general, pension funds providing to meet the policy benefits at the time of retirement (or death) of the pension beneficiary presents only limited short-term liquidity risk as the requirement is primarily for long(er) term liquidity. Liquidity need is also lower in instances where the liability payoffs are more closely aligned with asset payoffs for e.g. in case of a with-profit life insurance policy with a discretionary bonus, the need for liquidity is further reduced compared to a policy with a non-discretionary bonus .
Whilst in the financial markets in general the term liquidity risk typically covers ‘trading’ or ‘banking’ type liquidity risk of having insufficient short-term deposit funding and marketable assets, for long-term investors the primary concern is the entity’s ability to be resilient to extreme tail loss events, for example, the risk of having to crystallise losses on growth assets to meet unanticipated short-term cash outflow demands. This example describes the concept of funding liquidity for the long-term investor’s liabilities, as contrasted to trading liquidity for the investment instruments held. In the aforementioned example, the funding liquidity of an institution is illustrated to be subject to behavioural risk by individuals, such as in cases where a large number and quantity of insurance policyholders decide to encash their policies just after a market crash.
Whilst more liquidity is needed when conditions are tight, there is an opportunity cost to excess liquidity, typically in the form of lower investment returns. Market makers’ compensation for liquidity provision depends on short-term price reversal. When the volatility (typically indicated by VIX) is high, the intensity of the short-term price reversal effect is stronger, i.e. market makers charge a higher premium for supplying liquidity to the market. Liquidity evaporates quickly during times of extreme market volatility as providers reduce the supply during times of market turmoil demanding higher returns, market volatility tend to increase. Thus volatility and liquidity are closely linked.
It is interesting to note that subjectivity is in fact a necessity for trading liquidity and functional markets. Consider 1000 participants with ‘the same investments, the same market data, the same best-practice, valuation, risk management, and accounting systems and the same prudential controls based on published credit ratings. When one member wants to sell an instrument in response to these systems, so does everyone else. This is an illiquid market. At any one time there will only be buyers or only sellers. Liquidity is about diversity.’Footnote 10 i.e. Subjectivity is in fact needed for the functioning of a healthy financial ecosystem.
4.4.1 Liquidity measures and asset class
Liquidity risk assessment especially for evaluating performance of long-term investment must adopt measures that assess investments taking into account the underlying business risk. Therefore, these measures must:
(i) consider the objectives for the investment and the nature of the liabilities required to be serviced; and
(ii) ensure risks are assessed over a period of time that corresponds with the tenor of risk being held.
The measures that are used to evaluate the liquidity of various assets classes may include evaluation of:
Marketability – reflects the depth of the market, which is dependent upon the level of activity in the market. This can be reviewed through measures such as turnover ratio or trading volumes etc.
Resilience – indicates that assets prices are not significantly impacted by the level of market activity.
Immediacy – indicates that the time to complete transactions is low.
Further consideration of the marketability aspect of liquidity is considered in Appendix 3.
4.4.2 Liquidity considerations specifically for UK insurers and pension funds
In general, insurance firms do not explicitly hold capital specifically for liquidity. In SII however there are limitations on the matching adjustment (‘MA’) where the liabilities have variable cashflows, and this is similar to holding extra capital. The need to restore MA compliance within a 2 month time frame in a stress could incentivise firms to invest in lower return, more liquid assets such as corporate bonds rather than higher return assets such as illiquid assets.
Not requiring capital to be held in respect of liquidity risk could be viewed to be sensible because, in a liquidity event, holding capital is not necessarily viewed as a suitable mitigant. However, this does not mean that insurers should ignore the effects of liquidity risk.
Liquidity Risk is primarily a part of the Pillar 2 of the SII Directive. Organisations must have a robust governance system and demonstrate a proper risk management with respect to various risks including liquidity risk. In particular, the underlying objective is to ensure:
identification and proper assessment of all risks they are (or could be) exposed to;
maintenance of sufficient capital to face these risks; and
development and usage of better risk management techniques in monitoring and managing such risks.
It has been noted that the points mentioned here can be mutually contradictory, since identification and assessment of the risks in the economic context of the (long term) business do not always imply that more capital is the optimal approach.
Also, in accordance with SII directives, national competent authorities should ensure that in its risk management policy, the undertaking covers at least the following items with regard to liquidity risk:
the procedure for determining the level of mismatch between the cash inflows and the cash outflows of both assets and liabilities, including expected cash flows of direct insurance and reinsurance such as claims, lapses or surrenders;
consideration of total liquidity needs in the short and medium term, including an appropriate liquidity buffer to guard against a liquidity shortfall;
consideration of the level and monitoring of liquid assets, including a quantification of potential costs or financial losses arising from an enforced realisation;
identification and costs of alternative financing tools;
consideration of the effect on the liquidity situation of expected new business.
In terms of various assets classes, the SII directive specifically focuses on the level of mismatch in the payoffs of the assets and the liabilities and thus the management of the liquidity shortfall. Also, the level of liquid assets must be monitored and the potential costs or financial losses arising from an enforced realisation in the form of forced sale, repo etc. must be considered.
The consideration of stressed scenarios for insurers assumes that the banking sector will remain robust. As demonstrated in the financial crisis, such an assumption does not always hold – particularly under instances of extreme financial stress and so such scenarios may be considered as unrealistic in extreme environments. A full discussion on systemic risk is beyond the scope of this paper.
For pension funds, there is no explicit (regulatory) requirement for trustees to manage or quantify liquidity risks but it is one of the key considerations that trustees should consider when setting the investment strategy:
Your strategy should be appropriate for your liquidity needs, for paying benefits and expenses and for any collateral requirements. It should take into account the risks introduced if your scheme is significantly cash flow negative, or is expected to become so in the futureFootnote 11
4.5 Humans, traders, incentives and heterogeneous risks
Whilst actuarial and investment issues obviously influence the investment approach for long-term investors, there are a number of other softer, often unobservable, factors that influence the investment approach.
4.5.1 Human emotions and investor trading behaviour
In particular, risk is not just an objectively quantifiable number – it also depends heavily on people’s perceptions, emotions and expectations. As such, understanding the economics of the investment approach is not identical to the unambiguous logic of mathematical equations. The literature on behavioural economics is comprehensive and outlines how real life decisions made by individuals can vary to those implied by classical theory. For example, due to:
Heuristics: the human mind desires to understand the world, and seeks a few simple, elegant ‘rules’ to ‘elegantly’ explain as much of the world as possible and the basis on which to make decisions (‘rules of thumb’).
Framing: whereby anecdotes and stereotypes might influence the way in which individuals understand and respond to events.
Market inefficiencies: for example, as demonstrated in momentum effects for stocks or how social paradigms change over time and cycles of fashion exist (e.g. whether companies are private/public, sources of funding, role of government/social protection).
Some of these theories can be used to explain some of the issues outlined above – for example, whilst some fear is essential for survival, excessive fear can be damaging (e.g. paralysis, stagnation) especially if socially transmitted, amplified and reinforced over time.
The role of surrogate decision making, whereby decisions are taken on behalf of others (e.g. pension Trustees) amongst long-term investors might also influence the level of risk being taken. Surrogates often display more muted behaviour (in investment decision making) converging towards more socially accepted choices. As surrogates want to be socially seen as making the right public decisions on behalf of others, their decisions may inter alia be influenced by self-image preservation and may create a bias towards more conservative choicesFootnote 12 .
4.5.2 Behavioural incentives of different stakeholders
Behavioural aspects also play a most influential part in the socioeconomic context. One crucial consideration is that there are asymmetric incentives impacting on some important decision makers. The regulator itself faces substantial risk from loss-causing events but has scant incentives to optimise the economic growth in the country’s economy. This impact is compounded by the fact that the preferences of public policymakers tend to lean strongly towards conservatism to avoid any need to support financial institutions under any circumstances.
There is a trade-off between the level of security and the price the consumer has to pay for that insurance… The price the consumer has to pay for that is something that they will not get a choice in. That choice is made by the regulatory system.Footnote 13
Whilst the topic of behavioural economics is vast and thus a full discussion is beyond the scope of this paper, its relevance to the theme of investment risk should not be ignored.
4.5.3 Risks are heterogeneous
Notwithstanding the human inclination to want to simplify, treat things uniformly and with a common base, and assign an arithmetic value to quantities, it should be recognised that there is no one homogeneous ‘substance’ called ‘risk.’ In Section 4.3, we highlighted how risk was inherently subjective and ‘in the hands of the holder.’
Further, different risks might need to be mitigated in different ways. Whilst there is some degree of interdependency, liquidity risk and credit risk should not be confused – they are hedged substantially differently.
Whilst capital can act as a buffer against credit risk, it is not necessarily appropriate to hedge liquidity risk. An investment portfolio’s economic exposure to credit risks is mitigated by instrument holdings diversification, for example, across the layers of an issuer’s capital structure, across different industrial sectors and geographies. In sharp contrast, liquidity risk cannot be similarly hedged by increasing the number of distinct portfolio holdings, it is a risk which varies with the investment markets’ supply/demand reactions and trading over time. Holding capital is not the only, and indeed often not even the best, way to mitigate risk.
4.6 Application to different investor types
A short description of how the risks outlined above affect the main investor classes and other considerations in setting investment strategy is outlined below.
4.6.1 Life insurers
Insurers have structurally disinvested in equities over many years, and as mentioned above now account for only a small portion of total growth assets invested in the UK. This is partly driven by consumers losing confidence in with-profit products and by the rise of unit-linked products where the choice of investment is not within the control of the insurer.
Insurers are very heavily regulated – this, along with accounting rules and conventions, is a key driver of asset allocation. The situation is exacerbated by the introduction of SII where liabilities are valued on a market consistent basis.
The EU regulatory capital standard under SII is a one-year value at risk measure. By this we mean that risk is measured over a one year period based on a certain probability of loss. For the SII regulatory capital requirement, the Solvency Capital Requirement (‘SCR’) is set as the 99.5th percentile loss over the one-year period. This could potentially be viewed as putting too much emphasis on short-term volatility instead of focusing more on long-term volatility. SII makes some allowance to reduce pro-cyclical effects and recognising the long-term nature of liabilities (for example, through the equity dampener, use of volatility adjustment (‘VA’), matching adjustment (‘MA’), etc) but these measures are often rigid and may be viewed as too prescriptive.
The Own Risk and Solvency Assessment (‘ORSA’) under SII encourages firms to perform their own bespoke analyses, including carrying out long-term run-off modelling on their own assumptions and use that modelling to set their investment strategy.
Liquidity considerations are typically managed through internal management controls of liquidity planning, for example, assessing the liquidity needs in various liquidity stress conditions. The balance of liquidity depends on the mix of business written where, for example, a closed with-profit fund running-off is likely to have a proportionately higher liquidity requirement compared to an annuity fund which is actively writing new business.
4.6.2 General insurers
With shorter tailed liabilities, the investment focus for General Insurers tends to be over shorter time horizons. However, the provision of PPOs are increasing the investment outlook for some General Insurers – particularly in respect of their larger claims for which PPOs are more prevalent.
A large number of PPOs are provided from, or near, the public sector (for example, through the NHS Resolution in respect of clinical negligence) which means that the principles of investment are either not applicable (because the pay-as-you-go nature means there are no funds held) or the principles are distorted.
For regulated private sector General Insurers that provide PPOs, the extent to which the investment strategy is more focused towards the longer term depends on the number of settled PPOs. Whilst there are external factors and trends influencing PPO propensity, the insurer will have their own views and some influence on the extent to which claims settle as PPOs. The key issue in this regard is the relative attractiveness of a PPO against a lump sum settlement, with claimants weighing up the size and risks of different award types and insurers weighing up the capital consequences.
Although an insurer may have some influence over whether a claim settles as a PPO or not (through the settlement process), ultimately a PPO can be imposed by the Court and so this may present a significantly different investment challenge to what a General Insurer is used to. In particular the main challenges to a PPO provider are:
The liabilities are often significantly longer than a General Insurer’s other claims risk.
The insurer is exposed to the longevity risk of the claimant living longer than expected.
PPOs are normally linked to an earnings index (‘ASHE’) which cannot be readily hedged.
There is the possibility of a step increase in the amount payable if the PPO is reopened as the claimant’s circumstances change.
As such, the ‘interest rate risk’ that is usually a small component of the overall risk for a General Insurer (relative to Life Insurers and Pension Schemes) can become more significant. There are though potential benefits to the insurer in that PPOs have a lower liquidity requirement – due to the immediate cashflow requirement being lower.
Many insurers make use of reinsurance to share the risks of PPO claims. Whilst to some extent this may reduce the insurers’ overall level of risk, some PPO reinsurance contracts allow for the reinsurer’s share to be capitalised – hence meaning the General Insurer bears all of the investment risk.
4.6.3 Pension funds
In the pension landscape, there has been an obvious shift towards Defined Contribution (‘DC’) schemes where the investment and longevity risk is borne by the individual. Whilst funds are still managed by institutions, and the investment choices made by individuals may be subject to the behavioural biases discussed in this paper, we have not considered DC pensions as part of our core focus – as they relate to individual investments.
For Defined Benefit schemes, their investment purpose is to provide retirement security in the form of real purchasing power for retirees. Risks to a pension fund include longevity, domestic economic performance and wage growth. Essentially pension funds want investment returns to hedge against the risk these factors pose to the level of contribution rates and benefits paid.
As benefits payable to members are defined, shortfall risks are borne by sponsors. In reality, if at all, ultimately only a State can afford to offer guarantees because of the taxation power. Not only do most private sector entities not possess such a source of finance but also few private sector directors truly understand the nature of an open-ended financial guarantee.
Broadly speaking, before 1997, most pension increases were either discretionary or guaranteed at minimal levels. That changed for all future benefit accruals and for some schemes for prior benefit accruals.
Over the past 20 years or so, financial economics has become generally accepted by UK pension actuaries as the dominant approach to assessing funding requirements. Whilst this provided the basis for funding approaches, some highlight that there is no evidence that this can be relevant to long-term entities. The theoretical academic evidence related to perfect markets, but perfect information is not generally available, and it cannot be (Grossman & Stiglitz, Reference Grossman and Stiglitz1980).
As a separate rationale, it was vigorously stated that using bond yields was, in any case, prudent, so not understating the liability was seen to be in the members’ best interests. However, prudence can only be identified from the best estimate, which is rarely, if ever, disclosed to stakeholders.
Further, discounting cashflows to a single liability value on which to make funding and investment decisions suggests a greater degree of certainty about the future than can be justified. Using capital values fails to allow the communication of the many risks and rewards that may lie ahead and their relative likelihoods.
Since 2003, the vast majority of private sector defined benefit schemes have been closed. This has had the effect that more of the benefits than before have become guaranteed. That has led to sponsors and trustees being advised to switch very largely from real assets to bonds. During the last decade since the crisis, bond yields have been exceptionally low, especially for index-linked gilt-edged stocks. The value is hard to discern. If anything, given that the cashflows stretch far into the future, a pension fund should be a natural home for ‘patient capital’ (see FCA consultation for DC plans, announced 12, December 2018).
4.7 Other considerations and constraints
In practice, investors such as long-term insurers and pension funds are unlikely be able to manage their business on a ‘pure’ economic basis of solely targeting returns and profitability whilst managing risks such as investment shortfall risk. This section will briefly mention two of the most onerous constraints on economic business management, namely regulation and accounting rules and conventions, noting their market structural impacts.
It has been mentioned earlier in this paper that a focus predominantly on regulatory capital can have perverse incentives, and additional capital costs/expenses incurred are not necessarily financially optimal or in the best interests of the ultimate beneficial investor or customer. We now consider each of the insurance and pensions areas in turn, taking a look at the history and current state of play of the UK regulatory environment.
4.7.1 Insurance companies
Currently, rules for the amount of capital that UK insurance companies must hold are specified in SII regulatory regime, Directive 2009/138/EC of the European Parliament and of the Council (2009), which came into force with effect from 1 January 2016. Since then, there have been a number of ongoing consultations and discussions addressing the real and perceived shortcomings of, and potential improvements to, the existing specifications.
Article 101 under the Level 1 Directive sets out the methodology for calculating the Solvency Capital Requirement under the SII framework. Paragraph 3 of Article 101 sets out the time horizon for this purpose:
3. The Solvency Capital Requirement shall be calibrated so as to ensure that all quantifiable risks to which an insurance or reinsurance undertaking is exposed are taken into account. It shall cover existing business, as well as the new business expected to be written over the following 12 months. With respect to existing business, it shall cover only unexpected losses.
It shall correspond to the Value-at-Risk of the basic own funds of an insurance or reinsurance undertaking subject to a confidence level of 99.5% over a one-year period.
Under SII’s Standard Formula, the base equity shock is 39% for Type I equities (equities listed in countries which are members of the EEA or the OECD) and 49% for Type II equities (all other equity types).
There are various measures within the SII framework which allow some mitigating offsets to the severity of the specified shocks, and these are touched on briefly later in the notes that follow.
In late 2016, the UK Treasury Select Committee (‘TSC’) launched an inquiry into the SII regime. A number of pertinent points were raised by several key respondents:
Impact on equity investment and other real assets
The IFoA was of the view that ‘market consistent approaches have discouraged investment in equities other than where the policyholder bears the risk, such as on unit-linked business.’ There are both positive and negative perspective to consider:
1. From a positive perspective, ‘it discourages firms from giving over-generous guarantees and ensures de-risking can take place at short notice.’
2. However, this could disincentivise investments in ‘long term risky assets’. ‘For example, if the objective is to generate strong real returns with say a 20 year investment horizon then equities are a good asset as over this time period their returns are likely to be highly correlated with long term inflation impacts as indicated through the long term equities value creation review under Section 4.3. However, SII imposes a one-year horizon for capital and over that time period equity returns may be strongly negatively correlated with inflation.’
(By way of background, ‘Actuarial risk principles’ Section 6. on ‘Measure the risk’ states that one should allow for possible effects over the full time horizon of interest: different factors may be more prominent over different time scales. It is important to clarify which time horizon is most important for the stakeholder, so that we can focus on considering the right system drivers for that period. For full details, see Institute and Faculty of Actuaries (“IFoA”) (2017). Risk management – an actuarial approach.)
Due to the stringent requirements underlying SII and in particular the matching adjustment constraints, companies have had to jump through many ‘hoops’ before including suitable asset classes within the matching adjustment (‘MA’) portfolio. These include the need to create ‘“matching adjustment friendly” (e.g. decomposing property assets into income strips and residual property values due to the need for asset cashflows to be fixed unconditionally to be matching adjustment eligible). This type of activity does not lead to any reduction in investment risk. Indeed, the additional complexity adds operational risk, creates asset valuation challenges, reduces transparency and adds cost.’ Footnote 14
Criticism of market consistent principles and 1 year value at risk (‘VaR’)
Some criticism from the industry highlighted that these principles could encourage pro-cyclical behaviors which causes systemic risks. Market consistent techniques are neither stable nor verifiable for the full range of assets and insurance liabilities. Embedded within market-consistent valuation methodologies is the fundamental belief in the efficient markets hypothesis (i.e., that at any given time and in a liquid market security prices reflect all available information; it is not possible to know that you could know more than the current price).Footnote 15
The 1-year VaR framework is not necessarily considered to be compatible with insurer’s long-term liabilities where there this method may ‘fail to capture the path dependency of risk factors beyond the 1 Year period.’
Furthermore, valuing a long term business on a 1 Year basis is at odds with the time horizon of a going concern enterprise or the new requirements for directors to provide a long term viability statement in the annual report, since it says little about the ability of an insurer to meet its liability-related cash flows as they fall due.Footnote 16
Some SII mitigants
The long-term guarantee packages in the form of MA and volatility adjustment (‘VA’) helps balance things somewhat but these measures are still viewed to be overly prescriptive and perhaps opportunities for a principles-based approach may be available post-Brexit. While MA has a generally high take-up in the UK, on VA, there appears to be general consensus that the rules are too rigid. Recently, there has been discussion between major industry players and the regulator on possible ways to evolve a more dynamic VA.
Table 4. Regulatory versus accounting buffers. Source: Legal & General Group plc written response to Treasury Committee enquiry SII (SOL0009 of November 2016)

Further unintended consequences of stringent time-sensitive capital regulations could include wider macroeconomic impacts: there is greater systemic risk. The market-consistent elements of SII encourage behaviours which tend to move all market participants in the same direction simultaneously, thereby increasing the risk to the financial system as a whole on a much larger scale. SII’s rigidity is illustrated in Table 4, where it is contrasted to the accounting approach to the balance sheet.
In summary, notes from the EU High-Level Expert Group on Sustainable Finance (‘HLEG’) (2018) seem to express the issues concisely:
Solvency II currently bases a number of important elements – such as the setting of discount rates, the determination of risk margins and the calibration of charges for investment risk – on the assumption that insurance companies trade all their assets and liabilities at any point in time. This assumption is not consistent with the long-term business model of insurance and with economic reality. It is also not consistent with the wider desire and benefits for significant market participants to maintain and even grow their long-term approach to investment.
The obligation entailed in the IFRS accounting rules to use current market values for equity investment further discourages the use of equity for long-term investment – an issue that the Commission has committed to investigating in 2018. This investigation has the potential to unlock significant equity investments, while at the same time paving the way for improvements in the risk/capital regime. A more long-term, stable accounting framework would bring the reported balance sheet much more in line with the actual business model, and solutions found there could feed into the Solvency II 2020 review. By way of scale, even if only one percentage point of assets were to move from debt to equity, this would entail additional equity investments of €100 billion and reduce the debt bias in the EU economy. More specifically, it will be important that the upcoming IFRS 17 accounting standard ensures a combined working of accounting standards of assets and liabilities, as these are managed jointly in the insurance sector.
4.7.2 Pension funds
Introduced in 1997, the Minimum Funding Requirement (‘MFR’) was discontinued in 2006, with the advent of the Scheme Specific Funding Requirement (‘SSFR’, see below). It was intended to provide a simple uniform approach for determining whether or not a discontinuing scheme would have sufficient assets to secure the accrued benefits with a specialist pension provider. Originally, it was intended to be the Minimum Solvency Requirement but that was thought to be too ambitious an objective. In reality, the MFR was insufficiently tied to the actual market cost and was seen to have failed. The idea of uniformity was also held to be out of place and the SSFR was introduced in 2006.
Sponsors had already had to take account of revised pension accounting standards, with FRS17 Retirement Benefits introduced in 2003Footnote 17 and IAS19 Employee Benefits introduced in 2005. The differences between the standards were not that major but they were applied to different types of organisation. These accounting regulations, along with falling bond yields with which the accounting basis is set, led to large accounting pension deficits being shown on the sponsors’ balance sheets, which led to some pension schemes being discontinued.
In June 2003, the Debt Upon Employer regulations were enacted without any consultation. This new legislation made solvent sponsors responsible for pension scheme discontinuance benefits.
Tied to each pension scheme’s circumstances, the trustees were placed in control of funding requirement assessments. Taking advice from their own actuary and from no others in relation to benefits funding, they also had to agree their Statement of Funding Principles with the sponsors and comply with the Pension Regulator’s strictures. Trustees were specifically permitted to set a discount rate which took account of returns on the assets held, but most trustees elected to opt for gilt-based yields. Since 2007, especially after the June 2016 Brexit referendum, those yields became increasingly lower, with correspondingly higher capital values of the perceived liabilities. With actual investment returns having failed to keep pace, the assessed deficits (or shortfalls) became very much higher, with sponsors becoming even less willing to continue the pension scheme.
Because trustees were being told that they needed to match their benefit cash flows, a greater emphasis was placed upon gilts and bonds than real assets. That such asset transfers were made when gilt yields were very low led to real substantial losses.
Indeed research by OECD and Oliver Wyman showed that between 1980 and the mid-1990s, UK pension funds steadily invested between 60-80% of their investments in equities. Since then, UK pension fund’s exposure to equities has steadily declined such that by 2008 the exposure to UK equities was below 40%. In their report, the OECD and Oliver Wyman highlight:
The timing of changes in the regulatory regime and how this coincides with changes to funding regulation – in particular, the introduction of MFR in the mid-1990s coincided with the start of the decline of equity exposure.
Trends in the United States and Netherlands and how exposure to equities in those countries has actually risen slightly over the same period.
Despite the clear trends, there are some schemes bucking them. For example, the BAE Systems Pension Scheme recently noted:
More than 50 per cent of our assets are invested in equities and property… we’ve come to the conclusion that linking to gilts doesn’t make much sense for us.Footnote 18
4.7.3 Insurance interactions with pension funds
Throughout this paper we have generally considered insurance companies and pension funds separately to reflect the different regulatory regimes that apply and the different investment approaches taken.
The authors recognise that in practice the two industries do not operate independently – in particular as pension funds continue to look for ways to secure their liabilities, for example, via buy outs. As such, there are occasions where pension funds in particular are required to quantify and asses their liabilities through an insurance lens.
As such, the linkage between the two industries is subtle but nonetheless real – and any regulatory differences between the two sectors (for example, regulation that presents barriers to insurers to accept long-term pension liabilities) impacts indirectly/directly on the ability of pension funds to de-risk without harming members.
For example, the existence of a matching adjustment for life companies has likely buoyed the bulk purchase annuity (‘BPA’) market, as pension funds continue to value pension liabilities using bonds yields irrespective of asset holdings. Against this, the existence of a matching adjustment also means that this will drive annuity providers taking on these liabilities, whether immediate or deferred, to invest in assets with fixed income flows (including inflation- linked where relevant). This is relevant for deferred BPAs where while in theory insurers could invest in equity / property during the deferred period and move into fixed income once in-payment, not having matching adjustment eligible assets on day 1 would mean that these liabilities would not be eligible for matching adjustment calculations.
4.7.4 Summary of this chapter
In this chapter, we:
Defined the scope of investors that we are considering. In particular we are focused on long-term institutional investors (such as life insurance companies, pension funds and general insurance PPO provisions).
Defined the concept of shortfall risk which fundamentally drives the approach to considering the appropriateness of risk measurement approaches.
Outlined how ‘riskier’ (i.e. more volatile) asset investment returns can become ‘less risky’ if the returns are considered over appropriate time horizons.
Outlined some of the other considerations that are taken into account when institutions determine investment strategies.
5. Risk measurement approaches
In the preceding sections, the concepts of long-term investors and economic shortfall were discussed. Since the cash flow shortfall is considered over a future period of time, it is evident that a vector of cash outflows and inflows should be projected. However, in practice there is enormous emphasis on balance sheet capital, a single-figure measurement. Whilst a single figure is intuitively appealing for its simplicity and familiarity, it can be misleading since it ‘loses’ the full information over the future projection horizon. It also distorts the position with an air of spurious accuracy. Worse, it permits no true reflection of all of the possible risks and rewards.
Nevertheless, this section will initially consider stochastic modelling projections and discounting to a (single) present value of capital.
5.1 Considerations of the risk measurement approach
When measuring risk and making decisions, there are likely to be a number of relevant considerations for an entity in determining an appropriate investment strategy. Those considerations for risk measurement approaches underpinned by stochastic models are outlined below, though many of these will also be applicable to other approaches:
1. The modelling methodology and bases, e.g. valuation methods and bases for liabilities including the discount rate structure selected
2. The projection time horizon of the liabilities: n-year, to ultimate
3. The asset calibrations: MTM on balance sheet date, one-year volatilities, n-year averages
4. The confidence interval applied to the distribution of results e.g. 99.5%
5. The shocks applied, e.g. magnitude, instantaneous/over 1 year/over n years
6. The measure applied, e.g. VaR, TVaR, expected shortfall
7. Communications: Showing stakeholders the range of results with probability curves
The choices made in respect of each of these points can have a material impact on the final result. This paper will discuss mainly the projection horizon, some alternative calibration methods, and considerations related to the modelling methodology and bases.
As previously discussed in Section 4.3, risk measurement approaches can sometimes be objective but are more often subjective. Importantly, however, this does not have to be restrictive – in fact it can be a necessity for a functional market. For an economically living and growing market to exist, it is essential for the risk distribution in the system to be dynamic, in a continuous flux: it needs a variety of players who have differing subjective assessments of value at different times for trading, or exchange of value, for value to flow and thus constitute a healthy financial ecosystem.
Further, no risk measurement approach will be perfect or fully comprehensive in capturing all emerging and/or unknown risks – for example, climate change or artificial intelligence. This shortcoming is not explored further in this paper.
5.2 The use and impact of discounting
Discounted cashflows to a present value are commonly used: both as its own measure/metric/yardstick, but also featuring within other risk measures. Indeed, discounting features in many of the risk measurement approaches considered throughout this paper. Before considering those, we briefly consider the simplifications and limitations of using discounting based approaches.
5.2.1 Discounting for long-term investors
Although the discounting principle has been known for 2 millennia, it was only adopted for longer-term finance in the late 18th century. If it were certain that a return of 3 % pa would be achieved for the next year, 103 due in a year’s time can be financed by an initial 100. By converting future cashflows to the present, it can be seen that the discount rate is the inverse of the investment return. In reality, the financial environment is far less secure, given the lack of certainty, much longer time periods and assets which are far more complex instruments than cash. Because the future is unknowable, no uniquely correct interest rate can be defined in advance. There is, in fact, one uniquely correct view of the future but this is not known in advance so that assumptions are needed.
Risk quantification is very poorly captured by scalars. Specifically, single numbers are not appropriate results for representing many future uncertainties, especially when we do not even specify what the result represents (e.g. the mean, median, mode, or a specified percentile?). Rather, multi-dimensional results with confidence intervals provide information which a deterministic approach based upon discount rates cannot convey.
Risks are only taken because potential rewards may reasonably be anticipated (depending upon the circumstances). If discount rates are used, then they need to be consistent with investment returns. Otherwise, systematic bias is introduced, which is a major problem with accounting numbers. While the stakeholders (including regulators) may want the results to be ‘prudent’, that can only be defined in relation to a ‘best estimate’ benchmark. Where the liabilities are longer than the assets, using bond yields alone may even be imprudent.
While capitalisation was the original actuarial tool, which was all we had, it is no longer the only tool available and it obscures more than it reveals (the ‘scalar impact’). Discount rates are simple and simplistic, readily available to anyone and dangerous in both the ‘wrong hands’ and the ‘right hands’. For long-term projects, the authors recognise that using discount rates alone is limited and it is more optimal to consider cashflows using a robust stochastic process, for which the technology is readily available.
5.2.2 Allowance for investment returns within pension scheme valuations
Although specifically permitted by legislation, pension scheme funding valuations in the UK typically do not make an allowance for expected investment returns in the discount rate used to value the liabilities. If they were to do so, then schemes could take credit within their liabilities for investing in growth assets. This could be seen as encouraging pension schemes to adopt a longer term investment perspective and allowing them to seek the greatest return over the long term. It also reduces the focus on short-term volatility. The drawback of this approach is that the valuations of the liabilities are dependent upon the assets held, which can be difficult to explain but the effort needs to be made. The ‘liabilities’ are really the estimated cashflows rather than the capital amount. Thus the liabilities do not depend upon the discount rate.
The discount rate used in pension scheme accounting valuations is based on the yields of high quality corporate bonds. ‘In 2003, the implementation of FRS17 was intended to quantify the true risk of a corporate pension promise. It was originally based on the premise that the credit spread between an AA rated corporate bond and a gilt represents a “small premium above the risk free rate”’Footnote 19 . However, the margins can be higher and gilt yields are not risk-free. Crucially, it would take alchemy to make the basic cashflows risk-free.
The risk that the assets are insufficient to meet the liabilities rests with the scheme sponsor(s). If there is a shortfall, a plan has to be agreed and put in place to ensure that the liabilities can be met as they fall due. Again, investment returns are often allowed for within these plans and therefore some of the shortfall is effectively assumed to be met through investment returns. This again encourages a focus on long-term investment returns.
5.2.3 Allowance for investment returns within long-term insurance regulatory valuations
Prior to the introduction of SII and the UK’s ‘twin peaks’ reporting regime, liability cash flows were typically discounted using a valuation discount rate based on the expected returns from assets backing the liabilities, less an allowance for risk.
The twin peaks regime was the first step towards a financial economics valuation approach. In particular, realistic reporting under the twin peaks regime required with-profit liabilities to be valued on a risk neutral basis (‘Peak 2’ basis) and this valuation is compared with liabilities valued on a discount rate based on the risk adjusted returns from assets backing the liabilities (‘Peak 1’ basis). The primary purpose for introducing this regime is to recognise the fact that it was difficult to assess the level of prudence implicit within the Peak 1 basis and the Peak 1 basis does not make allowance for the time value of guarantees of embedded options nor adequately reserve for bonus payments in line with policyholder’s reasonable expectations.
Under SII, the reporting regime requires liabilities to be valued on a market-consistent basis and liabilities to be discounted using the European Insurance and Occupational Pensions Authority’s (EIOPA) risk-free curve. The use of a risk-free discount rate curve can be viewed as a short cut for creating replicating portfolios and modelling the risks inherent from investing in these assets. Following industry lobbying, EIOPA included an allowance for matching adjustment and volatility adjustment to ensure appropriate treatment of insurance products with long-term guarantees as part of the long-term guarantee measures. The inclusion of a matching adjustment recognises the fact that annuity writers follow a buy-to-hold investment strategy and are therefore not exposed to the illiquidity premium part of the spread movement. The purpose of the volatility adjustment on the other hand is to prevent pro-cyclical investment behaviour as a result of short-term bond spreads widening. The use of a matching adjustment and volatility adjustment is subject to regulatory pre-approval (this restrictive handling has been criticised by industry).
5.3 Time horizons of the cash flows
Long-term investors are concerned about risk over the full term of their liabilities rather than solely the short term. Most financial firms will project their business over longer time-frames than one year, and it would be logical if the risk measurement approach focussed on the ultimate risk.
For long-term insurance business, the requirements of the SII regime were described in Section 4.7. The most prominent criticism of these rules is that they specify capital requirements to be calculated over a one-year period:
Given the length of a life insurer’s liabilities, it is highly likely that the construct of 1 Year VaR will fail to capture the path dependency of risk factors beyond the 1 Year period. Footnote 20
Assets such as equities, properties and corporate bonds can be very volatile over a one-year period but may actually be more suitable for longer term investment.
For long-term investments, runoff approaches consider the adequacy of the investment portfolio to meet all required cash outflows when they fall due. Specifically, they do not necessarily value all the assets at instantaneous market values, nor require the present value of the portfolio to equal or exceed the size of funds needed to liquidate or trade the whole portfolio on a full mark to market basis on a given date. There are a variety of variations of runoff approaches. In runoff approaches, real-world stochastic models are frequently used for the forward projections, and a VaR measure is then applied to the distribution of the results. Portfolio runoff approaches have been more popular in practical use in General insurance / Casualty insurance and in North America than in life insurance in UK/Europe.
Skerman noted in his 1973 paper: Market values, particularly for equity shares, are too volatile for the purpose of steering the finances of an insurer over the long term because they vary with the market’s assessment of future prospects as regards earnings and dividends …. It is probably better to discount the current income associated with assumed rates of growth in the future.
This quote suggests that under a run-off approach then a long-term value could be given to equity shares by discounting the expected income stream. Under this approach asset valuations would be less affected by short-term volatility. Organisations would have less need to sell risk assets on market downturns and this would also be a benefit in reducing pro-cyclicality.
This is a very attractive scenario in terms of improving investment markets’ resilience to such shock events.
The main concern voiced by opponents to such an approach is the subjectivity of any method which values an asset as a different value to its market price. It would likely not be possible to gain universal approval of an asset valuation method for liquid assets that departs from the traded market value. However, notwithstanding what is in some quarters accepted as dogma, complex situations do require interpretation. An interpretation can be value adding providing that it is independently formulated (refraining from too common groupthink), takes account of all available evidence, provides cogent full explanations and enables different stakeholders to understand the potential outcomes.
An alternate area where we may learn from history is the regime which pre-dates SII. Prior to the introduction of SII, the UK’s equivalent risk-based approach was governed by the Individual Capital Assessment (‘ICA’) regime. The time horizon for assessing the capital requirements under ICA as set out by PRU 2.3.14G was ‘… individual capital guidance will be given taking into consideration capital resources consistent with a 99.5% confidence level over a one year timeframe or, if appropriate to the firm’s business, an equivalent lower confidence level over a longer timeframe. Firms should therefore prepare an individual capital assessment on the same basis’.
Under ICA, the regulations recognise that a one-year timeframe will not necessarily be suitable in all circumstances and the use of a run-off approach may be more suited instead. The main challenge with a run-off approach in this context is how to set the equivalent confidence level and still ensuring that projected asset proceeds are still sufficient to meet liability outgo for all projected time periods.
5.4 Market value based measures
Market values (‘MV’) are often used as a risk measurement component through one of two ways:
1) Mark-to-market valuations: the point in time valuation of assets and liabilities. In particular how these compare and the risk that they might diverge.
2) Volatility: the extent to which MVs might fluctuate (usually in an adverse way) over a particular time horizon.
5.4.1 Mark-to-market (‘MTM’)
Mark-to-market valuation approaches seek to provide a market-based assessment of the value of assets and liabilities – or in other words, the price that a market participant would be expected to pay/be paid to take full ownership of both the institution’s assets and liabilities. The use of MTM valuation approaches is widespread – for example, regulatory, accounting or ongoing or funding purposes.
Whilst perhaps not strictly a risk measurement approach, MTM valuations do give a benchmark assessment of solvency that is of particular interest during periods of market stress or upon particular risk events.
The key advantages of MTM approaches are:
Objectivity – in that most MVs for liquid listed instruments are based on actual recent marginal trades. Thus, they are not subjective since they can usually be observed.
Apparent simplicity – the human mind is designed to simplify, and it is easy to digest a valuation as ‘just one number’
Transparency – for listed assets, MVs are publicly available
Immediacy – for listed assets, s are ‘live’ and change to reflect live events and announcements.
However, there are a number of drawbacks with the use of MTM approaches:
Focus on accounting values – changes in the MTM value will not always be representative of changes in the economic substance of one or both of the assets or the liabilities. People’s focus and perceptions of risk might be transiently skewed and this will manifest in volatility in the MTM values.
Focus on short term – related to this, the focus on live and moving MVs might promote too much focus on the short-term. This is especially a concern for institutions with long-term liabilities and investment horizons.
Marginal trades – MVs reflect the objectives and investment circumstances of the investor’s marginal trades. As such, the values are still intrinsically subjective, particularly since these circumstances and objectives are likely to differ not only across institutions but also across different portions of each of the investor’s asset portfolios.
Availability – market prices (or valuation approaches) are only readily available for listed assets. In particular, market prices are not generally available for liabilities or unlisted assets.
Current regulations (in the UK) require pension scheme and insurance valuations to be MTM. However, historically, other approaches have been used – particularly for pension schemes. This has been discussed in Section 5.2 under Discounted cashflow.
5.4.2 Volatility
Volatility is widely used as a risk measure – either directly or indirectly. For example, volatility might be used directly as a risk measure of annual investment risk and potential uncertainty in MVs. Alternatively, volatility is key assumption and feeds through to common risks measures such as Value at Risk (‘VaR’). A description and case study of VaR is given in Table 5.
When considering volatility as a risk measure, it is important to distinguish between:
Historical or observed volatility – as a backward looking measure of the extent to which prices have been observed to fluctuate over a particular period of time.
Prospective volatility – as a forward looking measure of the extent to which prices are assumed (or implied by the market) to fluctuate in the future.
Our focus is primarily on the prospective volatility.
The use of volatility as a risk measure has a number of advantages – in particular it is commonly used, relatively straightforward to understand, plentiful data to set assumptions, and it often makes mathematical models simpler to use and more tractable.
However, there are a number of widely regarded shortcomings in using volatility as a risk measure (particularly over the longer term) including:
Asset returns do not follow a normal distribution.
Correlations and volatilities are not constant – particularly in times of stress which are often of most interest.
Volatility approaches often do not capture the risk of failing to meet objectives.
Volatility measures do not capture the risk of permanent capital loss.
Illiquidity risks are not captured.
It might contribute to pro-cyclicality in that it might discourage the buying of risky assets when prices are low, because these typically correspond to periods of high volatility.
Further, volatility (and measures that depend heavily on volatility assumptions) can be exacerbated by behavioural effects – for example, short-term sentiment, momentum effects, herding behaviour and speculation. For a long-term investor, allowing for these effects in risk measurement approaches, and hence decision making, is likely to be sub-optimal.
These are relevant considerations for short-term investors such as banks, but are often different to what a long-term investor should be interested in.
Risk measurement techniques change over time and since the early 1990s a lot of focus has been about the spread of market sensitive risk management systems for banks, and the spillover of this approach to other financial institutions.
For long-term investors, such risk measurement techniques might not be optimal, because MVs (which are subject to a lot of volatility) are not consistent, reliable predictors of the future and thus not appropriate for long-term financial management.
Table 5. Value at risk description
a Thimann (Reference Thimann2014). How insurers differ from banks: Implications for systemic regulation.
Materials for this table were sourced from the Wikipedia entry on Value at Risk.
5.5 Other risk measurement approaches
Section 5.1 described the components of a risk measurement approach, each of which can materially impact the results obtained. In this section, some variations of the identified components are examined.
The headings considered are Alternative asset calibrations, Mixed and blended approaches, Cost of capital/funding approaches, Probability of success/failure, Alternative confidence intervals and Alternative shocks parameters.
5.5.1 Alternative asset calibrations
It should be obvious that the calibration approach has a key impact on the final result – it determines the magnitude of the framework from which risk is measured.
Point in time (‘PIT’) versus Through the Cycle (‘TTC’) versus Other calibrations
Asset calibrations which do not MTM at a single PIT, i.e. on given balance sheet date, can take the form of factor-based approaches where the factors used are calculated based on market information generated over a longer time period. The calibration period of historical data needs to be sufficiently long, likely substantially greater than 5 years, to capture the whole cycle. This will alleviate over-sensitivity to transient influences, although it can give a flawed picture when the underlying risks are changing rapidly.
The terms point-in-time and through-the-cycle have historically been used by credit rating agencies, and have become more widespread since the early 2000s, when Basel Committee on Banking Supervision (‘BCBS’) documents frequently referred to economic and business cycles.
The concept of ‘through the cycle’ was elaborated by Moody’sFootnote 21 in relation to credit risk:
Through-the-Cycle EDF credit measures are one-year probabilities of default that are largely free of the effect of the aggregate credit cycle, primarily reflecting a firm’s enduring, long-run credit risk trend.
In that paper, the authors state that this method is useful in situations where a stable input is desirable but qualify their view on the application of their approach by opining that it should be evaluated by comparing the expected costs of adjusting the economic (credit) exposures versus the expected cost of negative credit events (defaults).
Thus, they consider the investor’s utility function paramount.
They describe their modelling approaches as distinguishable by ‘the degree to which each approach has a PIT or TTC orientation.’
A PIT approach
utilises all available and pertinent information as of a given date
reacts immediately to all news that affects a firm’s risk
is highly volatile
is pro-cyclical
whereas a TTC approach
primarily reflects a firm’s long-run, enduring credit risk trend
is highly stable over the (credit) cycle
changes smoothly over time, and hence is less volatile and pro-cyclical
is less useful in terms of timeliness and (credit) predictive accuracy relative to PIT measures
The appropriate actions by a firm’s managers will depend on whether the change (in credit quality) is assessed to be permanent or transitory. The authors hold the view that both PIT and TTC approaches are needed for a complete (credit) risk management system.
Other forms of alternative calibrations
In some instances, variations to the standard base case rules exist within the applicable regulation itself. An example is given here:
Conditional calibration of risks
Under SII’s Standard Formula, the base equity shock is 39% for Type I equities (equities listed in countries which are members of the EEA or the OECD) and 49% for Type II equities (all other equity types). The equity shock includes an adjustment to the base equity shock (the ‘symmetric adjustment’) which is capped and floored at +/10%. This adjustment is calibrated based on how the current value of current index has performed relative to the three year average.
Including this symmetric adjustment thus allows a shock in the range of 29% to 49% for Type I equities and 39% to 59% for Type II equities to be applied.
While the primary objective of the symmetric adjustment is to reduce the pro-cyclical effects in times of stress, this is not necessarily an option which is taken up by all insurers nor included within the equity risk calibrations for internal model firms (possibly owing to the equity shock being calibrated independent of current equity levels).
Nevertheless, a shock which is conditional on current conditions albeit with its moderating adjustment restricted to +/-10% has the attraction that it helps to meet the goals of managing cyclical effects.
5.5.2 Mixed and blended approaches
It is recognised that in the majority of cases, long-term funds will have a portion of short-term cash flows, and short-term methods would be appropriate in respect of these. Long-term methods would be superior for the cash flows at the longer end, with a blend of methods in between.
5.5.3 Cost of capital/funding approaches
A common approach used in pension scheme funding is to set funding discount rates, in particular the level of prudence, with respect to the level of confidence in future asset returns. For example, for a given investment strategy, the trustees and advisors may believe that the expected return on the assets over the term of the liabilities is 3.0%pa above inflation. Trustees can then use confidence levels around that expected return to set an appropriate funding discount rate and level of prudence based on the strength of the sponsor. For example, Trustees for a scheme with a strong sponsor may set the discount rate with returns at a 60% confidence level, where they estimate that returns will be at least 2.25%pa say, whereas Trustees for a weaker scheme may choose a 75% confidence level, which may be equal to a discount rate of 1.5%pa say.
This risk measurement approach is based on using modelled scenarios to determine statistical distributions and quantile methods using percentile/confidence levels. A contrasting approach would be to consider a set of existing liabilities, and ask what level of investment returns would be needed to support these liabilities. In particular to consider the total return that is required to support an acceptable probability of meeting liabilities/objectives, for a given starting level of assets. For example, an entity may require a total return of 3.5%pa above inflation in order to be 90% confident of meeting a particular objective.
Articulating the return in this way may be broadly comparable to an entity’s cost of capital which is based on the amount of return, in addition to the amount earned by the enterprise from its investment of capital, that is required for the total return on the investment to be adequate.
5.5.4 Probability of success/failure
This risk measurement approach attempts to simulate business outcomes under a number of scenarios and quantify whether each scenario ‘succeeds’ or ‘fails’.
The approach is underpinned by having a clearly defined and articulated measure of success and/or failure. Such measures are likely to be linked to the entity’s liabilities or risks and their ability to meet these.
A stochastic model is likely to be needed to quantify outcomes in different scenarios. The simulated outcomes can then be considered to demonstrate the risk profile, any trade-offs and the impact that different levers (e.g. short-term investment decisions or pricing strategies) might have on the chances of success.
The Pension Protection Fund adopt a similar approach, as outlined in the case study in Table 6.
Table 6. Case study of probability of success/failure approach
The key advantages of this approach are:
The assessment is linked to the entity’s business and objectives.
As such the time horizon of the investment period reflects the entity’s liabilities.
The key drawbacks of this approach are:
Developing the modelling approach is likely to be a significant undertaking.
The results are likely to be highly sensitive to a number of assumptions that are required.
In particular, it may be challenging to capture assumptions about future management actions that might occur.
It may promote overreliance on the modelling (i.e. false comfort).
5.5.5 Alternative confidence intervals and alternative shocks parameters
It is immediately clear that these values can have a significant influence on the figures calculated. Whilst long-term institutional investors can freely alter these for internal management information purposes, for external reporting there are only limited instances where the regulations might explicitly allow for variations to parameters such as the confidence interval or the shocks to be applied – subject to stringently restrictive conditions. The following case example illustrates this.
An example: For UK insurers – Duration-based equity risk sub-module
EIOPA’s annual review of long-term guarantee measures report 2017 stated:
The standard formula for the SCR includes an equity risk sub-module that captures the risk stemming from changes in the level of equity market prices. The equity risk sub-module is based on risk scenarios that envisage a fall in equity market prices of 39% or 49%, depending on the type of equity.
Instead of that equity risk sub-module, undertakings can use a duration-based equity risk sub-module that is, with regard to certain equity investments, based on a risk scenario that envisages a fall in equity market prices of 22%. The duration-based equity risk sub-module can only be applied by life insurance undertakings that provide certain occupational retirement provisions or retirement benefits and meet further requirements, in particular that the average duration of the undertaking’s liabilities exceeds an average of 12 years and that the undertaking is able to hold equity investments at least for 12 years.Footnote 22
This report highlighted that only one undertaking in France has taken up this measure. We believe that this measure has not been taken up in the UK because the main investors in equity holdings are with-profit funds and unit-linked funds.
In respect of retirement benefits, Article 304 of the SII DirectiveFootnote 23 provides for the application of an equity risk sub-module of the Solvency Capital Requirement, which is calibrated using a Value-at-Risk measure, over a time period, which is consistent with the typical holding period of equity investments for the undertaking concerned. There are a number of stipulations around this, however. In addition to the abovementioned 12 year holding period, all assets and liabilities corresponding to the business must be stringently ring-fenced, without any possibility of transfer.
The SII calibration paper states:
3.117 The directive sets, when considering a 1-year horizon, a level of confidence of 99.5%. Considering a holding period of T years and assuming temporal independence of events, it can be assumed that an equivalent level of confidence is 99.5%T.Footnote 24
The main reason for EIOPA calibrating a lower stress in the context of a longer holding period is the use of a lower confidence level in the VaR assessment as shown in paragraph 5.5.30 above. The 1 year VaR confidence level for a 12 year holding period is therefore equal to 94.16% (99.5%12). There is currently zero take-up in the UK because firms are unable to demonstrate that equities within the portfolio are held on an ongoing basis across the holding period. We believe this is mainly to avoid the risks of lapses or asset switches where the impact of liquidity should be taken into account.
5.5.6 Summary of this chapter
In this chapter we;
Considered the different aspects of risk measurement approaches
Discussed how discounting cuts across almost all risk measurement approaches
Discussed the importance of considering risk measurement approaches that reflect the nature of the liabilities
Considered and appraised different risk measurement approaches – including both those that are commonly used and those that are less used.
6. The view ahead
The preceding chapters have explored the notion of investment risk for long-term investors and described a range of risk measurement approaches. In summary, key points are:
Risk measurement approaches matter
Risk measurement approaches, both those used by entities for economic business management and those mandated by accountants and regulators, and how these measures are used, have a significant impact on perceptions, the investment approach taken and hence on investment actionsFootnote 25 . The dangers of even just distorting ‘the optics’ in reported figures are real – investors might be compelled to trade investments purely to satisfy reporting requirements even when it is economically suboptimal to do so.
The investor is central
Risk depends not just on the investment instrument but also critically on the investor’s objectives and portfolio circumstances.
What constitutes risk depends on the economic objectives of the ultimate investor
Economic fundamentals should be primary
Investment markets are highly complex systems and in practice it is difficult to isolate the impact of regulations and behavioural biases on the investment approach. The main thrust of this paper is that the fundamental economics – in particular the nature of the liabilities – often does not get primacy relative to regulation or even behavioural biases.
The popular zeitgeist is skewed
Customary framing of investment risk for long-term investors tends to provide an over-focus on the shorter term:
a. Investment risk is distinct from market risk – and it is dangerous to confuse these concepts.
b. Liquidity risks tend to be focused on trading liquidity, whereas for long-term investors funding liquidity is usually more important.
Risk avoidance is itself risky
For longer term investors, focus on the short term may lead to significant detriment – as taking too little volatility risk may be inefficient. Investment risk management is not equal to volatility risk avoidance.
Risk has many facets
One size does not fit all – different institutions need different measurement approaches and each individual long-term institution needs more than one approach. In particular, hegemonically deployed paradigms tend to constrict the diversity of perspectivesFootnote 26 needed for appropriate risk management and systemic resilience.
The authors explicitly recognise that much in economics and the social sciences is inherently subjective. That said, the key ideas presented here are by no means new and are shared by both actuaries and other professionals and practitioners.
A shifting landscape
In recent years, the western world has experienced a fluidly changing investment environment, trending towards permanently altered institutional structures and hence new distributions of risk amongst the various investment market participants.
Whilst it is not the authors’ intention to opine on general public policy, we are of the view that risk measurement approaches, and hence risk management frameworks, should be fit for the primary economic purposes – such as long-term wealth building – of the investors considered.
In practice, there are substantial barriers to be surmounted in order to effect any positive functional change. The first step in solving any problem is to understand and recognise it, raise wider awareness and hopefully change the cultural mindsets that created it. Successful change implementation depends on decision makers’ willingness to invest the necessary effort in creating the right incentives for relevant influential stakeholders.
Date of information
It is a cliché that we live in a world with an ever accelerating pace of change. Whilst aiming to focus this paper on enduring investment principles which are resilient to the swings of fashion, the authors are aware that global and local economic, social, political, regulatory and structural developments can alter the risk landscape materially and rapidly, sometimes with medium to long-term impacts. The contents of this paper are based on known updates to December 2018 only.
Acknowledgments
The authors would like to thank the following:
Chris Edwards, Andrew Hague, Dalila Hashim, Cheng Kwek, Arundhati Ghoshal, Elliott Golend and Roelof Coertze for their technical contributions.
Neil Cantle and Matthew Levine for their technical guidance in developing and structuring this paper.
Dawn McIntosh, Donna Meldrum, Chukwudi Onyia and David Raymont for their excellent project support.
The anonymous peer reviewers from the IFoA and the reviewer from the British Actuarial Journal for their helpful inputs.
Disclaimer
The authors explicitly recognise that much in economics and the social sciences is inherently subjective. Views in the paper are those of the various authors, but do not necessarily have full consensus of every individual. Since this paper has not explored the full range of ‘growth’ asset classes* in detail, it is acknowledged that it does not describe the total investment universe for a particular investor.
It should be explicitly noted that for statements of historical fact are not guarantees of future performance and reliance should not be placed on them for the purposes of implementing an investment strategy. Forward projections necessarily involve known and unknown risks and uncertainties, which may cause actual performance and financial results in future periods to differ materially from any past results. The Institute and Faculty of Actuaries and the individual authors accept no responsibility or liability to any person for loss or damage suffered as a consequence of their placing reliance upon any view, claim or representation made in this paper.
The information and expressions of opinion contained in this paper are not intended to be a mathematical model nor a comprehensive study, nor to provide actuarial advice or advice of any nature and should not be treated as a substitute for specific advice concerning individual situations. Inter alia, the investor should commission bespoke advice from authorised investment and legal professionals in respect of their fund’s domicile and areas of jurisdiction.
*For descriptions of asset classes and growth assets, see for example Commonwealth Bank Group.
Appendix 1: Review of UK insurance and UK defined benefit pensions literature
Insurance
Life actuarial valuation principles have evolved significantly since the 1950s with many published papers on this topic. It may be informative to consider how these fundamental principles have changed to those applied in the present day.
In 1952, Haynes and Kirton, as well as Redington presented separate papers to the InstituteFootnote 27 of Actuaries covering similar topics. In Haynes and Kirton’s paper (Reference Redington1952) The Financial Structure of A Life Office studied ‘the principle of “matched assets” in relation to stationary and increasing funds operating under idealised conditions and, secondly, the effect of departure from the idealised concept either by the compulsion of practical conditions or by the voluntary exercise of judgment.’ The authors have emphasised their views that ‘the guarantees of future capital security and of long-term interest yield involved in the contracts issued by a life office should be backed by assets providing equivalent guarantees of capital and interest—except in so far as the absence of complete guarantees can be justified by the presence of free reserves available to meet any loss which may arise.’
Redington’s paper (Reference Redington1952) Review of the principles of life-office valuations, although written independently of Haynes & Kirton’s paper, had similar considerations. In particular, Redington viewed the word ‘matching’ to have wide and general meaning that he suggested using the ‘word “immunization” to signify the investment of the assets in such a way that the existing business is immune to a general change in the interest rates.’ Redington summarises the essence of immunisation theory as two rules and a rider. These are:
‘Rule 1. The mean term of the value of the asset-proceeds must equal the mean term of the value of the liability-outgo.
Rule 2. The spread about the mean of the value of the asset-proceeds should be greater than the spread of the value of the liability-outgo.
Rider. The mean term of the asset-maturity dates is considerably greater than that of the value of the asset-proceeds.’
Redington outlines in his paper that immunisation implies that a change in asset values is followed by a corresponding fall in liabilities, but this is only true if the underlying liabilities are valued on this method. The author cites the example where net premium valuations are far less responsive, when compared to gross premium valuations, to changes in interest rates. In particular, Redington considers that the immunisation theory, whilst mathematically tractable, could have some practical constraints including the application of the theory to non-risk-free assets such as equity shares, properties and so on.
Redington also examines in his paper the purposes of actuarial valuation. In his view, there are two main purposes of actuarial valuation. These are: (1) to ensure the life office remains solvent, and (2) for surplus to emerge in a way which is equitable and suited to the bonus system. Redington observed that these principles are often in conflict with each other. He observed a further area of conflict being the valuation of assets and liabilities where he noted that while the value of the former is more speculative; it was the valuation of liabilities that has ‘acquired most of the attributes of an equity valuation. It is an interesting train of thought to consider what the valuation process would be if we adopted a similar basis for both assets and liabilities.’
From these papers, we observed that the building blocks of actuarial valuation in this period relates to asset matching to liabilities, as well as considerations for liabilities to be valued in a consistent manner. Some of the matching principles continue to be practiced today whereas the valuation of liabilities consistent with those assumed for assets, barring matching adjustment principles, have generally been replaced by market consistent principles.
We have also examined more recent papers published by Skerman in 1966 (A Solvency Standard for Life Assurance Business), 1973 (The work of a life office actuary in the United Kingdom: Recent Developments and A look into the Future) and 1984 (The responsibility of the Actuary for the Adequacy of Life Insurance Reserves). These papers primarily focus on the principles of reserving and solvency. The following are some useful excerpts to note from these papers:
Skerman, Reference Skerman1966, A Solvency Standard for Life Assurance Business:
The essence of the financial operations of a life office is that it receives premiums, interest and other items of income and undertakes liabilities to pay claims, expenses and other items of outgo. There is no means of ensuring with absolute certainty that it will be able to meet its liabilities-it is inevitably vulnerable to extremely adverse mortality experience and financial conditions. All that can be hoped for is a solvency standard which will ensure that it has every reasonable prospect of fulfilling its obligations.
It is not practicable to assess the solvency position of an office by reference to a series of payments of income and outgo and, in order to arrive at a standard which can be used in practice, it is necessary to compress these payments into present values. This is the concept underlying the comparison of the value of the assets and of the liabilities but, for this comparison to be meaningful, an appropriate relationship must exist between the rate of interest underlying the valuation of the assets and that used in valuing the liabilities. Without such a relationship the results of a valuation have no mathematical meaning and can in practice be seriously misleading.
Skerman, Reference Skerman1973, The work of a life office actuary in the United Kingdom: Recent Developments and A look into the Future:
21. The valuation of equity and property, which may together represent more than 50% by market value of the assets of a United Kingdom life assurer, presents a special problem when calculating the estate. What is needed is an assessment of the discounted value at the valuation date of the future income from these investments. Market values, particularly for equity shares, are too volatile for the purpose of steering the finances of an insurer over the long term because they vary with the market’s assessment of future prospects as regards earnings and dividends for equity shares and as regards rents for property. It is probably better to discount the current income associated with assumed rates of growth in the future.
28.2. How to distribute increases in the capital value of equities and properties. The method of distribution of these changes will depend on how closely the insurer wishes benefits under with-profit policies to follow changes in market values. Competition from investment-linked contracts creates pressure towards following market values closely but on the other hand, while policyholders would welcome following them upwards, they would feel differently about following them downwards and on balance might well prefer a fair measure of smoothing.
Skerman, Reference Skerman1984, The responsibility of the Actuary for the Adequacy of Life Insurance Reserves:
A realistic actuarial valuation in essence consists of determining the discounted value of a flow of income and outgo in the future. Our techniques enable us to value any flow which can be clearly defined but, for different reasons, considerable problems exist in defining the future flow for a life or non-life insurer or for a pension fund.
The records of a life insurer provide details of the assets, the contractual benefits and the gross premiums which enter into the future flow of income and outgo. These details, however, fall far short of defining the future flow and considerable uncertainties remain as to the data to be valued.
5.4 future income from variable income securities such as equities, properties and index-linked gilt-edge securities. By means of the difference in yields from these securities as compared with the gilt-edge yield, market values implicitly indicate the expectations of the market as to the future growth, or possibly decline, in the income from variable income securities. This indication provides a basis for alternative assumptions.
We observe from the historic valuation methodologies that these approaches are likely to value risks in a more stable manner compared to financial economic methods by attempting to ensure consistency between the valuation of assets and liabilities. While there are some drawbacks from this approach, chiefly the risk of not adequately recognising the ability of volatility to force a crystallisation of losses as contingent extreme tail liabilities fall due (for example, through a mass lapse event), the inherent benefits are that they recognise the long-term nature of liabilities and therefore the investor is less exposed to short-term market noise by having a consistent approach to the assets’ and liabilities’ valuation components.
The papers above pre-dates the application of market consistent valuation approaches, which have grown in favour with insurers for more than a decade. The use of market consistent valuation techniques become more common following the introduction of Market Consistent Embedded Value principles by the Chief Financial Officers (‘CFO’) Forum and also used within Solvency II guidance. The application of market consistent valuation approaches, whilst having many desirable principles and features, is not without issues, particularly during economic crises. A paper by Kamran Foroughi on this topic (Reference Foroughi2012), Market-consistent valuations and Solvency II: Implications of the recent financial crisis enables the reader to understand the implications for insurers from the use of this approach with a focus on the impact it has on investment decisions.
Foroughi noted in his paper that the displacement in the financial markets following the crisis has raised challenges, both commercial and technical, to the implementation and application of market consistent valuation. However, it was viewed at the time that the use of market consistent techniques will continue to grow through Solvency II and The International Accounting Standards Board and The Financial Accounting Standards Board (‘IASB’/‘FASB’) develops. Foroughi was of the view ‘the recent financial crisis has, in particular, highlighted the need for capital-based metrics, such as projections of cash flows, return on capital and internal rates of return’ and that ‘the financial crisis has led to a number of difficult technical challenges and to companies adopting a broader range of methodologies and assumptions under the ‘market-consistent’ banner’.
Foroughi’s paper also focused on the inclusion of a liquidity premium with market consistent valuation principles with suitable restrictions and the calibration to market prices for traded options where the market exists and if sufficiently deep and liquid. He also raised in his paper a macroeconomic concern that market-consistent frameworks could lead to pro-cyclicality where falling market values could threaten insurer’s solvency and drive insurers to sell higher risk assets to fund purchases of lower risk assets, and offered the following mitigating measures that could be considered:
1. Stakeholders (including regulators) should base decisions on multiple metrics and not just a market-consistent valuation framework and should use judgement in assessing the relevance of each metric to the decisions being made.
2. Stakeholders should recognise that theories such as the efficient market hypothesis do not hold, particularly at times of financial crisis, and hence enable some flexibility in the valuation of assets and liabilities.
3. The regulatory framework should enable flexibility in the capital requirements (i.e. capital required to be held in addition to that required to meet market-consistent liabilities) at times of financial crisis, to ensure that enforced regulatory or management actions recognise the potential short-term nature of the financial crisis.
4. On the other hand, the onus is on stakeholders to ensure capital requirements in benign financial times are sufficient to absorb losses during financial crises, taking into account levels of asset liability mismatch risk.
We note from our review of Foroughi’s paper that while market consistent valuation principles may have desirable traits and also the way forward for Solvency II and accounting valuation methods, it also may be informative for insurers to come up with alternative metrics as well to ensure decisions made take consider long-term factors and not just influenced by short-term fluctuations.
UK Treasury Select Committee enquiry into The Solvency II Directive and its impact on the UK Insurance Industry (2016 – 2017) – Key Excerpts
Oral Evidence: EU Insurance Regulation, HC 852
Andrew Chamberlain (Chairman of the Life Board, IFoA):
Q17 There is a trade-off between the level of security and the price the consumer has to pay for that insurance—it is an insurance against the failure of the insurance. The price the consumer has to pay for that is something that they will not get a choice in. That choice is made by the regulatory system.
One of the things that I think has perhaps been wrong is that regulators have been allowed to make that choice. A regulator asked to make that choice, particularly with the objectives they have, is going to make the most conservative and prudent version of that.
Q21 Myself and my colleagues would take the view that the PRA is being unnecessarily rigid in this area. The volatility adjustment’s main purpose is to try to remove some of the exposure to the cycles; by, in the internal models, declining the ability for the company to estimate the change that would take place in that adjustment, the PRA is removing one of its positive features. It is not a well-designed tool in the first place because it is fairly crude but taking away some of its effect is a big mistake.
Q34 Kit Malthouse: I wanted to ask about pro-cyclicality. Does the standardisation in Solvency II and the fact that everybody involved has to take into account the same risk factors in accounting for regulatory capital mean that, when there is stress on the economy, all insurance companies across Europe will start dumping corporate bonds and equities at the same time?
Andrew Chamberlain: Inevitably, that can arise. It is most particularly a problem when you have constraints on the investment policy; the matching adjustment, as we discussed earlier in this meeting, has been one of those constraints.
Pro-cyclicality on insurance needs to be thought about very deeply because it usually arises from balance sheet tests. The way in which regulators can or should react in times of balance sheet stress is what actually determines how quickly or otherwise companies would react. The previous UK regimes contained a great deal of flexibility in this regard and lots of loss-absorbing layers were allowed whereby if, for example, as we saw in 2008-09, corporate bond spreads went wildly wide, people were not expected to assume that that all represented the fact that the entire UK economy was about to melt down and every company you have heard of was about to default. Nobody considered that was a likelihood. It was a temporary supply-demand equation within markets.
All the Solvency II regime is based on the idea of market consistency, but market consistency as a concept depends on deep and liquid markets. In times of crisis, markets are not deep and not liquid. How you react to that change is important.
Q39 Chair: But if you want the markets to be policed for systemic risk, do you not want them to be out there saying, ‘If you don’t behave yourself, if you let your balance sheet weaken, the price could be penal’?
Andrew Chamberlain: The regulator, in my view, should be looking at the real risks to policyholders. When there is a temporary market dislocation, as has happened several times in the last 20 or 30 years when there is some general perception of crisis, you do not want the failure of institutions to be triggered.
Q10 Mr Jacob Rees-Mogg: One of the difficulties with the standard model is when the business is not standard, and it therefore doesn’t make any sense to have the standard model.
Q42 Kit Malthouse: The issue is the standardisation across Europe: there is not the flexibility between nations around particular risk factors. It is the standardised approach that causes the problem, and the cumbersome nature of EIOPA.
Written evidence submitted by Legal & General Group plc (SOL0009)
127. The implementation of Solvency II is acting in the opposite direction to the stated aims and likely outcome of IFRS. IFRS 4 phase 2 provides for a stable balance sheet and profit emergence, with flexible buffers that absorb fluctuations in experience. In contrast, Solvency II has fixed buffers which result in balance sheet volatility.
3. Balance sheet volatility & definition of Solvency Capital Requirement: The current formulation of the Solvency II balance sheet results in significant volatility in regulatory surplus. This is partly due to the risk margin, but also due to the strict use of a 1-year horizon for the capital assessment, which may be inappropriate depending upon the position in the economic cycle. We recommend calibration such that the total capital resource requirements are less sensitive to the economic cycle.
Written evidence submitted by Aviva PLC (SOL0023)
3. However, there are problems with some of the technical aspects of Solvency II, and the way that it is implemented in the UK, that create unnecessary costs, reduce the competitiveness of UK insurers, and hamper the UK insurance industry’s role in providing stable long-term investment. In the context of Brexit, and the need for investment in UK infrastructure and economic growth, it will be more important than ever to ensure that these problems are addressed so insurers can fulfil their sustainable investment role.
9. …one of the key lessons of Solvency II is that implementation and supervision is just as important as getting the design right. In that context, it is important that the PRA has appropriate objectives to require it to take account of wider economic benefits, and to maintain a level playing field for UK insurers operating internationally, …
Paragraph 22. Notes potential impacts on consumer product choices towards ‘…product(s) where all the risk is borne by the consumer (and hence does not attract regulatory capital).
27. … The most important tool for dealing with any macro-prudential shortcomings in this respect is to provide for sufficient flexibility and regulatory forbearance to allow for a reasonable recovery period so that insurers are not forced to take action to respond to temporary falls in market prices that have no bearing on their ability to meet their long-term liabilities.
Written evidence submitted by Prudential plc (SOL0042)
In our view, Solvency II fails to reflect adequately the long term nature of the liabilities in many UK life insurance products, and the volatility in its estimates of insurers’ solvency can reflect short term factors which have no relevance to an insurer’s ability to meet claims. This has a number of damaging consequences. Managing the volatility incentivises behaviour which may not be in line with prudent risk management. The requirement to hold additional capital is driving some areas of activity off shore (outside the EU), while also hampering firms’ ability to innovate and provide customers with a broad range of products. It also puts EU-based companies operating outside the EU at a disadvantage with competitors whose primary regulators are outside the EU. Moreover, the regime as a whole creates a high degree of complexity and pro-cyclicality which could increase systemic risk (by encouraging all insurers to take similar de-risking activities at the same time) and which run directly counter to policymakers’ original objectives. This complexity, together with the use of internal models, and the fact that companies from different countries are allowed to use different bases to calculate yield curves and estimate the path to the last liquid point of the relevant curve, mean that there is also a lack of consistency which prevents genuine comparability of different firms’ solvency positions.
As a result, so-called market-consistent valuation techniques are used to create an artificial proxy for this market value. These techniques are neither stable nor verifiable for the full range of assets and insurance liabilities. Embedded within market-consistent valuation methodologies is the fundamental belief in the efficient market hypothesis (i.e., that at any given time and in a liquid market security prices reflect all available information; it is not possible to know that you could know more than the current price). Short-term fluctuations in the market value/market-consistent value of liabilities may lead to changes in the artificial proxy that is used to ascertain the market-consistent yield curves (which necessarily often extends well-beyond any yield curve duration ascertainable from risk-free assets traded in deep and liquid markets). But such fluctuations often represent little real information as to the likely path of future interest rates.
VaR has become a near universal measure within financial services to assess the financial risk associated with portfolios in normal market conditions over a specific timeframe and at a given confidence level. It was largely developed in the 1990s by commercial and investment banks who used it in the first instance to evaluate the market risk on their trading books. It was principally used on the asset side of the balance sheet and given an enormous boost by JP Morgan’s decision in 1995 to allow access to their own data on variances and co-variances across various asset classes.
There are major problems in applying this construct to insurance. Given the length of a life insurer’s liabilities, it is highly likely that the construct of 1 Year VaR will fail to capture the path dependency of risk factors beyond the 1 Year period. This is a highly significant constraint given the number of dynamic management actions which can be taken over the lifetime of the liabilities, the effect of which would then need to be re-modelled.
Furthermore, valuing a long term business on a 1 Year basis is at odds with the time horizon of a going concern enterprise or the new requirements for directors to provide a long term viability statement in the annual report, since it says little about the ability of an insurer to meet its liability-related cash flows as they fall due.
Another difficulty in applying VaR to insurance again relates to the length of liabilities which will compound the difficulties of the non-stationarity of the data underpinning the model.
What is fundamentally wrong about market-consistent frameworks is that by relying on market prices (albeit sometimes modified) to derive an estimation of solvency, they induce volatility in the results. In theory, current market data using a market-consistent framework should allow for a forward looking view as to how the world is likely to evolve in the future. However, in practice markets have not been good predictors of the future and have often over-reacted to short term changes. This makes such a framework particularly unsuitable for valuing long term illiquid liabilities, the value of which are essentially unknown and uncertain. The more unstable and volatile the valuation method, the more problematic it is to restrict the timeframe to one year – because it will take longer to discern the ‘signal’ from the ‘noise’.
Within Europe, the Solvency II attempt to build a market-consistent solvency system belatedly recognised [these] shortcomings and has sought imperfectly to correct for them through the introduction of the Matching and Volatility Adjustments. It is far from clear that these mechanisms will work in practice, given their complexity. But these are ‘fixes’ for a ‘problem’ of policymakers’ own construction.
What consequences follow from adopting such an approach?
1. Focusing on the fluctuation in this market-consistent-value over a 1 year timeframe harms policyholder protection and will lead to the misallocation of resources within the economy. …..
Restrictions imposed by matching adjustment requirements create unhelpful incentives for annuity investments. Solvency II has resulted in innovative and more complex financial structuring to make assets ‘matching adjustment friendly’ (e.g. decomposing property assets into income strips and residual property values due to the need for asset cashflows to be fixed unconditionally to be matching adjustment eligible). This type of activity does not lead to any reduction in investment risk. Indeed, the additional complexity adds operational risk, creates asset valuation challenges, reduces transparency and adds cost.
Written evidence submitted by Institute and Faculty of Actuaries (SOL0026)
40. …more focus on solvency through the run-off of the liabilities rather than resolution would be helpful and could be of more benefit to policyholders.
52. Adherence to a Financial Economic view of the world has at times been too theoretical and dogmatic. All market consistent methods depend for their validity on a deep and liquid market. Experience in 2007-8 and since has shown deep and liquid markets are perhaps the exception rather than the rule.
Volatility Adjustment (‘VA’)
28. A further adjustment is the Volatility Adjustment. A VA can apply to insurance products which are not eligible for the MA. It is a mechanism, albeit only of limited effect and artificial in application, that allows liabilities to be reduced on a prudent basis when asset values are particularly low. It does so by adjusting the risk-free interest rates used in liability calculation. The VA is determined centrally by EIOPA using a published reference portfolio of assets.
29. HMT decided that firms should have to seek regulatory approval before using the VA, since automatic approval might encourage firms to take excessive risks during economic upturns that could turn into losses during economic downturns (pro-cyclical behaviour). While the IFoA did not oppose the need for regulatory approval, we note that not permitting insurers to use a VA could also lead to pro-cyclical behaviour, in which insurers would become forced sellers in an economic downturn. In some EU states, use of a VA does not require regulatory approval.
30. We believe that it would be appropriate for the ‘emergency’ VA approval to be granted where necessary. There could be circumstances where it would be in the public interest for an insurer to take corrective action quickly, where a significant change of circumstances made this necessary. This could arise if the MA failed, for example, and emergency VA approval may reduce uncertainty for current and prospective policyholders if it mitigated failure.
31. We also believe that the VA should be permitted to vary in assumed stressed conditions i.e. it should be treated as dynamic rather than fixed.
Impact on equity investment
138. Regulatory constraints may have unintended consequences for some insurers’ investment strategies. Market consistent approaches have discouraged investment in equities other than where the policyholder bears the risk, such as on unit-linked business. This can be both positive and negative:
▪ it is positive as it discourages firms from giving over-generous guarantees and ensures de-risking can take place at short notice. It has also forced UK insurers to reflect gradually the fall in yield curves and to avoid the need for measures such as the Ultimate Forward Rate, which anticipate a return to higher yields in the future; and
▪ it is negative in the sense that it discourages long term investment in risky assets. For example, if the objective is to generate strong real returns with say a 20 year investment horizon then equities are a good asset as over this time period their returns are likely to be highly correlated with long term inflation impacts. However, SII imposes a one-year horizon for capital and over that time period equity returns may be strongly negatively correlated with inflation.
Impact on infrastructure investment
134. The MA should in theory incentivise investment in long-term illiquid investments such as social infrastructure. However, again we have some concern about whether this is happening in practice. As discussed under Question 2, the MA as currently implemented in the UK gives rise to a number of practical issues, which can include the need to carry out restructuring of assets to achieve MA eligibility. As with internal models, insurers potentially face the need to submit a revised application for MA approval for material new asset classes.
135. The standard formula capital requirement under SII as originally designed did not reflect the secure nature of high-quality infrastructure investments. However, in September 2015 EIOPA published advice proposing a separate asset class to capture high quality infrastructure under the SII Standard Formula. This approach should encourage increased infrastructure investment by reducing risk charges for qualifying investments in both equity and debt.
136. SII also introduces a ‘Prudent Person Principle’ for insurance company investment, which removes restrictions on investments provided they are prudent and in the interests of policyholders. This could support larger asset allocations to infrastructure and other alternative asset classes.
137. Furthermore, the IFoA believes that UK’s insurance regulation framework could promote more infrastructure investment by insurance companies if the liquidity requirements were relaxed. These requirements are appropriate for short-term investments, but infrastructure investments are generally long term in nature, and realistic investors would not demand the same level of liquidity. We recognise that liquidity risk must be controlled, but the need for more investment means that differential treatment for infrastructure is reasonable in our view. We also believe that the PRA should issue guidance designed to encourage these investments (which are natural matches for long term insurance products).
Further written evidence submitted by the Association of British Insurers (SOL0050)
Treatment of Equity Release Mortgages and other illiquid assets: …there are a range of socially useful asset classes (including equity release mortgages and infrastructure) that insurers are well-placed to invest in. It is important that an overly prescriptive approach to Matching Adjustment eligibility does not undermine this.
Written evidence submitted by Willis Towers Watson (SOL0040)
3.2.1 The insurance industry acting as a capital provider to the markets
Traditionally, the UK insurance industry has acted as a capital provider to the market by investing the premiums received from consumers into government debt and more illiquid assets, including corporate bonds, infrastructure and lifetime mortgages to consumers. There are two long-term life insurance products which are particularly suitable to provide funding for such investments: retirement annuities and with-profits business. To differing degrees, the predictable liability cash flows within these products enable insurers to invest in illiquid assets and pass some of the additional proceeds on to consumers.
This investment by insurers in illiquid assets to back liabilities with predictable cash outflows helps serve society by reducing pro-cyclicality effects in the wider economy. Certain aspects of the Solvency II rules discourage investment in certain asset classes and encourage investment in others potentially causing unhelpful distortions given the scale of investments made by insurers. For example:
▪ Within the retirement annuity market, we have seen certain asset classes become ineligible for the matching adjustment (which is designed to recognise the illiquidity premium under Solvency II) and insurers have rebalanced their portfolios to focus on assets that are eligible
▪ Within the with-profits market, we have seen a general move towards the swap market and away from other asset classes because Solvency II uses a swap-based risk-free rate. We are aware of some insurers that have sold a significant proportion of their government bond assets and instead purchased a swap-based asset portfolio in order to improve matching with their liabilities.
These trends lead to:
▪ Reduction in the extent to which the insurance industry can act as a capital provider in certain markets
▪ Distortions in insurers’ demand for bond-like assets. In particular, there is reduced demand for assets that were previously attractive and suitable for matching annuity liabilities but are not eligible under the matching adjustment (other than using costly and complex structuring techniques) such as callable bonds, lifetime mortgages and corporate bonds and infrastructure debt with certain features.
Non-level playing field between insurers within the EU
While one key aim of Solvency II was to harmonise regulation across the EU, our anecdotal observation is that in practice different regulators have applied different approaches to ensure companies are Solvency II compliant.
We believe that Brexit provides the UK with an opportunity to address this issue.
Appendix: Suggested amendments to Solvency II
…Reduce asset and liability matching adjustment eligibility restrictions, using a principles-based approach. For business falling outside the matching adjustment, remove or reduce the focus on the swap market as the primary determinant of the risk-free rate used to discount the liability cash flows. These adjustments would re-incentivise companies to invest in a wider range of assets, including both government bonds and a more complete range of illiquid asset classes covering corporate bonds, infrastructure and lifetime mortgages to customers.
Pensions
What is examined below is the historical evolution of pensions schemes valuation methods, with some attention also given to other disciplines. Little account has been taken of US literature, where the US actuaries embarked on that path some years earlier than UK actuaries.
So far as we have been able to determine, almost all of the recent literature sponsored by IFoA has been centred on financial economics. By that, we mean that financial conditions as at a relevant date are assumed to continue to hold unchanged forever, with volatility being treated as risk – contributing to deficits. However, the concept (today forever) also assumes that there is no volatility, an inherent illogical contradiction.
Although listed for completeness, Hatchett & Forrester (Reference Hatchett, Bowie and Forrester2010) and Kemp & Patel (Reference Kemp and Patel2012) both deal with applying enterprise risk management, as opposed to assessing future financial risks. Similarly, Franzen (Reference Franzen2010) or Ai, Brockett & Jacobson (Reference Ai, Brockett and Jacobson2015) are also listed.
The papers considered in more detail are taken in chronological order.
Puckridge (Reference Puckridge1948) This was a fairly traditional pensions paper, except for the revolutionary idea that assets might be treated in a similar way to the liabilities (end of § 3). This was not generally accepted by those present. Although Heywood said he personally favoured book values, but that relief might sometimes be gained by writing up the assets as suggested, he had changed his mind by 1961 (see below). It should be noted that equities only became commonly held pension fund assets later on in the 1950s (sparked off by George Ross Goobey).
Redington (Reference Redington1952) This paper was actually about life offices rather than about pension funds, but it is most famous for the immunisation section. One of Redington’s essential points was that, if implemented, such a process would immunise against profits as well as against losses.
Heywood & Lander (Reference Heywood and Lander1961) Although this paper is generally assumed to be the source of assets being treated in a similar way to the liabilities, that had actually been Puckridge’s contribution. By 1961, equities had become far more important but assessing their value is not really attacked (see Day & McKelvey). On the other hand (§ 10), equally as important, they stated that the net liability in a pension fund valuation may be regarded as having a frequency distribution, something which needs to be given much greater attention.
Day & McKelvey (Reference Day and McKelvey1964) As previously mentioned in relation to Dyson & Exley (Reference Dyson and Exley1995), this paper was a successor to Heywood & Lander, addressing how equities should be valued for valuation purposes. In Reference Gilley and Funnell1958, Gilley and Funnell had written a SIAS paper, quoting Puckridge.
Arthur & Randall (Reference Arthur and Randall1990) Although Dyson & Exley (Reference Dyson and Exley1995) is commonly thought to be the first relevant UK paper in the ‘financial economics’ series of papers on pensions, Arthur and Randall had written an earlier paper, with a focus on recognising asset mismatching within an actuarial valuation. While certainly connected with pensions risk, we believe it is not related to assessing risk in the context of investment shortfall risk.
Thornton & Wilson (Reference Thornton and Wilson1992) They suggest (§ 4.1) that ‘realistic’ could mean that bases should reflect the real world rather than some special actuarial view of the world. Safer ground requires the ‘best estimate’, meaning a figure which is equally likely to be too great or too small. TS Shucksmith stated that the cost of defined pension benefits is unknown and uncertain, which could be represented by a probability distribution, a concept which had been suggested by Heywood & Lander but not widely recognised. In contrast, the financial economists appear to attach too much certainty to current asset values. In closing the discussion, GR Farren picked up on R Brimblecombe’s comments about the meaning of best estimate. While that could represent equal chances of success or failure, failure would be disastrous and success merely fortuitous so that, perhaps, the relative probabilities in § 10.10 should be skewed with these outcomes in mind. That would then no longer be the best estimate.
Dyson & Exley (Reference Dyson and Exley1995) Discussed in London and later in Liverpool, they were solely addressing how equities should be treated for valuation purposes, with Day & McKelvey taken as a starting point. The authors wanted to bring market values into account, with index-linked gilts assumed to be the correct proxy. In the London discussion, SJ Green asked what new piece of information had become known on 19 October 1987 which had not been known three days earlier. That is an answer to the authors’ statements that the market provides rational prospective expectations and that the market uses best forecasts available at the time, implicit in market pricing of assets.
Exley, Mehta & Smith (Reference Exley, Mehta and Smith1997) Very well-known, this paper has greatly influenced the UK actuarial profession.
➢ They mentioned (¶ 3.4.1) the problem of only showing one scenario as a simplification of the reality of a large number of alternative possibilities in the non-deterministic world out there, asking how the chosen scenario should relate to the spread of possible outcomes. However, they did not follow that up, remaining with net present values instead of ALM.
➢ They claimed (¶ 4.1.2) that the market is already implicitly pricing future receivables from a vast number of alternative investment vehicles, whence they arrive at the concept that the price of an untraded cash flow stream, such as a pension promise, may be taken as the estimated quoted value of similar cash flow streams, by comparison with traded assets such as bonds or equities. This is not fully accepted by UK actuaries.
➢ They challenged (¶ 5.4.7) the faith in the principle of time diversification of risk. However, they appear not to have been familiar with ‘path dependence’.
Gordon (Reference Gordon1999) This was a well-written Staple Inn Actuarial Society paper. The author appears to have assumed that the value at a point is robustly reflective of what may happen over the long term. This concept comes up again and again throughout the literature.
Gordon & Jarvis (Reference Gordon and Jarvis2003) Relating to UK experience, this is a well-written, accessible paper, presented in Canada. Although they stated that financial economics could be applied to long-term entities, that was not explored. This point is so fundamental that it is unfortunate that it appears never to have been addressed. Although they quoted Shiller as concluding that equities will not always out-perform bonds, no one ever suggests that will happen (‘straw man’).
Patterson (Reference Patterson2003) Found via Whelan, he compared the traditional actuarial approach with the financial economics approach. At the end of the paper (page 25), he spelled out 5 non-exhaustive criteria which, together, would point towards financial economics. Otherwise, his view was that the financial economics approach had not yet made the traditional approach obsolete.
Carne (Reference Carne2004) Presented to Staple Inn Actuarial Society, this paper was called Being Actuarial With the Truth and attracted a full audience, with many conflicting contributions offered. A written record would have been interesting, but the policy has been not to record discussions in order to encourage vigorous debate. The author did not dismiss financial economics, especially as described by Exley, Mehta and Smith, as irrelevant. Rather, the application of financial economics to long-term entities was regarded as unsound, and this idea was well presented.
Exley, Mehta, & Smith (Reference Exley, Mehta and Smith2004) That the evidence does not prove the presence of mean reversion is not determinative that short-term readings must be paramount.
Whelan (Reference Whelan2007) He refuted the idea that equity risk dissipates over longer periods, another common theme. He defined the risk measure as the financial impact of experience being worse than expected. Since the algebra appears to have been based upon a stable financial environment over long periods, which condition might not hold true, it is not persuasive.
Chapman, Gordon & Speed (2011)
➢ At the beginning of the paper (§ 1.2.2), the authors stated that their model had been calibrated to market conditions. No recognition can be discerned that market conditions at any point in time might not be indicative of the long-term future.
➢ They correctly observed (§ 2.3.3) that, within actuarial valuation reports, the actuary does not usually set out how risk is quantified, whose risk it is or what level of risk is acceptable.
➢ They stated (§ 2.4.3) that ALM can only produce ‘funnels of doubt’, just demonstrating long-term uncertainty. However, using capital values alone totally excludes any appreciation of the uncertainties, which can reasonably be considered a much worse approach.
➢ They sought cleaner and clearer actuarial advice (§ 3.1.1), a worthy target. However, by advocating the ‘same market-consistent basis’ for all recipients (§ 3.1.2 (2)), they did not recognise that speedy changes in market conditions over time could distort those results.
➢ They stated (§ 3.3.2) that the ‘long-term view’ omits explicit consideration of the risks attaching to investment. That may have been true in the past but does not necessarily hold at the present time.
➢ Short-term risks are considered important (§ 3.3.3) because this is the end of the spectrum at which disclosure and the regulators bite. There is no reason why that needs to exclude consideration of the long-term.
➢ Although (§ 3.4.1) they repeated the assertion that accrued pension liabilities (excepting mortality risk) can be priced by a bond portfolio, we are unaware of any proof that this is necessary.
Appendix 2: Range of risk categories
This appendix outlines one possible categorisation/description of the different risks faced by an investor. Other possible descriptions and definitions of risk categories are possible. The key risks covered in this paper are outlined below.
Market risk or systematic risk – market beta
This is the ‘undiversifiable’ risk associated with investing in the market that affects all securities. Typically it is assumed that this risk can be measured by the volatility or standard deviation of market values and/or returns.
For the purposes of this paper, market risk is distinct from Investment Risk, which is more the aggregation of all risks outlined in this appendix and for a long-term investor is based on the risks associated with investing to meet long-term liabilities. The key theme of this paper is that Investment Risk is the key risk (and not market risk) for these investors.
Market risk applies to all asset classes and so to some extent the market risks faced by an entity can be further split or categorised differently – for example, for bonds these can be categorised as interest rate risk, credit risk, and currency risk.
Interest rate risk
For investments in bonds, the interest rate risk is the risk associated with the fall in capital values of bonds caused by increases in interest rates. For an institutional investor, changes in interest rates are likely to affect the assessment of their liabilities, and so interest rate risk may also refer to the relative risk (i.e. the difference between interest rate sensitivity on the asset and liabilities), rather than the absolute interest rate risk.
Credit risk
Is the risk of incurring a loss on an investment owing to the failure of a counterparty to meet their obligations – for example, a borrower not meeting the coupon or redemptions payable on a bond.
Business or issuer risk
The risk associated with a particular security – hence the risks posed by the ‘business’ that is being invested in. Inevitably there will be correlations between securities in the same industry – as they are likely to be influence by a common set of factors (e.g. input prices or regulation). These risks can generally be diversified by investing in a wide range of securities.
Currency risk
The risks arising from a change in the price of one currency against another – in particular in terms of the way in which this affects the value of overseas investments held. The risk is likely to be different over short and long-term investment horizons as shorter term volatility in exchange rates tends to reflect differences in interest rates between economies, whereas long-term trends are likely to reflect structural differences between economies (such as productivity / trade barriers / import & export demand).
Trading Liquidity risk
Trading liquidity risk (i.e. an investor’s ability to trade) is the risk of not being able to buy or sell investments in sufficient quantities and without excessive haircuts as and when desired because marketplace opportunities are limited. In particular, an ‘illiquid’ investment would tend to be associated with taking ‘more’ liquidity risk as the opportunities to trade in sufficient quantities are more limited.
Funding Liquidity risk
Funding liquidity risk refers to an entity’s ability to continue to function as a going concern, i.e. to meet both anticipated and unanticipated immediate net cash outflow needs (arising from either the liabilities or the assets), and avoid permanent impairment. For example, the risk of an insurer needing to meet mass surrender values (where there are no or inadequate market value adjustments in the contracts) or a small pension fund with little or no new money inflows or alternative funding resources meeting sudden large benefit payment outflow. When considering this risk, the investor needs to cater for rare uncertainties and simultaneous risk events – such as mass surrender occurring immediately after a market crash creating trading liquidity risk and subsequently precipitating market risk morphing into investment risk.
Liquidity risk arises from uncertainty regarding the investment horizon or asset holding period, the correlation across the cash flow demands of market participants, loss of participants’ confidence and interventions of external stakeholders.
Reinvestment risk
This is the risk of investing future proceeds from investments at a lower return than that originally anticipated. This risk is particularly prevalent in falling interest rate environments.
Inflation risk
This is the risk that the value of an asset or the income received from the asset is eroded by the effect of inflation over time.
To the long-term investor, a shortfall could occur if the total investment return is lower than the targeted real return, thus a so-called ‘safe’ asset which is likely to preserve original capital but simultaneously likely to fall short of preserving the investor’s purchasing power over the targeted time horizon might in fact be highly risky with regard to investment risk (as defined).
Other risks
In addition to the key risks outlined above, an entity is likely to be exposed to a number of other risks, for example:
Instrument specific risks – for example, there may be a call risk associated with the risk that bonds are redeemed early.
External risks – for example:
Legislative/regulatory risks of a change in permissible assets or changes in tax-exempt status.
Uncertainties not foreseeable, for example, mortality rate changes resulting from new medical technologies being invented.
Political or social risks.
There may also be a number of liability related investment risks – such as:
Horizon risk – the risk that there is a change in the liability/investment horizon.
Liability noise – the risk that cashflow requirements change. The prominent example of this is demographic experience such as mortality or longevity varying from that which is modelled.
Behavioural risks – for example, by individual policyholders of an insurer
Appendix 3: Asset class liquidity
Section 4.4 mentioned that measures of liquidity might include an evaluation of marketability. This appendix outlines a tentative initial consideration of how this might be done.
Marketability
The trading activity of the major asset classes: stock and long-term treasury notes (greater than 11 years) was compared both in terms of the overall trading volume and the turnover with respected to the value of issuance outstanding.
Figure A1 compares the monthly trading volumes for stocks and long-term US Treasuries since the start of this century:
Figure A1. Trading volumes stocks vs long-term UST Data for this Figure A1 was sourced from The Securities Industry and Financial Markets Association (“SIFMA”), US Treasury Trading Volume.
The solid grey lines compare the trading volumes for equities and long-term US treasuries. The trading volume for long-term treasuries is relatively small compared to the equities indicating that the size of the equities secondary market is large. Further, the growth trend in the equities trading volumes is significantly steeper than the long-term US treasuries (equities slope parameter is almost four times higher) signifying that equities have a strong trading volumes growth trend.
The monthly turnover ratios lines on the chart provide a relative measure of the trading in the long-term US Treasuries proportional to the total value of US Treasuries outstanding and the equities trading volume proportional to the market capitalisation. The turnover ratio in the long-term Treasuries is higher than equities as Treasuries are a more traded asset class. However, since the financial crisis there has been a steep decline in the turnover ratio as the level of government borrowing increased significantly even though the trading volume itself has largely remained steady. On the other hand, the stock market turnover ratio has remained relative stable since the start of this century with a brief period of increase during the financial crisis as the market capitalisation had significantly reduced. The trend in the turnover ratio clearly signifies the improvement in equity turnover relative to the long-term US Treasuries. Further, the high turnover ratio during crisis suggests that even though asset prices reduce, the trading activity has broadly similar or slightly higher level of trading volume compared to other periods suggesting that trading liquidity does not significantly deteriorate during the crisis.
Considerations of other liquidity components: resilience and immediacy
Apart from marketability, the other two are resilience, wherein assets’ prices are not significantly impacted by the level of market activity, and immediacy, wherein the time to complete transactions is low. In ‘blue sky ideal’ asset classes, bid-ask spreads (if any) would remain thin and volatility moderate for sizeable trades, and sufficient volumes in the asset class’ market would diminish the time taken to complete transactions.
In the developed listed equity markets, marketability and immediacy are generally good but resilience is often considered inadequate for life insurers. Whilst options are used to hedge the equity market stock index, this can increase hedging costs and thus materially reduce returns. Other asset classes which are more resilient tend to be less immediate. This current position leads some analysts to conclude that major changes in institutional structure might be needed to resolve these issues.


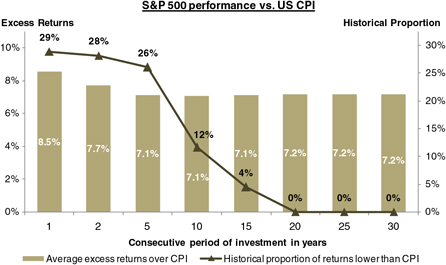

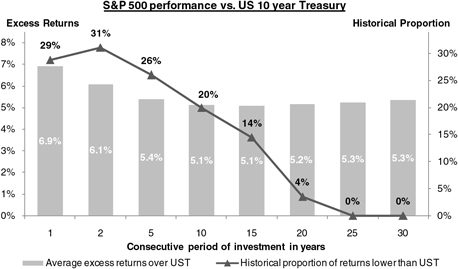


 Open access