


1. Introduction
After the era of liberalisation of the capital markets and of the insurance industry in the late 80’s, European insurance companies are today implementing the new Solvency 2 prudential rules, while Swiss insurers have been applying the Swiss Solvency Test (SST) for several years now. Both regulations are intended to be risk-based and to address the deficiencies stemming from the market liberalisation. However, discussions on the subject mainly concern the pertinence of the different measures proposed or the cost of upgrading the companies to fit Solvency II requirements. Contrary to the heated debates during the elaboration of risk-based solvency regulations, scant attention is paid today to the profound changes represented by these regulations in terms of corporate management.
In this paper, we want to highlight some of the developments experienced by the insurance industry, pointing to some difficulties and evolutions in the enterprise culture and organisation. It is done from the point of view of a practitioner who lived through many of these changes and who has also tried to theorise this evolution to best accompany them for preparing the insurance of tomorrow. Here, we shall explore some of the key features in this development and propose ways of improving it, based simultaneously on the experience of a large international reinsurer and on our understanding of the challenges ahead of the insurance industry. The points made here apply to both insurance and reinsurance companies as risk management does not essentially differ in both organisations. Bankers were the first to think about the role of capital for controlling risk (see, for instance, the seminal book of Matten, Reference Matten2000; Bernstein, Reference Bernstein2007). There is a vast literature on risk management both in banks (Crouhy et al., Reference Crouhy, Galai and Mark2001) and insurance companies (Shimpi et al., Reference Shimpi, Durbin, Laster, Helbling and Helbling1999) or for a more modern version of quantitative risk management (Embrechts et al., Reference Euler2015). However, there is no book or review paper that describes the fundamental changes the industry is going through and discusses its consequences on companies’ organisation and culture, particularly the role of actuaries. Here we want to make the reader, actuaries, insurance economists, risk managers aware of the transformations and the questions facing the insurance of the future.
The insurance industry has a long history and its contribution to the expansion of the European economies in the 19th and 20th century is significant (see, for instance, James et al., Reference James, Borscheid, Gugerky and Straumann2013). Today, it is still an essential component of a healthy development of the economy. For many years, corporate management was limited to the management of cash-flow. As long as the premiums received and the financial returns exceeded the payment of claims and overheads, the company was considered to be profitable and thus solvent. The performance indicators derived from this approach were, and still are, the combined ratio (claims plus costs in the numerator, divided by the premiums in the denominator) in P&C insurance and the technical margin (the ratio of gross revenue to premiums and financial returns – to claims paid) in life insurance. Even today, these performance measures are paramount in corporate communication and media coverage.
However, financial market pressure, banking regulations and the new risk-based insurance regulations, are leading to the gradual introduction of other performance measures such as return on Risk-Adjusted Capital (RAC) and return on equity (ROE), all of which are related to the concept of the risk underwritten by insurers. This means not only knowing the positive cash-flow position, but also whether the return obtained on a given contract is commensurate with the risks incurred. The notion of capital thus becomes a central issue. This capital must be correctly evaluated and allocated to the underwritten business. This implies profound changes in both the mindset and organisation to meet these requirements. Life insurance companies were the first to introduce statistical methods to calculate their premiums based on mortality tables, which were already popular at the end of the 19th century. The actuarial calculation of premiums and insurance reserves became widespread and has continued to develop up until the present time. However, actuaries were usually confined to very narrow areas and did not participate directly in corporate management. They were asked to evaluate the reserve requirements and calculate premiums but were never asked for advice on the type of business to be developed or the return on the underwritten business.
The introduction of risk management at the executive level of insurance companies has completely changed the perspective and role of actuaries who are traditionally responsible for quantitatively evaluating the risks. Company managers must now pay attention to both the new performance indicators and manage the company’s capital. Market pressure is reinforced by regulatory requirements to encourage companies to rethink their operating methods and business model.
In the following section, we will start by discussing the concept of capital, its definition, pointing out the distinction between available capital and RAC. We also examine its different usage and its management. In the third section, we discuss economic valuation and look at the controversy it has generated. In the current interpretation of the new paradigm, it is at the heart of the computation of RAC. In section 4, we describe the internal model used to generate the RAC and some ways it can be validated. In section 5, we present enterprise risk management (ERM), which is the way the modern organisation copes with the management of capital and more generally of risks. In the last section, we conclude by summarising the features marking the evolution of the insurance industry, to finish in opening up to its future.
2. Risk Capital and its Management
Central to this change of paradigm is the concept of risk capital, the management of which is becoming a key issue for an insurer’s management activities. In discussing the concept, we will also highlight two problems related to its definition and computation: the economic valuation of liabilities and the mathematical definition of RAC based on probability distributions.
In the early 1990s, the notion of risk capital became prevalent in banks under the influence of the Basel Committee and the introduction of risk regulations. The notion was extended to insurance companies and other financial institutions shortly afterward, at the beginning of the last decade. Today, capital management is high on the agenda of corporate management bodies. Capital is seen as a guarantee to customers that the financial institution will meet its obligations up to a certain level of probability (generally 99% for banks and 99.5% for insurance companies). It is therefore not ancillary but represents the “commodity”, as it were, used by companies to generate business and profits. As a result, risk capital must be managed so as to optimise the company’s performance. This means that its allocation cannot be treated as a peripheral issue; on the contrary, it must be at the very core of insurance business management, like that of banks (for further discussion in this respect, see, for example, Matten, Reference Matten2000; Bernstein, Reference Bernstein2007).
2.1. Risk capital and solvency ratio
Capital is used by insurance companies as a guarantee that they will pay the policyholder beyond the average claim for this type of policy but only up to a certain pre-determined limit which has a very low probability. The question that naturally follows is how much capital the company needs to cover the risks in its portfolio and within what timeframe? At this stage of our reasoning, it is useful to define two types of capital that will play an important role not only in determining the company’s solvency but also in managing its performance objectives. First, there is the available capital, C e , which is sometimes called the economic capital (EC) on the company’s balance sheet, and second, there is the minimum capital required by the company to cover the risks in its portfolio, called the “Risk-Adjusted Capital” (RAC), C r . This capital corresponds to the amount determined by an actuarial estimation of the combined risk of the insurer’s assets and liabilities. The company’s solvency ratio, S, is then defined as:
 $$S\,\colon{\equals}\,{{C_{e} } \over {C_{r} }}\,\gt\,1$$
For a company to be solvent, this ratio must obviously be >1, but mathematically, it can, of course, be <1. The time horizon generally chosen is 1 year. This applies to both Solvency 2 and the SST. Here, we are going to discuss both the numerator and the denominator of S. This ratio is of paramount importance in determining an insurance company’s solvency. Since under Solvency 2, companies are required to disclose this ratio, it is becoming an important measure for bank analysts and a marketing tool for companies.
2.2. Available/EC and RAC
To define the various forms of capital, let us consider a financial institution whose value can be expressed in terms of the economic value of its assets, A and of its liabilities, L. The time evolution of these two variables is expressed in terms of two stochastic processes:
 $${\bf A}\, {\equals}\, \left( {A\left( t \right),\,t\geq 0} \right) \ {\rm and}\ {\bf L}\, {\equals}\, \left( {L\left( t \right),\,t\geq 0} \right)$$
defined on a probability space: (Ω;
 $$ {\cal A}; \ {\hbox{\it I\hskip -5pt P}}$$
). The value of the institution at any point in time t is then described by the stochastic process V=(V(t), t≥0) defined by:
$$ {\cal A}; \ {\hbox{\it I\hskip -5pt P}}$$
). The value of the institution at any point in time t is then described by the stochastic process V=(V(t), t≥0) defined by:
 $$V\left( t \right)\, {\equals}\, A\left( t \right){\minus}L\left( t \right)$$
In the new solvency rules, the economic or available capital, C e is defined as the company’s current economic value, based on the assumption that it will not underwrite any more business the following year. That is, at an instant t:
 $$C_{e} \left( t \right)\, {\equals}\, V_{e} \left( {a\left( t \right)} \right){\minus}V_{e} \left( {l\left( t \right)} \right)$$
where V e is the function giving the economic value of a variable. The EC is then the value of this process at a point in time t, that is why we write the asset and the liabilities with small letters as they are realisations of the processes A and L. This value differs from the economic value calculated by an investor when buying a company. To the value defined in equation (2), the investor would add an economic valuation of any future business the company is likely to underwrite and the resulting profits of it. As a result, V e , does not strictly represent the economic value of the company. It is simply the conversion of an ordinary balance sheet into an economic balance sheet. V e enables the computation of C e from the different components of the balance sheet without any other consideration of the company’s future business than the interest rates to discount the cash-flows. We will not go any further into V e , which deserves a paper of its own. Some of the problems related to the economic valuation of liabilities are discussed in section 3.
We now consider the definition of the denominator of equation (1), noting that the definition of C e should be compared with that of C r . We shall see in section 2.3 that the available capital, C e , must be adjusted when C r is defined as it traditionally is in the theory of risk, that is, as the variation with respect to the mathematical expectation:
 $$C_{r} \, {\equals}\, {\hbox{\it I\hskip -5pt E}\left[ X \right]{\minus}\rho \left( X \right)$$
where X represents the random variable of the change in the company’s economic value at time horizon Δt. This is usually the sum of the random variables of all the risks of the assets, n A , and liabilities, n L valued economically, defined as
 $$X\left( t \right)\, {\equals}\, \mathop{\sum}\limits_{i\, {\equals}\, 1}^{n_{A} } \left( {A_{i} \left( {t{\plus}\Delta t} \right){\minus}A_{i} \left( t \right)} \right){\plus}\mathop{\sum}\limits_{j\, {\equals}\, 1}^{n_{L} } \left( {L_{j} \left( {t{\plus}\Delta t} \right){\minus}L_{j} \left( t \right)} \right)$$
and ρ is the chosen risk measure, generally the Value-at-Risk (VaR) or the mathematical expectation of the losses over a certain threshold (TVaR). We have omitted here for convenience the function V e , which should be read implicitly. It should be noted that X(t) is nothing else than the change in C e at time horizon Δt
 $$X\left( t \right)\, {\equals}\, C_{e} \left( {t{\plus}\Delta t} \right){\minus}C_{e} \left( t \right)$$
It can therefore be seen that C r and C e are indirectly related and that the definition of one affects the definition of the other.
We notice here that the solvency regulation definition of C r differs from equation (3). It is simply defined as
 $$C_{r}^{S} \colon {\equals}\, {\minus}\rho \left( X \right)$$
The argument being that this is the policyholder’s point of view: when basically the capital is called on when P&L becomes negative. The definition given in equation (3) for C r could be seen as the RAC from the shareholder’s point of view, which is ironically of course more onerous. In the next sub-section, we discuss this issue and point out the dangers of the regulatory definition.
2.3. Consistency between RAC and EC
If C r is defined by equation (3), then equation (2) will not be sufficient to define C e , that is, to convert the ordinary balance sheet into an economic balance sheet in order to obtain the EC. To do this, the mathematical expectation of the profits for the time horizon considered must be added to the value considered:
 $$C_{e} \, {\equals}\, V_{e} \left( A \right){\minus}V_{e} \left( L \right){\plus}{\hbox{\it I\hskip -5pt E}\:\left[ X \right]$$
Not doing so would be like refusing the gift of a lottery ticket whose profits, even if they are low, are represented by
 $$ {\hbox{\it I\hskip -5pt E}$$
[X]. In this case, equation (3) becomes: C
r
=
$$ {\hbox{\it I\hskip -5pt E}$$
[X]. In this case, equation (3) becomes: C
r
=
 $$ {\hbox{\it I\hskip -5pt E}$$
[X] while C
e
=0 (no pre-existing capital, only a lottery ticket), which would mean a solvency ratio of nil. On the other hand, if we accept that the EC C
e
contains future profits, that is, that C
e
follows equation (6), the offer of a lottery ticket would be acceptable because the RAC would be offset by the equivalent available capital and the solvency ratio would therefore be equal to 1 (we summarise in Table 1 the various definition and solvency ratio). This example shows the importance of having coherent definitions when calculating a solvency ratio.
$$ {\hbox{\it I\hskip -5pt E}$$
[X] while C
e
=0 (no pre-existing capital, only a lottery ticket), which would mean a solvency ratio of nil. On the other hand, if we accept that the EC C
e
contains future profits, that is, that C
e
follows equation (6), the offer of a lottery ticket would be acceptable because the RAC would be offset by the equivalent available capital and the solvency ratio would therefore be equal to 1 (we summarise in Table 1 the various definition and solvency ratio). This example shows the importance of having coherent definitions when calculating a solvency ratio.
Table 1 Schematic vision of the example of the gift of a lottery ticket.

In the case of Solvency 2, it could be thought that the problem is solved because the capital, C
r
, is defined directly as minus the VaR at 99.5% of X(t), and not according to equation (3). However, removing this expectation does not solve the problem at all. In this case, it becomes possible to reduce artificially the capital requirements simply by being over-optimistic about future income and therefore increasing
 $$ {\hbox{\it I\hskip -5pt E}$$
[X], since the computation of the risk capital is for the next year. By a simple translation effect, the VaR, and therefore the C
r
, will be reduced by an equivalent amount. Being over-optimistic about future profits has consequences. It means that C
r
can be reduced by paradoxically increasing the company’s risk level because the profit expectations are unrealistic. Being over-optimistic about the profit expectation, undoubtedly increases the risks. From a healthy risk management viewpoint, this simplified definition of C
r
does not seem relevant. This paradox, however, has not been noticed by the European supervisory authorities. Although the SST’s definition of C
r
uses another risk measure (TVaR) with another confidence interval (99%), the same problem exists because it does not take the mathematical expectation of the profits into account.
$$ {\hbox{\it I\hskip -5pt E}$$
[X], since the computation of the risk capital is for the next year. By a simple translation effect, the VaR, and therefore the C
r
, will be reduced by an equivalent amount. Being over-optimistic about future profits has consequences. It means that C
r
can be reduced by paradoxically increasing the company’s risk level because the profit expectations are unrealistic. Being over-optimistic about the profit expectation, undoubtedly increases the risks. From a healthy risk management viewpoint, this simplified definition of C
r
does not seem relevant. This paradox, however, has not been noticed by the European supervisory authorities. Although the SST’s definition of C
r
uses another risk measure (TVaR) with another confidence interval (99%), the same problem exists because it does not take the mathematical expectation of the profits into account.
It therefore seems that it would be better in terms of incentive to change the definition of EC according to equation (6) and keep the definition of equation (3) for the RAC.
2.4. Problems with the current solvency definitions of capital and the need of buffer capital
We will not dwell any further on how to calculate the EC based on the ordinary balance sheet. The Solvency 2 rules are very precise in this respect (European Commission, Reference Embrechts, Frey and McNeil2015: 49–57). We will simply indicate certain issues that have not been resolved and which open the way to various interpretations that are presently under heated discussion. One of these is the choosing of which interest rate should be used to discount liabilities (Dacorogna, Reference Dacorogna2012). At present, whether we are talking about the European Insurance and Occupational Pensions Authority (EIOPA) or the Swiss Financial Monetary Authority (Finma), the supervisory authorities publish their own yield curves to be used by insurers to discount liabilities instead of choosing those deduced from the latest financial market values according to the “mark-to-market” principles. Another question is whether the available capital is really “available” under stress conditions. In other words, the liquidity of the means available to a company under stress is a subject of concern, leading regulators to classify bank capital from most liquid (first tier) to least liquid (third tier) with requirements concerning the proportion of capital covered by each of these classes. The treatment of dividends and deferred tax assets also cause controversy that we will not develop here.
The lack of precision in defining the EC also applies to C r . We saw earlier that the supervisory authorities did not choose a strict definition from a risk theory viewpoint; risk measure also differs from one system to the other (for a comparison of Solvency 2 and SST, see Dacorogna & Keller, Reference Dacorogna and Keller2010). Apart from the strict definition of C e in equation (2), the RAC, C r , also depends on two other choices: that of the risk measure (VaR, TVaR) and that of the interval at which it is measured (99.5%, 99%). It would be much better if practices could be harmonised and the industry come to a universally recognised definition. Unfortunately, we do not seem to be heading in that direction on an international level given the present discussions between the American and European authorities on the subject.
Each company must nevertheless decide for itself how to optimally deploy its capital based on its own strategy and the method it has chosen to allocate its capital to different risks. To do so, insurers must adapt their practices while satisfying the requirements of the shareholders, the supervisory authorities, the rating agencies and the specific conditions relating to their business. The triangle of constraints constituted by profitability, solvency and market penetration becomes the space to be optimised. These three constraints are interrelated of course and one cannot be determined without considering the other two. Whence the question: how much capital is needed to satisfy these different requirements? The art of capital management is to determine the amount required to give shareholders adequate remuneration while ensuring the company’s stability and financial credibility, while ensuring sufficient market penetration. For this reason, the current tendency of insurers is to communicate publicly on both a ROE target and an interval for the solvency ratio defined in equation (1). These two objectives go hand in hand and cannot be defined independently of each other. The equation derived in Besson et al. (Reference Besson, Dacorogna, de Martin, Kastenholz and Moller2008) gives us a simple expression that relates the target return, T, chosen by the company to its solvency ratio, S:
 $$T\, {\equals}\, {\mu \over S}$$
where μ is the risk premium allocated to the industry by the market at a solvency ratio of 1. An illustration of this equation is given in Figure 1 where we have chosen a μ of 1,700 basis points above the risk-free rate. This high value is due to the fact that the market does not expect insurance companies to operate at this level of solvency but at a much higher levelFootnote 1 . Finally, the insurance company’s management must decide on the amount of capital needed for its strategy according to the variables T, μ and S, as explained in Besson et al. (Reference Besson, Dacorogna, de Martin, Kastenholz and Moller2009).
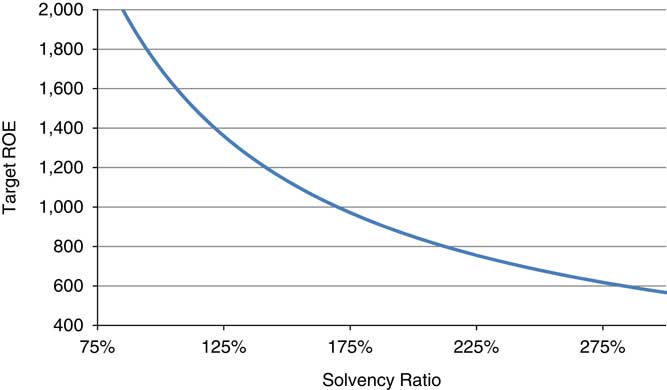
Figure 1 Illustration of the relationship between the company target return on equity (ROE) (above the risk-free rate in basis point 0.01%) and its solvency target.
The management’s task will therefore be to manage the capital so as to best satisfy the various insurance stakeholders, all of whom have contradictory viewpoints. They are rapidly described below:
1. The shareholders for whom the capital represents the value of their investment and would like to keep it as low as possible in order to obtain the highest possible return.
2. The policyholders and the supervisory authorities want to obtain the highest possible insurance capital because it guarantees payment of the liabilities contracted with the company.
3. The rating agencies who conduct an assessment of the financial health of insurance companies to ensure that their credit risk is sound. They expect the company to have sufficient capital to deserve its rating but they also check on its profitability.
4. The management and staff who use the capital to generate the company’s profits and also must satisfy the requirements of all the other insurance stakeholders.
Constant balancing is the daily lot of modern companies seeking to adapt to new market conditions and benefit from the new rules governing the insurance sector, while developing their business over the long term.
3. Economic Valuation of Liabilities
The basis for evaluating the capital and risks of the insurance industry is the economic valuation of the company’s assets and liabilities. We have just seen that the available capital is defined in the Solvency 2 rules as the difference between the economic value of the assets and liabilities, equation (2). The question of economic valuation has been at the centre of many controversies and debates among insurance practitioners and academics for many years (see Babbel & Merrill, Reference Babbel and Merrill1998, and the discussion afterwards). It has been introduced to provide insurance companies with a method that would appeal to investors and to bring transparency and market consistent valuation, for insurance, liabilities as well as for assets. The financial crisis of 2008/2009 and the drop in interest rates has brought many criticisms to economic valuation. In this section, we will review some of these problems. However, despite these problems, economic valuation remains fundamental for a realistic modelling of the risks of insurance companies and provides a good basis for comparison between assets and liabilities. We believe it is here to stay even though progress for the economic valuation of long-term liabilities is certainly needed.
3.1. The law of one price and the replicating portfolio
The economic valuation of assets is fairly simple provided they are being valued in sufficiently liquid markets. In this case, determining the economic value means finding the market price of the assets concerned. In accounting jargon, this is known as “mark-to-market”. However, the situation becomes complicated when assets have to be valued in markets with low and even non-existent liquidity. This is the case for certain derivative products that are traded in over-the-counter markets, or structured products such as CDOs (Collateralized Debt Obligations). During the 2008/2009 financial crisis, some of these assets no longer found buyers and the institutions that owned them or sold them to state-owned funds were forced to value them according to models based on underlying asset prices. It is the famous “mark-to-model” that enabled the savviest, such as Goldman Sachs, to slip through the net (Sorkin, Reference Sorkin2010).
We have just mentioned the difficulty in valuing non-liquid assets. The problem is significantly increased when it comes to insurance liabilities which are not usually traded on the marketFootnote 2 . This was the subject of numerous discussions during the implementation of Solvency 2. To understand what is involved, it is important to briefly review the valuation of insurance liabilities. The two main principles are as follows:
1. The existence of liquid markets for assets and therefore of verifiable information on their prices.
2. The law of one price or single price law which says that: “whatever the future state of the world, two financial instruments with identical cash-flows will have the same market price”.
If it can be applied, this law means that the price of a financial instrument can be easily estimated by finding a combination of liquid instruments that together reproduce the cash-flow. This is the idea of the replicating portfolio whose origin lies in an article published by the Swiss mathematician Euler (1767) who used this type of argument to discount life annuities. This approach actually consists in shifting the problem of how to determine the value of an instrument without a market, such as insurance liabilities, by looking for liquid instruments whose market prices are easily accessible and reliable, and for which information can be obtained directly. It would work perfectly except that insurance liabilities are subject to violent stochastic variations resulting in considerable uncertainty as to the final result of a policy. These variations do not have any negotiable equivalents on financial markets. The risks related to these cash-flows therefore need to be evaluated and a risk margin introduced that will be added to the value of the replicating portfolio. The risk margin is defined as the cost of the capital that the owner of the liabilities will need to immobilise until natural expiry of the policy in order to offset fluctuations not covered by the replicating portfolio.
3.2. Problems with replicating portfolios and risk margins
Figure 2 is a diagrammatic representation of the valuation process for insurance liabilities. It shows that the problem can be divided into two parts. First, choosing the instruments that will make up the replicating portfolio, and second, correctly evaluating the remaining risk once the choice has been made. Only then can insurance liabilities be valued correctly. To give the reader a flavour of the problem, we highlight a discussion between the insurers and the supervisory authorities recently concerning the first point (choice of assets) without considering its consequences on the second point (risk margin) (see among many consultation papers: EIOPA, 2014). The three choices examined by the EIOPA with the insurers’ help were as follows:
1. Using the risk-free rate for replicating portfolio instruments.
2. Adding a premium to the risk-free rate for the lack of liquidity of these liabilities in favour of the insurer who holds them.
3. Adjusting the discount rate to the assets actually owned by the insurer.
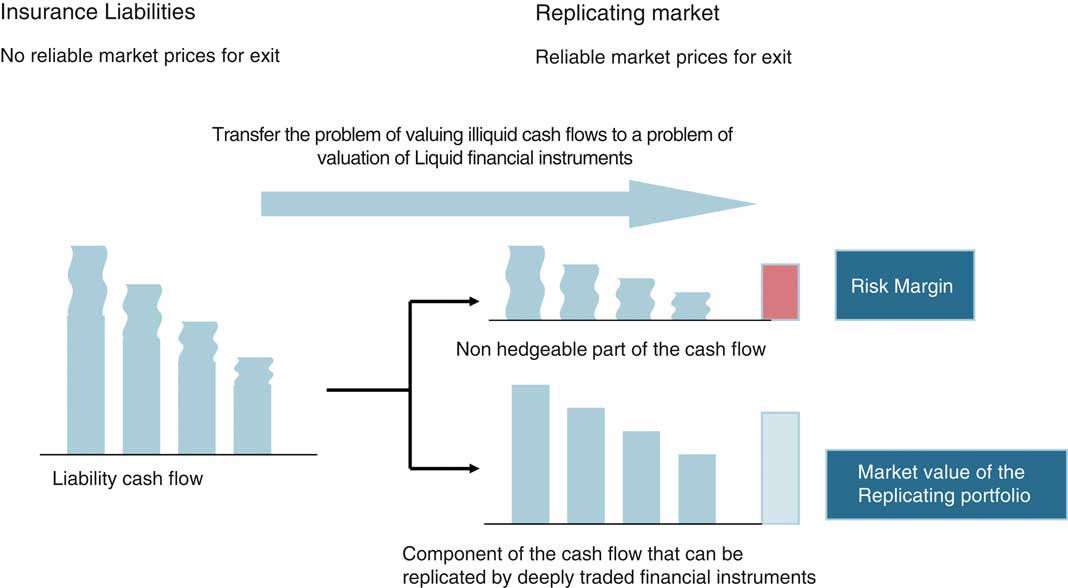
Figure 2 Diagrammatic representation of the usual approach to economic valuation of insurance liabilities (inspired by a slide of Philipp Keller).
The first solution implies that the credit risk has been eliminated from the cash-flow risks to be evaluated. The second implies that the insurer owns instruments with low liquidity, which in turn implies an additional risk if the company has to liquidate its assets to pay for claims. Strictly speaking, the third implies that an asset default risk should be added to the liabilities risk, which, of course is not considered by EIOPA and the advocates of the other two solutions, because their purpose is not to arrive at a fair price but to reduce the enhanced price of liabilities due to the low interest rates.
We have just seen above, but also in Figure 2, that the whole object of the exercise is to find instruments that are liquid and whose price can be used as a negotiating tool. This is obviously not the case for solutions 2 and 3 proposed by EIOPA and the insurance companies. Theoretically, the replicating portfolio does not necessarily contain only risk-free rate instruments. However, since the risk cannot be covered by the market, it must be added to the risk premium. Generally speaking, if the valuation is carried out strictly, the value should not change to any significant extent. It would simply be divided up differently. The riskier the instruments, the lower the cash -flow price of the liabilities will be, but the risk margin will be higher to take the asset risk into account. The problem with the current discussion on replicating portfolios is that the question of re-evaluating the risk margin has not been broached. By only considering the replicating portfolio, the value of the liabilities is reduced because they are not valued correctly. These devices are used by the supervisory authorities and the insurance industry to offset the low interest level and allegedly fight the pro-cyclical effect of the regulations. Yet, there are other more natural methods that would not consist in “blaming the thermometer for the fever” so to speak. We proposed one such method in Besson et al. (Reference Besson, Dacorogna and Trainar2010) which would simply consist in being more flexible about the threshold at which the capital is measured (VaR) during a serious financial crisis.
3.3. Risk margin, cost of capital and capital allocation
Certainly, economic valuation comprises unresolved problems, the first being the one we have just discussed, that is, the definition of assets in the replicating portfolio, while the second is related to the definition of risk margin. The risk margin is defined as the cost of capital that must be held until extinction of the contract’s cash-flows. Here again, two ingredients must be defined: the unit cost of capital, which is arbitrarily fixed at 6% by Solvency 2 and the SST, and the capital needed at each stage of payment. This second ingredient also raises controversy. For a study and in-depth discussion of the definition and calculation of capital costs, please refer to Auerbach’s (Reference Auerbach1983) original article, which lays the foundations of the problem and underlines both the difficulties and the limits involved. In principle, the capital required to guarantee payment not only depends on the underlying risk but also on the benefits of diversification offered by the insurer’s portfolio. The same contract would have a different value depending on which portfolio it belongs to. This would be a problem for accountants who would want to apply the same sort of valuation to the company’s liabilities – this would contradict the accounting principle of making sure that balance sheets can be compared. The same contradiction can also be found in the Solvency 2 regulations which require that companies calculate the risk margins for each legal entity and do not allow reinsurers the diversification benefit of their portfolio as a whole, for example. This difference can be very significant in the case of reinsurance. For SCOR, for example, it means hundreds of millions of Euros (Dacorogna et al., Reference Dacorogna, Nisipasu and Poulin2011) to be deducted from the available capital.
Another problem, which is rarely broached and remains unsolved, is the allocation of capital to the different stages of cash-flow payment. Non-life actuaries are usually capable of correctly estimating the capital needed to cover the contract up to ultimate, but the breakdown of capital over the course of time is not easy. In absence of a general method, it is often calculated approximately using a simple formula. If Monte Carlo methods are used to estimate the ultimate risk, the remaining capital should theoretically be estimated at each stage of payment. This would mean simulation calculations within the simulation, which is obviously not tractable for payments that frequently extend over several years. Rough approximations are therefore generally used to calculate the breakdown of capital over the course of time and estimate the risk margin without having to carry out complicated calculations. Progress should be made in this respect in the next few years. By defining classes of stochastic processes to develop cash-flows, it should be possible to stick closer to reality and avoid some of the difficulties involved in the economic valuation of insurance liabilities (see Dacorogna et al. (Reference Dacorogna, Ferriero and Krief2015) for an example of a first step in this direction).
Despite all these obstacles, the economic valuation approach remains central to the new paradigm which has been established in the insurance industry and is not going to disappear soon. Opposition is currently focussed on the weaknesses of the method while ignoring the progress it represents in a more realistic valuation of insurance business, and business in general, because it includes the notions of time, risk and market as vehicles of information.
4. The Internal Model to Assess the Capital
We will now consider one of the core components of this change in perspective caused by the quantitative assessment of insurance risks, namely risk modelling. Today, European regulations, whether Solvency 2 or SST, encourage companies to develop their own models to estimate their risks, or offer them the alternative of using the standard EIOPA formula or standard Finma model. Whatever their choice, companies will need to perform a quantitative assessment of their risks. Some, like reinsurers, who are often avant-garde in this respect, have not waited for the new regulations to perform quantitative modelling of their business portfolio. Swiss Re, for example, has been developing an in-house model since 1993 (James et al., Reference James, Borscheid, Gugerky and Straumann2013), while SCOR has had its own model since 2003 (Dacorogna, Reference Dacorogna2009).
Notwithstanding the risk-based solvency, the quantitative estimation of the company’s risks is playing an increasingly central role. We have seen that it enters more and more into the organisation’s decision process. It increases the perception of risk in the company as a whole. At the same time, it guides strategic choices and facilitates meaningful discussions on major issues. It does not mean blindly following the results given by models, but any decision to depart from the model’s outcomes must be based on solid arguments. This is why insurers are using them more and more and we are witnessing the move towards increasingly industrialised systems that are becoming an integral part of companies.
Quantifying risk is today becoming core to many organisations. It is part of the way management learned to reduce uncertainty to cope strategically with risks (see for a good introduction to this question: Friberg, Reference Friberg2015). The in-house model is used to quantify most of the risks to which the company is exposed: underwriting risks (P&C and life), market risks, credit risks and operational risks. Some risks like reputation risk or strategic risks are difficult to quantify and are usually not part of internal models. Some others, like liquidity risks are often neglected but could be included in some models through special treatment of the fat tails of the probability distributions.
The risk of the company’s economic balance sheet is estimated by modelling the variable, X(t), defined in equation (4) at a 1-year horizon. This variable is considered to be a stochastic variable (as explained in section 2.2, usually modelled by means of Monte Carlo simulations based on knowledge of the probability distributions of underlying risks and their dependencies. Since it is a 1-year projection, the in-house models include economic planning data in addition to accounting and actuarial data. The integration of the company’s various data is one of the collateral benefits of these models. They provide an overview of all the processes involved: economic planning, accounting and actuarial.
4.1. The four generations of risk models
Over the years, these instruments have become increasingly sophisticated and complex, but their development is a natural part of the evolution of modelling in insurance which is no doubt one of the first industries to systematically quantify its risks in order to establish a viable business model. We have already mentioned Euler’s article written in 1767, which proposes a way to calculate life annuities. The widespread use of mortality tables goes back to the 1860s. Actuarial calculations in P&C insurance did not appear until later, at the beginning of the 20th century. Modelling thus began by taking an interest in the risks themselves. In a natural evolution, the actuaries studied the aggregation of these risks in a portfolio. It was an Italian actuary, de Finetti, who first developed the portfolio optimisation theorem in the 1940s (de Finetti, Reference de Finetti1940). The theorem was to make Markowitz’s fortune in the 1950s and 1960s when he applied it to the field of financial investments in conjunction with his idea of an efficient frontier (Markowitz, Reference Markowitz1952). It is interesting that Markowitz himself caveats his theory in the first and the last paragraphs of his paper, emphasising its reliance that we already have beliefs about the future performances of available securities. Nevertheless, actuaries forgot this caveat and went ahead trying to estimate risk aggregations, to high percentiles. Still today, the question of dependence between risks remains a central question of risk modelling.
This first generation of models, whose main aim was to calculate policy premiums, gradually led to the emergence of models integrating all the risks involved to evaluate the capital needed to conduct the company’s business. The evolution occurred at the same time as that of banks and the first efforts of the Basle committee to instigate risk-based banking regulations. The beginning of the 21st century was marked by dynamic financial analysis models (Blum & Dacorogna, Reference Blum and Dacorogna2004) aimed at determining the company’s risk by modelling the balance sheet and estimating the risk measure (VaR or TVaR) related to a change in the company’s accounting value.
Figure 3 shows the above evolution by depicting four generations of models. Today, insurers have more ambitious aims for the fourth generation of models. They want them to help generate more value in their business by optimising the asset–liability portfolio, examining the benefits of diversification of the different types of business, optimising reinsurance coverage to reduce the cost of capital and planning the development of the company’s business more quantitatively. All these applications go much further than simply assessing the solvency requirements. They require knowledge of the entire probability distribution of any changes in the company’s economic value. We have illustrated this by indicating distribution as the end product of the fourth generation of models in Figure 3. It must therefore be possible to use these models to answer the question of What is the probability of achieving the set target? And not just “What is the risk at a frequency of once every 200 years”! It is paradoxical that the extremes were considered first in the third generation of models, even though by definition the data required to estimate their value are insufficient, while the centre of the distribution where the data are by definition more abundant, was neglected and has been reintroduced in the fourth generation. The most modern insurers therefore use the entire range of data available, which has been reinforced by the abundance of data provided by the Internet of ThingsFootnote 3 and the possibilities it offers for defining coverage more accurately to optimise the calculation of premiums and the risk models.

Figure 3 History of risk modelling in the insurance industry (inspired by a slide of Philipp Keller).
With the implementation of the new regulations, the process for producing the model, in addition to providing data access, is playing an increasingly important role within the organisation. Both the pertinence of the data used and the results produced by the model must be guaranteed. As in the case of balance sheets, much stricter control processes are gradually being implemented. In particular, according to the new regulations, the model must be validated by an independent body. Companies either use external consultants or develop independent capacities internally, alongside the modelling department. A future possibility would be to have the results audited by specialised firms. This is not yet the case, but consultants are appearing on the market who would like to play this role. However, the production of internal models must not be institutionalised to the detriment of the flexibility needed to adapt the methodologies to developments in science and programming techniques. This is one of the dangers facing insurance companies, and modellers and actuaries must play their role to avoid it. Risk evaluation requires know-how and qualifications that go far beyond those needed for accounting. Nor will the results of the internal model ever have the precision and accuracy of a corporate balance sheet. The model is concerned with statistical estimations and not the calculation and classification of cash-flows. Assuming that the model is perfectly adequate, these estimations will only ever be accurate to within a few per cent, which represents several tens and even several hundreds of millions of euros. This situation is difficult to accept for managers who are used to the precision of accounting figures. The supervisory authorities are in the same situation and regard with suspicion any variations in figures concerning the internal model. Yet these are inevitable.
4.2. Internal models and diversification
One of the important by-products of the model is the diversification benefit, in other words, the amount of capital saved by aggregating the risks on the portfolio. The diversification benefit is calculated as follows (Bürgi et al., Reference Bürgi, Dacorogna and Iles2008):
 $$D_{n} \, {\equals}\, 1{\minus}{{\rho \left( {\mathop{\sum}\nolimits_{i\, {\equals}\, 1}^n {Y_{i} } } \right)} \over {\mathop{\sum}\nolimits_{i\, {\equals}\, 1}^n {\rho \left( {Y_{i} } \right)} }}$$
where the random variable, Y i , represents a particular portfolio risk and ρ represents, as in equation (3), the risk measure chosen (VaR or TVaR). It should be noted in passing that, although it is of considerable interest, this quantity is not universally defined and depends on the number of risks, n, considered in the calculation. This is why we have defined it with an index, n, in equation (8). Papachristou did an interesting review and discussion of this problem in an IFoA document (Papachristou, Reference Papachristou2015).
In Table 2, we give an example of the diversification benefit as reported by SCOR during its Investor Day in July 2009 (SCOR, 2009). Even if they are a little dated, these figures are a good illustration of the advantage to be gained by examining the diversification benefit obtained by a company when the calculation of its capital is based on all the risks involved. It can be seen, for example, that in the case of a reinsurer, investments only represent a small portion of the risk in comparison with the portfolio, although their individual capital corresponds to more than half the individual capital of the company’s life insurance business. In the end run, when its main business lines are considered, the company achieves a diversification benefit of 47%, which is considerable. The figures published by other reinsurers are similar (see, for instance, the investor’s presentations of Munich Re (2017) for 2016 was 36%). The diversification benefit is essential for this type of business to operate smoothly (Boller & Dacorogna, Reference Boller and Dacorogna2004). Reinsurers therefore take particular care when modelling the dependences in their portfolios. For instance, SCOR actuaries have developed a sophisticated Bayesian technique to elicit expert opinions to make up for the lack of data in the tails of the distribution in order to calibrate non-linear dependences, PrObEx (Arbenz & Canestraro, Reference Arbenz and Canestraro2012). This point illustrates, some aspects of the new role of actuaries, who are no longer confined to the evaluation of reserves and the computation of premiums but also in addressing the strategic issues of modelling risk like risk aggregation and how to solicit experts for helping calibrating the models.
Table 2 Internal model results for SCOR as published in 2009 in million EUR (SCOR, 2009).

Note: RC, risk capital.
4.3. The various forms of internal models
To complete this brief incursion into the world of internal models, we would like to mention that at least three types of quantitative models exist for insurance risks:
1. Stochastic-type models based on probability distributions and more or less sophisticated modelling of risk interdependence. Generally speaking, the internal models of companies belong to this category.
2. Deterministic-type models, or factor models: the capital is calculated by multiplying the volume of business by a specific factor (often called the capital intensity). These models are typically used by rating agencies to estimate the capital requirements of the companies they are rating.
3. Scenario-based models: several scenarios are applied to the economic balance sheet to examine the value of the company in relation to different states of the world. These models, also called stress tests, were applied by the Fed to American banks in March 2009. The positive results restored market confidence in the financial system.
Most companies use a combination of these approaches. While deterministic models are preferred because they are simple to use and give almost instantaneous answers to the questions posed, they are not very flexible. Factors that have been determined in certain situations may be less relevant in other circumstances or if there is a substantial change in the insurer’s portfolio. The other two types have connections. Stochastic models are used to explore a large number of scenarios with considerable efficiency. However, the scenarios they generate are rarely identified or comprehensible to their users. Scenarios applied to the economic balance sheet are more intuitive because they are based either on historical values or strategic visions of a possible state of the world in the future. In practice, the latter are often used to verify the plausibility of the results obtained with stochastic models. That is how they are used by Finma which asks its insurers to provide the results of six scenarios in addition to those of the internal model. For more details on the subject of internal models and their developments, the reader should refer to the article (Dacorogna, Reference Dacorogna2009).
5. ERM
We will complete this overview of the fundamental changes in the insurance world due to the implementation of new solvency rules with the still very topical question of enterprise risk management, often designated by its acronym, ERM. For many years, risk management was considered to be the specific duty of the Chief Risk Officers (CRO) and their small teams. They were responsible to ensure that the organisation was not too exposed and that the designated limits were respected. With everyone working in silos, the specific role of the CRO was to make sure that the sum of the parts did not exceed the capacity of the whole. Most of the time, they reported organisationally to the Chief Financial Officer (CFO). This is still the case in many companies. However, new awareness that risk is the very object of insurance has completely changed the perspective. Managing risks means managing insurance business in the long term. It is thus one of the direct tasks of both the Chief Executive Officer (CEO) and the Chief Underwriting Officer (CUO). In the most progressive companies, the CRO is directly accountable to the CEO. In the board of directors’ organisation, alongside the strategic, audit and remuneration committees, there is now a risk committee to which the CEO and the CRO must report. These organisational changes are a reflection of the new awareness that risk management is essential to sustainable and profitable business. Also, actuaries now play an essential role in risk management as they allow the introduction of quantitative risk management in the practice of risk managers. We often find actuaries as CRO of companies as currently at SCOR, Aviva, NN Group or Partner Re.
ERM is based on the recognition that there is a risk associated with each expected return and that risk and return need to be proportionate. The higher the risk, the greater the expected return must be and vice versa. Since the company’s capital is limited, it must be used in such a way that it will generate maximum profit while guaranteeing the company’s financial stability. A point of equilibrium must be found between solvency, profitability and business development where none of the three is favoured at the expense of the two others. Managing risk thus also means managing the company’s performance. The CRO is no longer seen as a spoilsport but as a business facilitator, the person who encourages ongoing development that is commensurate with the company’s capacities and market characteristics. What a change of perspective!
5.1. Risk culture as a basis of ERM
ERM therefore implies the fostering and the wide-spreading of a strong risk culture throughout the organisation. It concerns everyone in the company. Management must make sure that each employee is conscious of his/her role and be familiar with the in force risk management rules. These rules have the following aim:
∙ A clear definition of the types of risks that the company wants to have in its portfolio, that is, its risk appetite.
∙ The precise delimitation of its risk tolerance, which can be deduced from the requirements of the various stakeholders (shareholders, customers/regulators, rating agencies and corporate management).
∙ A clear vision of the risk profile deduced from the two aims set out above.
∙ The establishment of precise limits for each individual risk as deduced from the three elements above, namely risk appetite, risk tolerance and risk profile.
In order to establish this type of culture, the different components must be explained in a series of guidelines available not only to each person in the company but also to all the stakeholders concerned. They are the ground rules, so to speak, established by the company and promoted both inside and outside the organisation.
An efficient and deeply rooted governance structure is obviously required. We saw earlier that changes are taking place that will make risk management a company’s core consideration. The role of the Board of Directors, as the shareholders’ representative, will be to guarantee that a clear risk appetite and associated profile are established. It is the board that determines the risk tolerance, in conjunction with the General Management, and ensures that this information is understood properly throughout the entire organisation. This not only means greater transparency in hierarchical relations in this respect, but also regular feedback from the lower ranks to the management and board of directors in order to verify that the rules are lived through and that the risk strategy can be and is followed.
To explain this approach more clearly, we are going to illustrate it with a concrete example drawn from our own practice. Establishing an investment strategy in insurance is a complex process that involves several sectors of the organisation. The board of directors and the executive committee define the limits not to be exceeded in terms of capital. For example, they decide that investments must not account for more than 20% of the RAC allocated to the company’s risk. Once the limit has been determined, the executive committee decides what effective portion of the RAC is to be allocated to investments, for instance, 10%, in order to be sure not to overrun the set limit of 20%. The investment committee must then determine the effective capital allocation to the different asset categories according to the assets/liabilities management strategy used to determine both the duration of the bond portfolio to hedge reserve fluctuations due to interest rates and the proportion of the different types of risky assets that will optimise the performance of the investment portfolio without exceeding the allocated limits. On this basis, the managers, who are responsible for carrying out the transactions on the market, will receive a risk budget that they then have to optimise. It can be seen in this example that the ERM approach concerns every level of the company and that communication in both directions is essential to the execution and effective control of the strategy.
5.2. The three pillars of ERM
This necessary transparency is illustrated in Figure 4 showing the different responsibilities required for good risk management and the correction of faulty operational processes (in red). It can be seen that the risk culture must be widespread within the organisation and have feedback systems at every level. This is the basis on which ERM can be built according to the following three pillars:
1. Quantitative assessment of the risks based on a model of the company’s portfolio.
2. Monitoring and management of emerging risks.
3. Development of risk control and signalling processes.

Figure 4 Diagrammatic representation of risk management transparency policy. ERM, enterprise risk management.
The first pillar was discussed at length in the previous section. The second pillar is an essential component of risk management to prevent the company being taken by surprise by the emergence of a devastating risk. An example of such unexpected developments hitting badly the insurance industry is the discovery of asbestos causing lung cancer. Another one is the change of the French legislation concerning the reimbursement of automobile accidents which went from a system of awarding a lump sum for damages to the payment of annuities. The British market is currently experiencing an unexpectedly enormous drop in the discount rates being used for lump sum court awards, which also modifies the reserving of liabilities. Continual monitoring must be organised within the different departments to identify and evaluate potential risks and propose ways of hedging their consequences. For the first mission, both internal sources and all affordable external sources will be used. An example of using external resources is that of a company in the United States that digitalises all the scientific articles published each year in chemistry and biology (more than 50,000!) to determine the number of times certain substances are mentioned, which is seen as an indication that side effects of the substances are being discovered. The consequences of such risks are evaluated by involving all the parties concerned in the organisation, including the finance department to examine the financial impact and study hedging possibilities in financial markets. Various measures can be taken if a risk is identified: the search for a hedging strategy with reinsurers or on financial markets, imposing new limits on underwriting, changing insurance contracts and, as a last resort, securing access to liquidity through contingent capital contracts, for example. To conclude this brief reminder of the measures to be taken to prepare for emerging risks, let us point out that it is important to draw lessons from those which have already appeared by setting up specific procedures to manage them.
The third pillar of ERM is, of course, the control and information processes which must be present at every level. Without efficient control and information systems, it would not be possible to verify that limits are respected, that compliance is properly enforced, that processes are well functioning. This means identifying, prioritising and controlling any possible sources of risk. We have already spoken of the importance of precise, written guidelines which must be communicated and understood throughout the organisation. In addition, these rules must also include clear procedures concerning the risks incurred if they are not respected. None of the above would make sense without the existence of regular processes to measure the exposures and compare them against the limits. Here, the internal model is a precious tool because it pools all the portfolio data available, but it is not enough. Tools to control accumulated exposure to risk are indispensable complements. All the major reinsurance companies, for example, have developed IT platforms to monitor their exposure to natural catastrophes. They are used to compare the business volume to the limits defined and produce reports that will be used in the CROs quarterly risk dashboard presented to the company’s risk committee and board of directors. The risk dashboard, which is a short document consisting of several pages of text and signs with a colour code designed to rapidly visualise possible problems of risk management, is an indispensable communication tool at top management level. The aim is to regularly produce a rapidly accessible risk inventory. The effort required to produce this summary report involves reflection on crucial points by all the company’s different structures.
The European regulations, with Solvency 2 and SST, and, the American regulations, with the NAIC ORSA Guidance, have highlighted the usefulness of ORSA (Own Risk and Solvency Assessment) for the company’s management and Board – and its importance to regulators. A distinction should be made between the ORSA process and the ORSA report. The ORSA process is indistinguishable from ERM and is intended to ensure that all the ERM activities are appropriate to the company’s specific risk profile, prospective and appropriately taken into account in the company’s decision-making. The ORSA report is intended to summarise the key outputs and conclusions of the ORSA process in a clear and digestible format for the management, the Board and the regulator.
ORSA is becoming an increasingly important component of the corporate reporting system and fits in perfectly with the third pillar of ERM. (For more information about ORSA see the Milliman reports (Bradley et al., Reference Bradley, Motiwalla, O’Malley and Phelan2015) on the ORSA implementation worldwide and specifically on Solvency II (Clarke & Phelan, Reference Clarke and Phelan2015).)
5.3. The goal of ERM: strategic risk management
The risk culture and the three pillars are the foundations of strategic risk management. As we have already pointed out, this type of management focusses on balancing risk and performance and is aimed at optimising the portfolio accordingly. An example of this type of management can be seen in Figure 5.

Figure 5 Efficient frontier of assets–liabilities portfolio as a function of the share breakdown of investments.
The portfolio’s efficient frontierFootnote 4 is shown as a function of the risk measure considered (here, TVaR) and the breakdown of the company’s asset portfolio. The aim is to determine the strategic allocation of assets. The frontier is based on modelling the portfolio as a whole (assets and liabilities) where the proportion of the investment in shares is made to vary from 0% to 25%. It can be seen that a portfolio that only contains bonds (first point on the curve on the left) would not be on the frontier. A minimum risk can be expected with a portfolio containing 5% shares. This will therefore be the lower limit of strategic allocation. The upper limit is determined by the maximum authorised risk capital which, here, is about 16%. The optimum point will be obtained at the point of contact between the tangent, whose slope will be equal to the company’s profit target, and the efficient frontier curve, here 12%. The strategic share allocation will therefore be between 5% and 16% with an optimum allocation around 12%. The investment committee will then have the task of fixing its tactical allocation within these margins depending on the strategic indications provided. The importance of good risk quantification can be seen here as well as the usefulness of the internal model combined with a clear process for defining the strategic allocation. This is a far cry from the discussions held by management bodies in the past on portfolio share allocation. The capital and how it is used is now the main focus and enables the different business proposals to be assessed accordingly. The very aim of ERM is to make the most of the capital at the company’s disposal in order to achieve the company’s performance objectives.
It can therefore be seen that ERM is a necessary development of insurance practice. It affects the entire organisation, it highlights the value drivers of insurance (risk/return in a portfolio perspective), and it allows to measure the performance of the business and helps to make the company more transparent for all stakeholders. It is not a passing fad that the companies are forced to accept. ERM is simply a more professional way of approaching business when risks are becoming more complex and more extreme. In this case, understanding the risks and the dependence between them is essential to cope with this new reality. It will therefore be the backbone of insurance in the future. It requires long-term commitment on the part of all the company’s structures in order to achieve excellence. In the words of Aristotle: “We are what we repeatedly do. Excellence, therefore, is not an act but a habit”. This maxim expresses a wisdom that fully applies to ERM.
6. Conclusion
We have come to the end of this review of the changes experienced by insurance companies with the ascent of risk-based solvency. The arrival of the Solvency 2 directive in Europe spurred on a process that had already started well beforehand, under the pressure of financial markets and liberalisation of the capital and insurance markets. Social protection and security requirements encourage insurance companies to think about the best ways of offering consumers high-quality services at the lowest price. They have to adapt their practices accordingly. The 2008/2009 financial crisis showed the importance of relating performance to risk. Financial institutions putting target ROE at 25%, while interest rates were constantly going down, were bound to take too much risk to achieve such targets (see the critical view on this from: Wolf, Reference Wolf2011). The resilience of insurance companies during this period is also evidence of more consistent risk management on the part of institutions that have always been faced with extreme risks.
In insurance, we are moving from cash-flow management to risk and capital management. This implies long-term commitment and, as we have seen, a fundamental reorganisation of the company’s structures. The quantitative approach is becoming increasingly important. Actuaries are coming out of the wings onto the stage. They are now in the front line and must answer the company’s basic strategic questions. Internal models and complex IT systems to process large amounts of data are becoming core activities. Following the example of banks, the industrialisation of quantitative activities is on the agenda everywhere. In addition to the production of ordinary balance sheets, economic balance sheets and risk assessments will now be regularly produced and published with ORSA and the third pillar of Solvency 2. This practice should encourage transparency and market discipline.
In this paper, we have reviewed some of the major changes such as the introduction of new capital management, the development of internal models and the spreading of ERM within organisations as well as the changes they imply in terms of the roles of various actors and the limitations to be overcome. Such a radical change of paradigm does not come without questions and problems. There are numerous limits and controversies concerning the application of these new standards. We have mentioned some of them along these pages. Many are related to the application of economic valuation to insurance contracts. Economic valuation was initially designed for short-term financial instruments. The methodology must be adapted to the specific conditions of insurance contracts which, by definition, are long-term commitments, particularly in life insurance. What risks should be attributed to time? And, as a result, how much capital should be allocated? This question remains largely unexplored and should find a satisfactory theoretical answer in the future. It should be an important goal for academics working on actuarial mathematics to explore this question. Coming up with a good method should solve many of the problems still posed today. However, since the advantages of economic valuation largely outweigh its drawbacks, it is clear that this approach will override the others and there will be no going back. ERM will soon be part of insurers’ DNA. The path is long and thorny but there is no question about the direction in which it is going.
Acknowledgement
The author wishes to thank an anonymous referee for his thorough review of the manuscript. This version has benefited a lot from his insights. The author would also like to thank the participants at the RARE Workshop in La Baule whose remarks and discussions of the points presented made it possible to enrich the content of this paper.


