


Introduction
X-ray tomography is used to visualize the surface and interior structure of solid objects on the basis of X-ray attenuation (the proportion of X rays scattered or absorbed as they pass through an object) [Reference Flannery1]. A tomographic series is acquired by rotating an X-ray source around a specimen and collecting transmitted X-ray intensity on a series of detectors. The detectors acquire a set of images, which are X-ray projections. These are converted to a voxelated 3D file that can be visualized and analyzed with a wide variety of 3D-based imaging programs. Resolution of these image files (designated as voxel pitch) depends on X-ray intensity, focal spot size of the X-ray source, detector size, and noise reduction. Using a combination of these factors, X-Ray Engineering, Belgium XRE (www.xre.be), has developed custom-made X-ray scanning systems designed for a variety of applications. These instruments generate tomographic information well into the sub-micrometer range.
Radiolarians are amoeboid protists with elaborate, radially symmetrical mineral skeletons [Reference Anderson2]. Fossilized radiolarian skeletons (also called tests) consist of SiO2, which is X-ray attenuating. This provides the mechanism for acquisition of 3D data sets by X-ray tomography. With the development of high-resolution computerized tomography (CT), detailed 3D data sets of radiolarians can be acquired with sub-micrometer resolution. We report here the recording of X-ray tomograms (0.103 µm voxel pitch) of selected radiolarian tests and subsequent computer modeling of 3D data sets that reveal intricate details of the exterior and interior of the specimens. Also, digital skeletonization of some of the rendered models reveals their essential geometrical features, which can be measured with great accuracy based on the voxel size of the original data set.
Methods and Materials
Washed radiolarians [Reference Sanfilippo3] were obtained from Dr. Richard Howey (Univeristy of Wyoming). These specimens originated from sediments collected from the seas of Barbados and were dated to the Tertiary period.
X-Ray tomography
A custom-made, high-resolution CT imaging system, built via a collaboration between UGCT (Ghent University Centre for X-ray Tomography) and its spin-off company, X-Ray Engineering (www.xre.be), was used to acquire tomographic data sets of radiolarians. Several thousand radiolarians were mailed to Ghent, Belgium, on the sticky tab of a post-it-note. Single skeletons or groups of specimens were selected under a stereoscopic microscope and mounted on the tip of a 0.9 mm carbon sample-holder stick using nitrocellulose as an adhesive. The sticks were inserted into the CT system on a custom sample holder. The X-ray CT system consisted of a transmission X-ray source with a 1 µm thick tungsten target, a high-resolution CCD-based sensor, and eight motorized stages on a damped optical table in a temperature-controlled, shielded room.
The detector was used in a 995×664 pixel mode with a 36 µm pixel size. The X-ray source operated at 50 kV and 0.7 W. For each sample, typically 1,600 two-second projections were acquired over a rotation of 360 degrees. The scan time was approximately 45–60 minutes, using the acquisition software ACQUILA (www.xre.be). The recorded data were processed and reconstructed using XRE dynamic reconstruction code into data sets with voxel size between 300 and 950 nm.
Computer modeling and rendering
3D image stacks (DICOMM or TIFF) were thresholded and surface-rendered with AMIRA 5.6 (FEI, Houston, TX) running on a Mac-Pro platform. Rendered models were rotated and sliced digitally at several angles to reveal the specimen’s internal structure. The motion of a virtual camera was scripted to move around and within the modeled radiolarian test to produce a fly-through video for closer assessment of the interior structure.
Surface-rendered models were skeletonized. This is an erosion or thinning of voxels so that only a string of voxels remains. The resulting skeleton represents the essential geometry of the radiolarian cage-like test. The voxel size of the original data set was used to measure the lengths of the skeleton segments. Segment number and nodes (inter-secting points of segments) were also computed. All these functions are available with the latest version of AMIRA (6.0).
The rendered models were con-verted to VRML files with AMIRA and then to STL files with nettfab. Several high-resolution models were 3D printed by Shapeways with a strong, flexible polymer.
Results
Several radiolaria embedded in the nitrocellulose adhesive were scanned as a group (Figure 1). A variety of forms were present, each perforated with different patterns forming cage-like structures with polygonal outlines. Selected speci-mens were volume edited (cropped in three dimensions) and surface rendered as individual radiolarians (Figures 2a–2d). These rendered models exhibited sharply defined features, and their surface details were resolved well into the sub-µm range.

Figure 1 Rendered model of a group of radiolarians embedded in nitrocellulose adhesive. Several forms are present exhibiting cage-like tests with polygonal elements.

Figures 2a–2d Selected radiolarian models exhibiting highly resolved, sharply defined surface elements. Models a, c, and d were volume-edited from the group exhibited in Figure 1.
Digital bisection of rendered models revealed medullary shells held in place by struts connected to the outer cortical shell (Figure 3a). In some specimens, two medullary shells were present, one inside the other. The two inner shells were connected by struts, and both were connected to the outer shell by additional struts (Figure 3b).
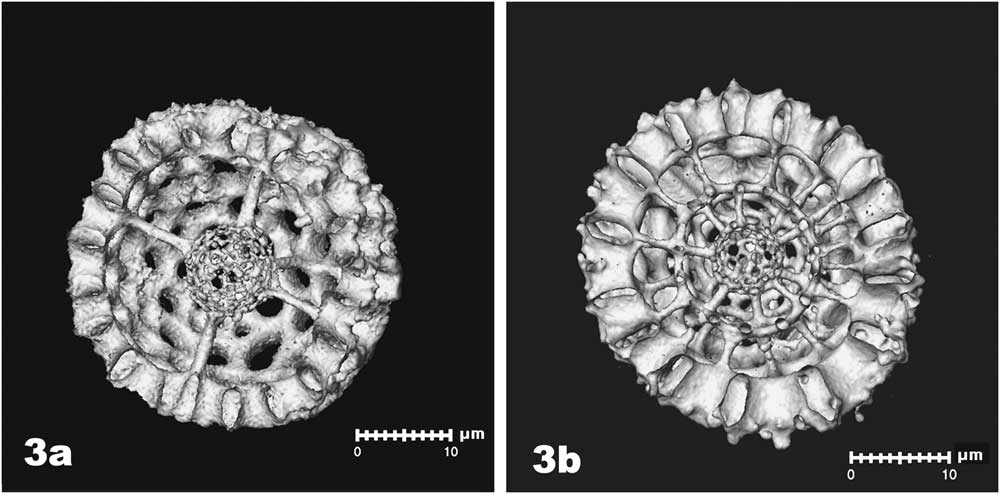
Figure 3 Digital bisection of rendered models reveal medullary shells within the outer (cortical) shells. In some cases, a single medullar shell was held in place by struts oriented in three planes (3a). In other specimens, two medullary shells were present, each anchored to each other and to the cortical shell by multiple struts (3b).
Several of these models were amenable to digital skeletonization [Reference Lobregt4–Reference Palagyi6]. This is a thinning algorithm that erodes voxels away from the modeled surface until only a single line of voxels remains (the medial axis). This worked well for specimens with cylindrical or near cylindrical segments, form-ing the polygons. In such cases the resulting skeleton accurately reflected the essential geometry of the radiolarian test (Figure 4). Topological features of the skeletons, such as nodes (intersections of segments) and segment number, were computed. Segment length was calculated according to the voxel size of the file because each segment was a single row of voxels (inset of Figure 4).

Figure 4 Digital skeleton (medial axis transform) of a radiolarian test shown against a bisected background of the original model. This represents the essential geometry of the test, including polygonal segments and nodes (intersections of segments). Segment length is derived from the voxel dimension of the data set (inset).
Figure 5 shows a 3D-printed model of a radiolarian, large enough to hold in your hand. Currently these models are printed in a strong but flexible polymer.

Figure 5 3D-printed model of a radiolarian produced from a high-resolution tomographic dataset.
Discussion
When microscopic biological structures are fluorescent or X-ray attenuating, 3D data sets can be acquired from them. In confocal fluorescence microscopy, a series of confocal fluorescent planes is used to generate a 3D file (z-stack). However, because the exciting fluorescent beam is reduced in energy as it passes through the specimen, the thickness of the z-stack with sufficient fluorescent signal is limited [Reference Wagner7]. This limitation is overcome by X-ray tomography, in which a series of X-ray projection images of internal structure are acquired through a rotation of 360 degrees [Reference Wagner8].
Micro-CT systems have limited resolution, and sub-micrometer or Nano CT systems are required to resolve fine structure such as corrosion-casted blood capillary systems [Reference Wagner8]. Micro-fossils of radiolarians and fora-miniferans [Reference Mees9, Reference Speijer10] are ideal for Nano CT because they have X-ray attenuating skeletons with very fine detail, only resolved at the submicron level.
Since the first detailed descriptions of radiolarians by Ernst Haeckel [Reference Haeckel11], thousands of extant and extinct species have been described [Reference Pawlowski and Burke12] based on their collection sites and the geometry of their tests. Early reports relied on microscopy with poor capabilities in contrast, resolution, and depth of field. Scanning elec-tron microscopy has greatly improved the ability to resolve radiolarian fine structure [Reference Anderson13]. Although the SEM can be engineered to view specimens through 360 degrees, the internal structure of radiolarians such as the medullary tests [Reference Anderson13] is obscured or hidden from view.
These limitations are overcome with sub-micrometer X-ray tomography, where highly resolved 3D models of radiolarians can be rotated through any angle of viewing and digitally sliced to reveal medullar shells and their associa-tions with outer cortical shells. This greatly improves the precision of radiolarian description and taxonomic classification.
Mathematical analysis based on the geometry of the tests can also be performed because voxel dimension provides a precise measure of polygonal segments of the tests, as well as nodes and segment numbers. The rendered models consti-tute 3D files, which are amenable to scaling up and used for 3D printing of models that can be held in one’s hand.
Conclusion
Sub-micrometer X-ray tomography revealed the intricate structure of siliceous radiolarians at a resolution not achieved by conventional light microscopy. The ability to digitally slice rendered models of radiolarian tests provides additional internal structural details of medullary tests and the struts holding them to the outer wall. Skeletonization of radiolarian models provides a means to quantitate connecting nodes of polygonal units, as well as the number and lengths of the polygonal sides. These capabilities greatly improve structural characterization of radiolarians and their taxonomic classification.
Acknowledgements
We are greatly indebted to Dr. Richard Howey (University of Wyoming) for providing samples of washed radiolarians.


