


Introduction
The magnitude of a putative increase in global biodiversity toward the recent is still debated (Sepkoski et al. Reference Sepkoski, Bambach, Raup and Valentine1981; Smith Reference Smith2007; Alroy et al. Reference Alroy, Aberhan, Bottjer, Foote, Fürsich, Harries, Hendy, Holland, Ivany, Kiessling, Kosnik, Marshall, McGowan, Miller, Olszewski, Patzkowsky, Peters, Villier, Wagner, Bonuso, Borkow, Brenneis, Clapham, Fall, Ferguson, Hanson, Krug, Layou, Leckey, Nürnberg, Powers, Sessa, Simpson, Tomašových and Visaggi2008; Holland and Sclafani Reference Holland and Sclafani2015). Some argue there is a significant increase in Cenozoic to recent biodiversity in the marine (Valentine Reference Valentine1969; Bambach Reference Bambach1999; Jablonski et al. Reference Jablonski, Roy, Valentine, Price and Anderson2003; Markov and Korotayev Reference Markov and Korotayev2007; Stanley Reference Stanley2007) and terrestrial (Benton Reference Benton1995; Sahney et al. Reference Sahney, Benton and Ferry2010) realms, whereas others argue there is not (Raup Reference Raup1972; Alroy et al. Reference Alroy, Marshall, Bambach, Bezusko, Foote, Fürsich, Hansen, Holland, Ivany, Jablonski, Jacobs, Jones, Kosnik, Lidgard, Low, Miller, Novack-Gottshall, Olszewski, Patzkowsky, Raup, Roy, Sepkoski, Sommers, Wagner and Webber2001, Reference Alroy, Aberhan, Bottjer, Foote, Fürsich, Harries, Hendy, Holland, Ivany, Kiessling, Kosnik, Marshall, McGowan, Miller, Olszewski, Patzkowsky, Peters, Villier, Wagner, Bonuso, Borkow, Brenneis, Clapham, Fall, Ferguson, Hanson, Krug, Layou, Leckey, Nürnberg, Powers, Sessa, Simpson, Tomašových and Visaggi2008). This question has major implications for all of biology and paleontology and centers on the magnitude and nature of several well-known attributes of the fossil record, including the Pull of the Recent. The Pull of the Recent was originally attributed to three specific factors that increase apparent diversity of the fossil record toward the recent (Raup Reference Raup1979), namely more complete sampling in the recent, misassignment of fossils to recent taxa, and more fully developed taxonomic understanding of recent taxa. The latter two factors are the least important and can be mitigated through the use of revised and updated taxonomy. The most prominent factor, and focus of this paper, is the comparatively complete knowledge and sampling of the living biota in the recent compared with fossil biotas of the past, which extends the biostratigraphic ranges of fossil taxa and therefore increases range-through diversity estimates toward the recent through the inclusion of living “Lazarus” taxa (i.e., those with gaps in their stratigraphic records). Whereas this effect can be negated through the use of sampled-in-bin estimates of diversity (Alroy et al. Reference Alroy, Aberhan, Bottjer, Foote, Fürsich, Harries, Hendy, Holland, Ivany, Kiessling, Kosnik, Marshall, McGowan, Miller, Olszewski, Patzkowsky, Peters, Villier, Wagner, Bonuso, Borkow, Brenneis, Clapham, Fall, Ferguson, Hanson, Krug, Layou, Leckey, Nürnberg, Powers, Sessa, Simpson, Tomašových and Visaggi2008; Alroy Reference Alroy2010), this approach also eliminates Lazarus taxa from analysis and therefore removes data and potentially erodes real biological signal (Sahney and Benton Reference Sahney and Benton2017).
Previous studies have argued that the effect of the Pull of the Recent is minimal (<5%) in the case of global Cenozoic marine bivalve genera (Jablonski et al. Reference Jablonski, Roy, Valentine, Price and Anderson2003) and tetrapod genera (Sahney and Benton Reference Sahney and Benton2017), and therefore apparently large increases in diversity toward the recent are not simple consequences of this effect and may be real. There is a growing body of literature debating the appropriateness of using genera as proxies for species diversity (Hendricks et al. Reference Hendricks, Saupe, Myers, Hermsen and Allmon2014; Xing et al. Reference Xing, Onstein, Carter, Stadler and Peter Linder2014; Wiese et al. Reference Wiese, Renaudie and Lazarus2016), but due to limitations of the available data, the effect of the Pull of the Recent on species-level data has not been quantified previously.
Here we test the effect of the Pull of the Recent at the regional scale and at both genus and species levels using the exemplary, well-studied, and relatively complete fossil record of Cenozoic mollusks from New Zealand (e.g., Crampton et al. Reference Crampton, Beu, Cooper, Jones, Marshall and Maxwell2003, Reference Crampton, Foote, Beu, Cooper, Matcham, Jones, Maxwell and Marshall2006a, Reference Crampton, Foote, Cooper, Beu and Peters2011). The record is highly resolved taxonomically at both species and genus levels, with approximately 40% of Holocene species known as fossils (Foote and Raup Reference Foote and Raup1996; Foote Reference Foote1997; Paul Reference Paul1998; Cooper et al. Reference Cooper, Maxwell, Crampton, Beu, Jones and Marshall2006; Crampton et al. Reference Crampton, Foote, Beu, Cooper, Matcham, Jones, Maxwell and Marshall2006a). In addition, New Zealand has remained geographically isolated for the duration of the Cenozoic at relatively static southern midlatitudes (King Reference King2000; Crampton et al. Reference Crampton, Foote, Beu, Maxwell, Cooper, Matcham, Marshall and Jones2006b). As a result, the majority of its Cenozoic to recent molluscan species are endemic (Beu and Maxwell Reference Beu and Maxwell1990; Spencer et al. Reference Spencer, Willan, Marshall and Murray2019), with <0.1% of the pre-Haweran (pre–0.34 Ma, see Fig. 1) shelfal molluscan species known to range beyond New Zealand (Crampton et al. Reference Crampton, Cooper, Beu, Foote and Marshall2010).

Figure 1. New Zealand Cenozoic timescale (after Raine et al. Reference Raine, Beu, Boyes, Campbell, Cooper, Crampton, Crundwell, Hollis, Morgans and Mortimer2015) with units in Ma. Analyses are undertaken at the resolution of the New Zealand stages shown here.
Materials and Methods
Materials
This study focuses on Cenozoic marine mollusks (bivalves, gastropods, and scaphopods) from New Zealand. Analyses within this study are reported for both genera and species, where subgenera are operationally elevated to genera and subspecies are excluded. Geologic ages are given in terms of New Zealand Cenozoic stages (Fig. 1) and reported analyses were undertaken at the resolution of these stages, yielding 24 time bins with an average duration of 2.75 Myr.
Three datasets were used within this study to generate biostratigraphic ranges for molluscan species and genera and determine their last known occurrences within the fossil record: (1) synoptic dataset; (2) the checklist of the living Mollusca recorded from the New Zealand Exclusive Economic Zone; and (3) the Fossil Record Electronic Database (FRED). Details of these three datasets follow.
Synoptic Dataset
The synoptic dataset provides biostratigraphic age ranges from the records of Cenozoic molluscan species from the New Zealand region and their inferred biological and ecological traits (Beu and Maxwell Reference Beu and Maxwell1990; Crampton et al. Reference Crampton, Beu, Cooper, Jones, Marshall and Maxwell2003, Reference Crampton, Foote, Beu, Cooper, Matcham, Jones, Maxwell and Marshall2006a; Cooper et al. Reference Cooper, Maxwell, Crampton, Beu, Jones and Marshall2006; Beu and Raine Reference Beu and Raine2009).
The Checklist of the Living Mollusca Recorded from the New Zealand Exclusive Economic Zone
This dataset provides a list of all described species and subspecies of recent and subrecent mollusks (5187 species) recorded within the New Zealand Exclusive Economic Zone (New Zealand's oceanic territory), as compiled and described by Spencer et al. (Reference Spencer, Willan, Marshall and Murray2019). Biostratigraphic ranges of mollusks in the synoptic dataset were updated using this dataset. Only species native to New Zealand and genera that comprise at least one native species were included so as to exclude introduced genera and species.
FRED
This is a collection-based database of fossil occurrences within New Zealand, and it has been well described elsewhere (Crampton et al. Reference Crampton, Foote, Cooper, Beu and Peters2011). Data relating to Cenozoic Mollusca were downloaded from FRED in September 2018 and subsequently revised with a newly updated version of the synonymy list employed by Crampton et al. (Reference Crampton, Foote, Beu, Maxwell, Cooper, Matcham, Marshall and Jones2006b, Reference Crampton, Foote, Cooper, Beu and Peters2011), which was modified to take account of relevant recent literature. Ambiguous identifications were removed from the dataset (including removal of taxa with the prefixes “cf.” and “aff.”), and only occurrences from collections restricted to a single time bin were retained. The FRED dataset was used to determine the last fossil occurrences of the genera and species used within this study. Taxa listed in the synoptic dataset but not identified within the FRED dataset were assumed to have a last fossil occurrence within their stage of origination as recorded in the synoptic dataset.
The final data analyzed here comprise the ranges of 1182 genera and 5223 species recorded in the synoptic dataset and their stage-by-stage occurrences as recorded in the FRED database.
Methods
We follow the methodology of Jablonski et al. (Reference Jablonski, Roy, Valentine, Price and Anderson2003) at genus and species level and repeat analyses to consider the effects of habitat and lithification on the Pull of the Recent. To allow for the disproportionately low representation of non-shelfal taxa in the New Zealand Cenozoic record (Beu and Maxwell Reference Beu and Maxwell1990; Rex et al. Reference Rex, Etter, Clain and Hill1999; Crampton et al. Reference Crampton, Beu, Cooper, Jones, Marshall and Maxwell2003), we consider the effect of the Pull of the Recent for all habitats and, separately, for shelfal taxa only. Taxa are considered shelfal if they are inferred to have been confined to, or to have ranged into, shelf water depths (< ~200 m water depth) (Crampton et al. Reference Crampton, Foote, Beu, Maxwell, Cooper, Matcham, Marshall and Jones2006b). To allow for the relative decrease of lithified versus unconsolidated collections in the Plio-Pleistocene (Crampton et al. Reference Crampton, Foote, Beu, Maxwell, Cooper, Matcham, Marshall and Jones2006b; Hendy Reference Hendy2009), we consider the effect of the Pull of the Recent on a subset of FRED collections for which matrix lithification information is available (approximately one-third of the collections used within this study). Matrix lithification is classified into four subjective categories within FRED: “hard,” “moderately hard,” “moderately soft,” and “unconsolidated.” Here we dichotomize the data, such that “unconsolidated” is considered unlithified and the remaining categories are aggregated into the lithified category. We limit analyses based on lithification to only genera and species recorded within FRED collections with matrix lithification data, using biostratigraphic ranges derived from the synoptic dataset. We also consider whether species duration has a significant effect on presence in the youngest fossil record. Species with a long duration are considered to have a duration >3.70 Myr; that is, those that originate before the end of the Opoitian Stage. Species with duration equal to or <3.70 Myr are termed “short duration.”
Analyses were repeated for the three taxonomic classes combined and with bivalve genera only to allow direct comparison with results from Jablonski et al. (Reference Jablonski, Roy, Valentine, Price and Anderson2003). For each time bin, the range-through diversity was calculated, defined here as the total number of unique taxa that range through or have a first or last occurrence within the focal time bin. Measures of diversity reported here are not sampling standardized and are referred to as “apparent” diversity; these measures are not intended to depict “true,” sampling-standardized diversity history. The data were filtered to identify which taxa have been recorded in the last 5.33 Myr, similar to Jablonski et al. (Reference Jablonski, Roy, Valentine, Price and Anderson2003), and repeated at three progressively shorter intervals (resolving to New Zealand stages): 3.7 Ma (Mangapanian), 2.4 Ma (Nukumaruan), and 1.63 Ma (Castlecliffian) to recent. This is intuitively reasonable, as the average duration of species is shorter than that of genera, so the effect of the Pull of the Recent is expected to manifest at shorter timescales.
To determine whether particular attributes of taxa control their likely occurrence in the youngest fossil record, we examined a number of biological traits recorded within the synoptic dataset. Traits include shell mineralogical composition (aragonitic or calcitic), shell size (dichotomized as <10 mm or >10 mm maximum linear dimension), habitat (shelfal vs. non-shelfal, see previous definition of shelfal), and taxonomic class (bivalve, gastropod, or scaphopod). Calcitic taxa are classed as such if they have a shell component that could, in the absence of aragonite, be identified to species level (see Crampton et al. [Reference Crampton, Foote, Beu, Maxwell, Cooper, Matcham, Marshall and Jones2006b] and Foote et al. [Reference Foote, Crampton, Beu and Nelson2015] for further details). Shell size is based on the maximum skeletal dimension of an average adult (Cooper et al. Reference Cooper, Maxwell, Crampton, Beu, Jones and Marshall2006). In cases for which species-specific traits have not or could not be determined, they were established at the genus level so long as all species within that genus displayed the same traits. The traits of the taxa with and without a fossil record within the focal time interval, where known, were tabulated in 2 × 2 contingency tables (excluding scaphopods from taxonomic class due to low number of known species). This was repeated for shelfal mollusks only and for bivalves and gastropods separately. We report both the maximum-likelihood chi-square (ML χ2, or G) test statistic and the log odds ratio to test for independence and association between the taxa missing and the taxa present within the specified intervals. The standard continuity correction was applied during the calculation of the log odds ratio to allow for zero entries (Agresti and Kateri Reference Agresti, Kateri and Lovric2011). Family-wise error was corrected using the false discovery rate, following the procedure of Curran-Everett (Reference Curran-Everett2000). See Agresti and Kateri (Reference Agresti, Kateri and Lovric2011) for a detailed description of these analytical methods. All analyses and computations reported here were undertaken using R (R Development Core Team 2020).
Results
Of the 401 extant molluscan genera with a fossil record in the Cenozoic, 98% (100% for bivalves) are represented in the fossil record between the Opoitian (5.33 Ma) to recent, decreasing to 88% in the Castlecliffian (1.63 Ma) to recent (Fig. 2, Table 1). Of the 673 extant molluscan species with a fossil record in the Cenozoic, 98% are represented in the fossil record between the Opoitian (5.33 Ma) to recent, decreasing to 80% in the Castlecliffian (1.63 Ma) to recent (Fig. 2). This decrease in representation is more pronounced in molluscan species with long durations (>3.70 Myr), 74%, an effect that relates to poor exposure of deep-water facies in the youngest part of the stratigraphic record and consequent absence of preexisting, deep-water species from the youngest fossil collections. Excluding non-shelfal taxa reduces the effect of the Pull of the Recent slightly for genera and species and for species with long durations (see Table 1). Lithification has minimal effect on the Pull of the Recent for the subset of FRED collections with matrix lithification data, with <1% difference in the percentage of taxa (both genera and species) with a fossil record between analyses based on lithified collections only and those based on all collections with matrix lithification data (see Table 1 and Fig. 3).

Figure 2. Genus- and species-level range-through diversity over the last 15.9 Myr (Clifdenian to recent) for all mollusks and shelfal mollusks only, with (solid line) and without (dashed line) the Pull of the Recent. Shaded bars show the duration of the time bins utilized, equivalent to the New Zealand stages.
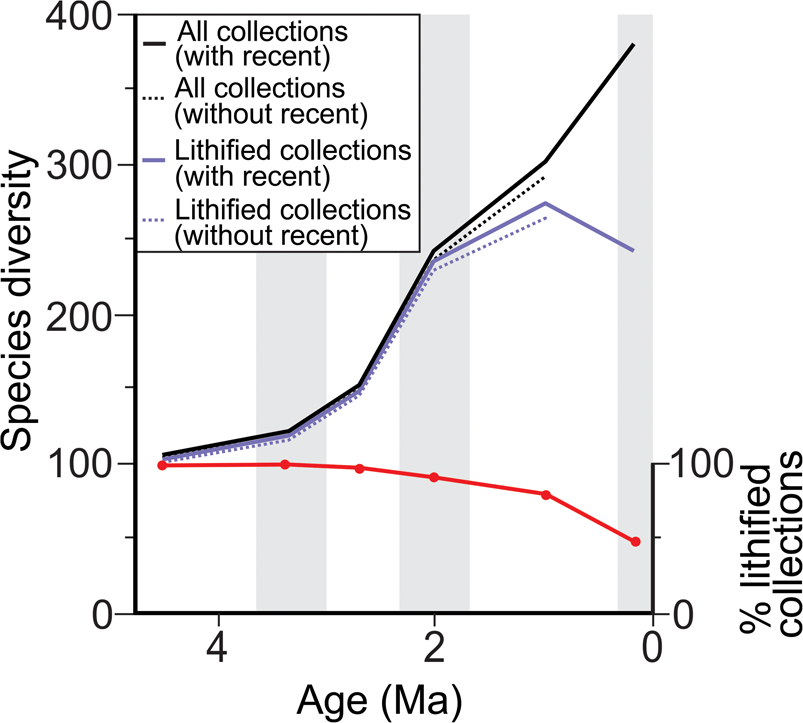
Figure 3. Species-level range-through apparent diversity over the last 5.33 Myr (Plio-Pleistocene) for molluscan species from a subset of the FRED database with matrix lithification data available (approximately a third of collections used within this study) and for lithified collections only, with (solid line) and without (dashed line) the Pull of the Recent. Relative percentage of lithified collections is based on the relative percentage of lithified to unlithified collections from the subset of FRED collections with matrix lithification data (see “Methods”). Shaded bars show the duration of the time bins utilized, equivalent to the New Zealand stages.
Table 1. The impact of the Pull of the Recent, expressed as the percentage of taxa with a fossil record within the listed time intervals. Results are reported in seven categories: (1) all molluscan genera; (2) bivalve genera, to allow direct comparison with the results of Jablonski et al. (Reference Jablonski, Roy, Valentine, Price and Anderson2003); (3) all molluscan species; (4) all molluscan species considered to have a long duration; (5) molluscan species considered to have a short duration; and (6) genera and (7) species from all FRED collections with matrix lithification data and from lithified collections only. Results reported for categories 1–5 also consider the impact of inferred habitat, providing results for taxa from all habitats and shelfal taxa only. *Species with a long duration are defined as species that have a first occurrence within or prior to the Opoitian and species with short durations are considered to have a have a first occurrence after the Opoitian. Therefore the Opoitian and Waipipian are omitted from species with short durations, as no species will have a first occurrence in the Opoitian and all species with a first occurrence in the Waipipian will have a fossil record within the Waipipian. **Only includes genera or species within a subset of the FRED data that has matrix lithification data.

We report the results for maximum-likelihood chi-square test and the log odds ratio for the traits of species missing and present from the Nukumaruan (2.4 Ma) and Castlecliffian (1.63 Ma) to recent in Table 2. Genera and longer time intervals were not considered due to low numbers of missing taxa with known traits. There is equivocal evidence to suggest that taxonomic class, size (bivalves only), and habitat have statistically significant effects on representation in the youngest fossil record (see Table 2 for relevant time intervals and strength and direction of associations). However, in all cases the effect size is not large according to the classification of Chen et al. (Reference Chen, Cohen and Chen2010), wherein a large effect size is classified as a log (log base 10) odds ratio > ~0.8, and p-values are not statistically significant at the 5% level once the effects of family-wise error are taken into account.
Table 2. Values for the maximum likelihood (ML) chi-square test and log odds ratio. Calculated from 2 × 2 contingency tables of traits of extant species that have a fossil record within or missing from Nukumaruan (2.4 Ma) and Castlecliffian (1.63 Ma) to recent. None of the p-values are significant at the 5% level once family-wise error is taken into account (Curran-Everett Reference Curran-Everett2000). Log odds ratios significantly above or below 0 indicate association between factors, while a value of 0.0 would indicate independence between factors. The direction of the interaction is determined by the ordering of variables. For the analyses reported here, a negative log odds ratio suggests that the following attributes for each variable are more strongly associated with missing fossil record: composition: calcitic; size: larger (>10 mm); shelf level: shelfal; class: bivalves. A positive log odds ratio would indicate the corresponding paired attribute for each variable is more strongly associated (e.g., aragonitic for composition).

Discussion and Summary
The apparent range-through diversity for New Zealand molluscan genera and species shows a general pattern of long-term increase through the Cenozoic (Fig. 4), as observed in previous studies of global range-through diversity (Jablonski et al. Reference Jablonski, Roy, Valentine, Price and Anderson2003). In contrast to these earlier studies, however, the apparent diversity of New Zealand mollusks peaks in the Otaian and Altonian Stages (21.7–15.9 Ma) rather than in the recent. This peak in apparent diversity is associated with the influx of a large number of genera from warmer areas at this time (Beu and Maxwell Reference Beu and Maxwell1990) and coincides with peak warmth during the early Miocene climatic optimum. In addition, the apparent range-through diversity of species is lower than that of genera (Fig. 4) for the majority of the Cenozoic. This is due to the use of the range-through diversity metric, which results in greater range extension with increasing taxonomic rank. This phenomenon is not observed when considering raw within-bin richness for genera and species and is simply a consequence of genera not being represented by named species within a given time bin (result not shown). Patterns of apparent species range-through diversity shown in Figure 3 differ from those of Figure 2, because species included are limited to a subset of FRED collections with matrix lithification data. Notwithstanding this, excluding unlithified collections does notably decrease apparent range-through diversity in the Castlecliffian (1.63–0.34 Ma) and Haweran (0.34–0 Ma) stages, but is unlikely to significantly alter the apparent Cenozoic diversity trajectory described previously. Detailed discussion on diversity patterns are out of the scope of this study and have been reviewed elsewhere for the Cenozoic New Zealand molluscan fossil record (Crampton et al. Reference Crampton, Foote, Beu, Maxwell, Cooper, Matcham, Marshall and Jones2006b, Reference Crampton, Foote, Cooper, Beu and Peters2011).

Figure 4. Cenozoic genus and species level range-through diversity for all mollusks. Shaded bars show the duration of the time bins utilized, equivalent to the New Zealand stages.
The Pull of the Recent effects <2% of genera when considering taxa missing from the youngest ~5 Myr of the New Zealand fossil record. This result is in agreement with the global estimate of the Pull of the Recent for marine mollusks reported for a similar time interval (Jablonski et al. Reference Jablonski, Roy, Valentine, Price and Anderson2003). The impact of the Pull of the Recent on species has not been examined previously, and we show here that this effect is also minor (<4%) when considering longer time intervals, similar to that of consolidated time bins used in previous studies of New Zealand shelfal mollusks (Crampton et al. Reference Crampton, Foote, Cooper, Beu and Peters2011). The impact of the Pull of the Recent increases significantly (up to 20.5%) when considering smaller time intervals (<1.63 Ma). The taxonomic composition of mollusks missing from the youngest part of the fossil record cannot easily be explained by effects related to shell mineralogical composition, body size, habitat, or taxonomic class. Lithification has minimal effect on the impact of the Pull of the Recent, but does have a notable effect on apparent range-through diversity in the Pleistocene.
Given the widespread use of range-through diversity measures in previous studies, and the richness of data compilations that record taxonomic first and last occurrences, it is important to quantify the magnitude of the Pull of the Recent in the fossil record, particularly due to the contrasting results on the magnitude of diversity increase toward the recent both globally, and regionally in New Zealand (Beu Reference Beu1990; Crampton et al. Reference Crampton, Foote, Beu, Maxwell, Cooper, Matcham, Marshall and Jones2006b, Reference Crampton, Foote, Cooper, Beu and Peters2011; Hendy Reference Hendy2009). Here we demonstrate that, for a tectonically active region and for genera and species, the Pull of the Recent does not exert a strong effect on apparent diversity patterns over the Cenozoic. This implies that the apparent rise in regional marine diversity either represents a true biological signal, or results from other confounding effects not considered here, or reflects a combination of factors.
Acknowledgments
We thank A. I. Miller and S. M. Holland for their constructive reviews and comments, both of which have helped greatly improve and clarify this article. This work is funded by Victoria University of Wellington through the Commonwealth Scholarship. We acknowledge use of the data in the New Zealand Fossil Record File, administered by the Geological Society of New Zealand and GNS Sciences (http://www.fred.org.nz) and the checklist of the recent Mollusca recorded from the New Zealand Exclusive Economic Zone (http://www.molluscs.otago.ac.nz).


