


Being overweight or obese contributes to an increased risk for many chronic diseases, including CVD, type 2 diabetes and some cancers( Reference Bailin, Byrne and Lewis 1 , Reference Tang-Peronard, Andersen and Jensen 2 ). Since 1980, worldwide prevalence of obesity has almost doubled( 3 ). While excess energy intake and a sedentary lifestyle are known risk factors for gaining weight, there has been increasing interest in the effects that environmental chemicals may have on the development of obesity( Reference Thayer, Heindel and Bucher 4 ). Food and water provide us with essential nutrients; however, food and water are also sources of exposure to environmental chemicals, including pesticides( Reference Lu, Barr and Pearson 5 , Reference Melnyk, Xue and Brown 6 ), food packaging and processing-derived contaminants such as bisphenol A (BPA) and phthalates( Reference Welshons, Nagel and vom Saal 7 – 15 ), and naturally occurring contaminants such as arsenic( Reference Bundschuh, Nath and Bhattacharya 16 , Reference Heikens, Panaullah and Meharg 17 ). Chemicals detected in the food and water supply include endocrine-disrupting chemicals, a class of chemicals that interfere in some way with the normal functioning of the endocrine system and includes chemicals that may alter hormonal regulation of body weight.
First synthesized in 1891, BPA is now one of the highest-volume chemicals produced( Reference Rubin 18 ), resulting in widespread human exposure( Reference Vandenberg, Chahoud and Heindel 19 ). BPA is used as a component of polycarbonate plastics and in epoxy resins( Reference Rubin 18 ). The list of products currently made with polycarbonate plastics or lined with epoxy resins is extensive, and includes food and beverage storage containers and packaging( Reference Vandenberg, Hauser and Marcus 20 ). The use of BPA in food packaging, along with the ability of BPA to leach into the food( Reference Welshons, Nagel and vom Saal 7 ), has led many to believe that diet is a major route of human BPA exposure( Reference Welshons, Nagel and vom Saal 7 – Reference Cao, Perez-Locas and Dufresne 12 ). BPA has also been found in products made from recycled paper( Reference Liao and Kannan 21 ), dust particles( Reference Loganathan and Kannan 22 – Reference Rudel, Camann and Spengler 24 ), thermal receipt paper( Reference Geens, Goeyens and Kannan 25 , Reference Geens, Aerts and Berthot 26 ), soil, tap water and surface water( Reference Santhi, Sakai and Ahmad 27 – Reference Kang, Kondo and Katayama 32 ).
In 2002, Baillie-Hamilton( Reference Baillie-Hamilton 33 ) put forth a hypothesis that endocrine-disrupting chemicals could contribute to weight gain and that the historical toxicological emphasis on weight loss as an indicator of toxicity could have resulted in weight gain going largely unnoticed as an adverse effect of exposure to endocrine-disrupting chemicals. These observations, and results from animal and in vitro studies, have led to increased interest in evaluating the potential for environmental exposures to act as ‘obesogens’. Obesogens were defined by Grun and Blumberg as ‘molecules that inappropriately regulate lipid metabolism and adipogenesis to promote obesity’( Reference Grun and Blumberg 34 ).
In vitro studies have shown that BPA has the ability to bind to thyroid hormone receptors( Reference Zoeller 35 ) and human studies have observed associations between higher BPA levels and altered levels of thyroid hormones( Reference Meeker, Calafat and Hauser 36 – Reference Wang, Lu and Xu 40 ). Thyroid hormones regulate basal metabolism and the impact of even small alterations to thyroid hormone levels on body composition is evidenced by weight changes in patients with thyroid dysfunction( Reference de Moura Souza and Sichieri 41 – Reference Pucci, Chiovato and Pinchera 43 ). Another mechanism by which BPA exposure may lead to weight gain is through activation of PPARγ. PPARγ is highly expressed in adipose tissue and regulates adipocyte differentiation and lipid metabolism( Reference Berger 44 ). In vitro data suggest BPA has the ability to bind to PPARγ, which could trigger increased adipocyte differentiation and/or uptake of lipids by adipocytes, thus influencing body composition( Reference Pereira-Fernandes, Demaegdt and Vandermeiren 45 – Reference Masuno, Iwanami and Kidani 47 ).
Findings from animal studies on the association between BPA exposure and weight gain have been inconsistent( Reference Thayer, Heindel and Bucher 4 ), which can likely be attributed to variability in methodologies, doses, exposure routes and outcomes, and differences between species and genders( 48 ). A 2012 report from the National Institute of Environmental Health Sciences concluded there is suggestive evidence that BPA may act as an obesogen, but that further research is required( Reference Holtcamp 49 ). The majority of research on the association between BPA and weight gain to date has focused on in utero and early-life exposures. Exposure to low levels of BPA perinatally( Reference Ashby, Tinwell and Haseman 50 – Reference Somm, Schwitzgebel and Toulotte 58 ), and during adolescence( Reference Akingbemi, Sottas and Koulova 59 , Reference Markey, Michaelson and Veson 60 ), has been shown to result in increased weight in rodents. Few studies have evaluated the risk of obesity associated with BPA exposure in adult animals.
It is important for practitioners and researchers working to reduce obesity rates to be aware of the presence of non-nutrient exposures in the diet and the potential for these exposures to contribute to risk for becoming overweight or obese. The present systematic review summarizes the currently available literature evaluating the association between BPA levels and risk of overweight or obesity in adult human populations (≥18 years). Limitations of current studies and recommendations for future studies will also be addressed.
Methods
The Population, Intervention, Comparison, and Outcome (PICO) method( Reference da Costa Santos, de Mattos Pimenta and Nobre 61 ) was used to construct a focused research question for the systematic review, which was ‘What is the risk or prevalence of obesity (outcome) among human adults (≥18 years) (population) who have higher BPA exposure (intervention/exposure) compared with those who have low BPA exposure (comparison)?’
To be included in the systematic review, a study had to be published in a peer-reviewed journal, written in English and report data on the association between urine or serum BPA levels and BMI (kg/m2) in an adult population (≥18 years). BMI was not required to be the primary outcome evaluated in the study. Studies were excluded if they did not present data for the association (with corresponding P value and/or confidence interval) between BPA exposure and BMI (e.g. correlation, linear regression, logistic regression). Studies that included pregnant women were excluded.
For the review, systematic searches of PubMed, EMBASE and Web of Science to 1 August 2014 were performed using the keywords ‘body weight’, ‘body size’, ‘body composition’, ‘BMI’, ‘fat mass’, ‘overweight’ or ‘obesity’ and ‘Bisphenol A’ or ‘BPA’. The search was limited to English articles, excluded conference abstracts and identified 901 articles. Data on associations with other markers of obesity and weight gain, such as waist circumference (WC) and weight, are included in the results presented in the current systematic review. However, data on these outcomes were not a requirement for inclusion because very few studies evaluated these outcomes. Studies that presented duplicate data from the same study population from an already included study were excluded. In each case, the article where BMI was a primary outcome of interest was included in the review( Reference Carwile and Michels 62 – Reference Wang, Li and Chen 64 ). Two articles evaluated US National Health and Nutrition Examination Survey (NHANES) data with BMI as the primary outcome. Both studies were included in the systematic review because of differences in analysis approaches, study years included in the analyses and no obvious reason to justify including one over the other( Reference Carwile and Michels 62 , Reference Shankar, Teppala and Sabanayagam 63 ).
Titles, abstracts and articles were then reviewed for relevance to the research question. Fourteen articles were found to be eligible for inclusion( Reference Carwile and Michels 62 – Reference Yang, Hong and Oh 75 ). Four additional articles were identified in reference lists( Reference Yang, Kim and Chang 76 – Reference Olsen, Lind and Lind 79 ), for a final total of eighteen included articles. Reasons for exclusion included: not the study population of interest, no data on association between BPA levels and BMI, duplicate data, animal or in vitro study, review article and other (e.g. laboratory methods validation, did not evaluate BPA, etc.; Fig. 1).
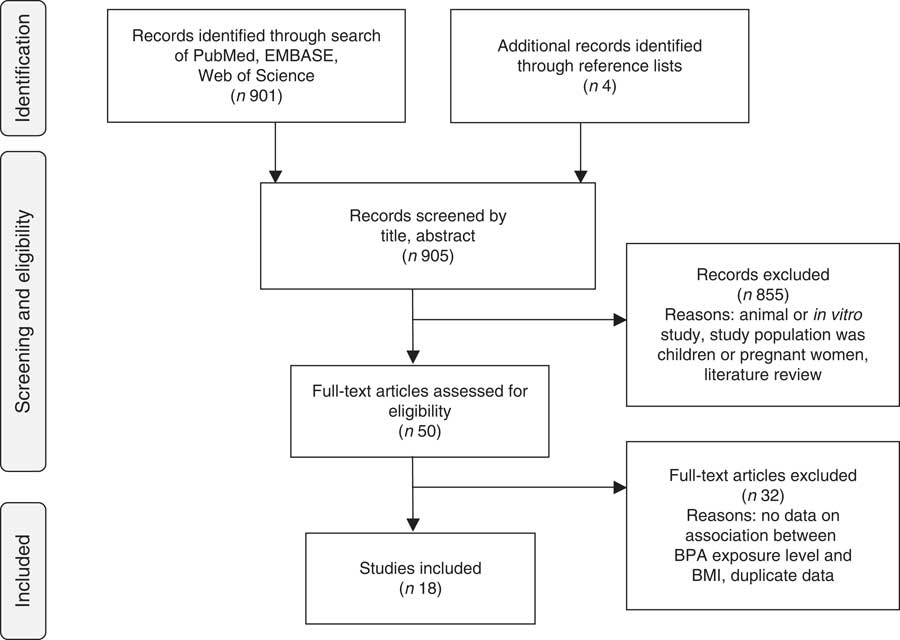
Fig. 1 Article identification flow diagram (BPA, bisphenol A)
Using the Strengthening the Reporting of Observational Studies in Epidemiology (STROBE) statement checklist as a guide( Reference von Elm, Altman and Egger 80 ), the following information, if available, was abstracted from each study: first author; year of publication; study location; study design; study population (age, gender, health status); exposure assessment; body composition measurement methods; data analysis approach; and study results related to body composition and BPA levels. Data analysis approach was included to evaluate consistencies in analysis methods and to evaluate assessments of potential confounders. For exposure assessment methods, article abstraction focused on the type of biospecimens collected, reported materials used in collection, storage and processing, and BPA assay methodology.
Article quality was assessed using a quality rating system adapted from the rating system developed by the Academy of Nutrition and Dietetics( 81 ). Study design classification was based on the data analysis approach. For example, studies that evaluated data collected at the same time point from a cohort study were classified as cross-sectional. To receive a positive quality study rating, at least five of the validity criteria (questions) had to be met. Specifically, methods had to be appropriate and adequately described for subject selection, comparability of study subjects (appropriate control of confounders) and measurement of BPA levels (exposure) and body composition (BMI – outcome). A study with five or more ‘no’ or ‘unclear’ answers to the validity questions was rated as negative quality. When an article contained insufficient information to ascertain a clear ‘yes’/‘no’ for meeting a criterion, it was classified as ‘unclear’ and was considered as not meeting the criterion. All other studies were classified as neutral quality.
Results
To date, eighteen studies have presented data on associations between urinary or serum BPA levels and body composition( Reference Carwile and Michels 62 – Reference Olsen, Lind and Lind 79 ). Table 1 summarizes the studies and their findings. Thirteen studies were cross-sectional( Reference Carwile and Michels 62 – Reference Wang, Li and Chen 64 , Reference Zhao, Bi and Ma 67 , Reference Takeuchi and Tsutsumi 68 , Reference Ko, Hwang and Park 71 – Reference Takeuchi, Tsutsumi and Ikezuki 73 , Reference Yang, Hong and Oh 75 – Reference Kim, Oh and Hwang 78 ), two were case–control( Reference Tarantino, Valentino and Di Somma 65 , Reference Melzer, Osborne and Henley 70 ) and two were prospective cohort studies( Reference Galloway, Cipelli and Guralnik 66 , Reference Song, Hauser and Hu 74 ), but all data analyses were cross-sectional. One of the cohort studies did prospectively evaluate rate of weight change, but only evaluated the association between BMI and urinary BPA levels at baseline( Reference Song, Hauser and Hu 74 ). The studies were conducted in the USA (n 5)( Reference Carwile and Michels 62 , Reference Shankar, Teppala and Sabanayagam 63 , Reference Melzer, Osborne and Henley 70 , Reference Song, Hauser and Hu 74 , Reference Bloom, Kim and Vom Saal 77 ), Republic of Korea (n 5)( Reference Ko, Hwang and Park 71 , Reference Lee, Park and Bae 72 , Reference Yang, Hong and Oh 75 , Reference Yang, Kim and Chang 76 , Reference Kim, Oh and Hwang 78 ), China (n 2)( Reference Wang, Li and Chen 64 , Reference Zhao, Bi and Ma 67 ), Italy (n 2)( Reference Tarantino, Valentino and Di Somma 65 , Reference Galloway, Cipelli and Guralnik 66 ), Japan (n 2)( Reference Takeuchi and Tsutsumi 68 , Reference Takeuchi, Tsutsumi and Ikezuki 73 ), Sweden (n 1)( Reference Olsen, Lind and Lind 79 ) and the UK (n 1)( Reference Melzer, Osborne and Henley 70 ). For six of the articles, body composition (BMI, WC and/or weight) was the primary outcome of interest( Reference Carwile and Michels 62 – Reference Wang, Li and Chen 64 , Reference Zhao, Bi and Ma 67 , Reference Ko, Hwang and Park 71 , Reference Song, Hauser and Hu 74 ). Seven studies included only women( Reference Tarantino, Valentino and Di Somma 65 , Reference Zhao, Bi and Ma 67 , Reference Mok-Lin, Ehrlich and Williams 69 , Reference Takeuchi, Tsutsumi and Ikezuki 73 , Reference Song, Hauser and Hu 74 , Reference Bloom, Kim and Vom Saal 77 , Reference Kim, Oh and Hwang 78 ), nine of the studies were in general adult populations( Reference Carwile and Michels 62 – Reference Wang, Li and Chen 64 , Reference Galloway, Cipelli and Guralnik 66 , Reference Zhao, Bi and Ma 67 , Reference Melzer, Osborne and Henley 70 , Reference Ko, Hwang and Park 71 , Reference Yang, Hong and Oh 75 , Reference Yang, Kim and Chang 76 ), one study included men and women ≥60 years( Reference Lee, Park and Bae 72 ) and another included only 70-year-old men and women( Reference Olsen, Lind and Lind 79 ).
Table 1 Human studies evaluating BMI in relation to bisphenol A in adult populations (≥18 years)

BPA, bisphenol A; IVF, in vitro fertilization; BMD, bone mineral density; PCOS, polycystic ovary syndrome; WC, waist circumference; CAD, coronary artery disease; NHS, Nurses’ Health Study; NHS II, Nurses’ Health Study II; UGT, UDP-glucuronosyltransferase; SULT, sulfotransferase; IBS, irritable bowel syndrome; NHANES, National Health and Nutrition Examination Survey; InCHIANTI, Invecchiare in Chianti, ageing in the Chianti area; EPIC, European Prospective Investigation on Cancer and Nutrition; MI, myocardial infarction; SBP, systolic blood pressure; DBP, diastolic blood pressure; Q, quartile; LOD, limit of detection; PET, polyethylene terephthalate; PP, polypropylene; CDC, Centers for Disease Control and Prevention; LOQ, limit of quantification; SG, specific gravity; IQR, interquartile range; HC, hip circumference; WHR, waist-to-hip ratio; TC, total cholesterol; HDL-C, HDL cholesterol; LDL-C, LDL cholesterol; CRP, C-reactive protein; FPG, fasting plasma glucose; ALT, alanine aminotransferase; GTT, γ-glutamyl transpeptidase.
Quality score does not necessarily reflect the study quality for the primary outcomes of the study. Outcome evaluations and data analysis quality evaluations were evaluated specifically for the presented associations between BMI and BPA, which were often not the primary outcome of interest in some of these studies.
* Academy of Nutrition and Dietetics Evidence Analysis Manual( 81 ).
All studies evaluated associations using a single cross-sectional measurement of BPA, but biospecimen collection, laboratory assay methodology and data analysis approaches varied across the studies. Six studies measured serum BPA levels; four using a competitive ELISA( Reference Tarantino, Valentino and Di Somma 65 , Reference Takeuchi and Tsutsumi 68 , Reference Takeuchi, Tsutsumi and Ikezuki 73 , Reference Kim, Oh and Hwang 78 ), one using HPLC paired with an electrochemical detector( Reference Bloom, Kim and Vom Saal 77 ) and one using LC and tandem MS (LC–MS/MS)( Reference Olsen, Lind and Lind 79 ). Ten studies measured total BPA in spot urine samples( Reference Carwile and Michels 62 – Reference Wang, Li and Chen 64 , Reference Zhao, Bi and Ma 67 , Reference Melzer, Osborne and Henley 70 – Reference Lee, Park and Bae 72 , Reference Song, Hauser and Hu 74 – Reference Yang, Kim and Chang 76 ), one study used the geometric mean for two spot samples collected during the same in vitro fertilization cycle( Reference Mok-Lin, Ehrlich and Williams 69 ) and one study measured total BPA in a 24 h urine sample( Reference Galloway, Cipelli and Guralnik 66 ). Urinary BPA levels were measured using GC–MS( Reference Shankar, Teppala and Sabanayagam 63 ) and/or HPLC and tandem MS (HPLC–MS/MS)( Reference Carwile and Michels 62 – Reference Wang, Li and Chen 64 , Reference Galloway, Cipelli and Guralnik 66 , Reference Zhao, Bi and Ma 67 , Reference Ko, Hwang and Park 71 , Reference Lee, Park and Bae 72 , Reference Song, Hauser and Hu 74 ).
Data analysis approaches included correlation( Reference Tarantino, Valentino and Di Somma 65 , Reference Zhao, Bi and Ma 67 – Reference Mok-Lin, Ehrlich and Williams 69 , Reference Takeuchi, Tsutsumi and Ikezuki 73 , Reference Yang, Hong and Oh 75 – Reference Kim, Oh and Hwang 78 ), χ 2 tests( Reference Tarantino, Valentino and Di Somma 65 , Reference Melzer, Osborne and Henley 70 ), ANOVA( Reference Takeuchi, Tsutsumi and Ikezuki 73 ), linear regression( Reference Carwile and Michels 62 , Reference Wang, Li and Chen 64 , Reference Galloway, Cipelli and Guralnik 66 , Reference Ko, Hwang and Park 71 , Reference Song, Hauser and Hu 74 , Reference Olsen, Lind and Lind 79 ), logistic regression( Reference Carwile and Michels 62 – Reference Wang, Li and Chen 64 ) and unspecified analysis approach( Reference Lee, Park and Bae 72 ). Differences in data analysis approaches limited the ability to perform meta-analyses.
The six studies that measured serum BPA concentrations observed wide ranges of serum BPA levels across study participants. While Tarantino et al. observed means <0·70 ng/ml( Reference Tarantino, Valentino and Di Somma 65 ), Bloom et al. observed a mean of 7·22 ng/ml and a median of 2·53 ng/ml( Reference Bloom, Kim and Vom Saal 77 ). Three of the studies reported a limit of detection (LOD) or limit of quantification (LOQ)( Reference Bloom, Kim and Vom Saal 77 – Reference Olsen, Lind and Lind 79 ), but only Bloom et al. reported the number of participants below the LOD/LOQ (13·6 %)( Reference Bloom, Kim and Vom Saal 77 ).
Mean or median urinary BPA levels in spot urine samples were difficult to compare across studies given that some studies reported means( Reference Carwile and Michels 62 , Reference Shankar, Teppala and Sabanayagam 63 , Reference Zhao, Bi and Ma 67 , Reference Mok-Lin, Ehrlich and Williams 69 , Reference Melzer, Osborne and Henley 70 , Reference Yang, Hong and Oh 75 , Reference Yang, Kim and Chang 76 ), some reported medians( Reference Wang, Li and Chen 64 , Reference Song, Hauser and Hu 74 ) and some reported levels unadjusted for concentration( Reference Shankar, Teppala and Sabanayagam 63 , Reference Zhao, Bi and Ma 67 , Reference Mok-Lin, Ehrlich and Williams 69 , Reference Melzer, Osborne and Henley 70 , Reference Yang, Kim and Chang 76 ), while others reported creatinine-adjusted concentrations( Reference Carwile and Michels 62 , Reference Wang, Li and Chen 64 , Reference Yang, Hong and Oh 75 ). LOD/LOQ were relatively similar across studies and ranged from 0·063 to 0·50 ng/ml. Four studies did not report an LOD/LOQ( Reference Zhao, Bi and Ma 67 , Reference Ko, Hwang and Park 71 , Reference Song, Hauser and Hu 74 , Reference Yang, Kim and Chang 76 ). Most studies reported frequent detection of BPA in urine samples. Seven studies did not report the number of samples below the LOD/LOQ. In three of these studies, data presented in the paper indicated detectable urinary BPA levels in at least 75 %( Reference Wang, Li and Chen 64 ), 90 %( Reference Shankar, Teppala and Sabanayagam 63 ) and 95 %( Reference Galloway, Cipelli and Guralnik 66 ) of the population. Among studies that reported the frequency of BPA detection in participants’ urine, detection ranged from 77·9 to 97·5 % of samples( Reference Carwile and Michels 62 , Reference Mok-Lin, Ehrlich and Williams 69 , Reference Melzer, Osborne and Henley 70 , Reference Yang, Hong and Oh 75 , Reference Yang, Kim and Chang 76 ).
Among the studies that measured serum BPA, results were conflicting. Two studies( Reference Tarantino, Valentino and Di Somma 65 , Reference Takeuchi, Tsutsumi and Ikezuki 73 ) observed positive correlations between serum BPA levels and BMI. The other four studies did not observe an association between serum BPA concentrations and BMI( Reference Takeuchi and Tsutsumi 68 , Reference Bloom, Kim and Vom Saal 77 – Reference Olsen, Lind and Lind 79 ). Only one of these studies reported adjusting for potential confounders, such as age or health status( Reference Olsen, Lind and Lind 79 ).
Among the six studies that did not evaluate BMI as the primary outcome compared with urinary BPA levels, one study observed associations between body composition and urinary BPA levels( Reference Galloway, Cipelli and Guralnik 66 ) and five observed no association( Reference Mok-Lin, Ehrlich and Williams 69 , Reference Melzer, Osborne and Henley 70 , Reference Lee, Park and Bae 72 , Reference Yang, Hong and Oh 75 , Reference Yang, Kim and Chang 76 ). Galloway et al. did not find BMI to be statistically significantly associated with urinary BPA levels measured in a 24 h urine collection. However, WC (continuous) and weight (continuous) were statistically significantly positively associated with 24 h urinary BPA levels( Reference Galloway, Cipelli and Guralnik 66 ). Melzer et al. did not find an association between BMI and urinary BPA category (≤1·243 ng/ml v. >1·243 ng/ml), although there was a higher percentage of overweight and obese participants (66·3 %) in the high BPA category compared with the low BPA category (61·8 %)( Reference Melzer, Osborne and Henley 70 ).
Four of the six studies where body composition was the primary outcome observed statistically significant positive associations between BMI and urinary BPA levels( Reference Carwile and Michels 62 – Reference Wang, Li and Chen 64 , Reference Zhao, Bi and Ma 67 ). Zhao et al. ( Reference Zhao, Bi and Ma 67 ) observed statistically significant positive correlations (adjusted for age) between urinary BPA levels and BMI, WC and hip circumference in premenopausal women. Wang et al. found a small, but statistically significant, positive trend between spot urine BPA levels and both BMI (continuous) and WC (continuous)( Reference Wang, Li and Chen 64 ). That study observed marginally statistically higher odds of being overweight (24 kg/m2≤BMI<30·0 kg/m2, OR=1·24; 95 % CI 0·97, 1·59) among participants in the highest BPA quartile (total urinary BPA>1·43 ng/ml) compared with those in the lowest quartile (total urinary BPA≤0·47 ng/ml), and being in the highest BPA quartile was associated with 50 % higher odds of being obese (BMI≥30·0 kg/m2; 95 % CI 1·15, 1·60) compared with those in the lowest BPA quartile. Wang et al. also observed higher odds of elevated WC (≥85 cm in women, ≥90 cm in men) among participants in the highest BPA quartile (OR=1·20; 95 % CI 1·03, 1·60) compared with those in lowest BPA quartile. The study by Song et al. found no association between cross-sectional BMI and urinary BPA levels measured at baseline. However, that study did observe a statistically significant positive association between urinary BPA levels and annual weight change rate (quartile 4 v. quartile 1: β=0·23 kg/year, 95 % CI 0·07, 0·38)( Reference Song, Hauser and Hu 74 ). Similarly, Ko et al. observed inconsistent results depending on analysis approach and measure of body composition used( Reference Ko, Hwang and Park 71 ). Regardless of analysis approach, WC was associated with urinary BPA levels. Conversely, hip circumference and weight were not associated with urinary BPA levels, regardless of analysis approach. Percentage body fat and BMI were associated with urinary BPA when evaluated as continuous variables only.
Using NHANES 2003–2008 data, Shankar et al. found higher odds of general obesity (BMI≥30·0 kg/m2; OR=1·69; 95 % CI 1·30, 2·20) and central obesity (WC≥88 cm in women, ≥102 cm in men; OR=1·59; 95 % CI 1·21, 2·09) among those in the highest BPA quartile compared with those in the lowest BPA quartile( Reference Shankar, Teppala and Sabanayagam 63 ). Carwile and Michels performed analyses using NHANES 2003–2006 data and the findings were consistent with those of Shankar et al. Those in the highest urinary BPA level quartiles (total urinary BPA>4·20 ng/ml) had higher odds of being overweight (25·0 kg/m2≤BMI<30·0 kg/m2; OR=1·31; 95 % CI 0·80, 2·14) or obese (BMI≥30·0 kg/m2; OR=1·76; 95 % CI 1·06, 2·94) and having an elevated WC (≥88 cm in women, ≥102 cm in men; OR=1·58; 95 % CI 1·03, 2·42) compared with participants in the first quartile (total urinary BPA<1·10 ng/ml). While higher urinary BPA levels were associated with general and central obesity in this study, there was not a clear linear pattern to the association( Reference Carwile and Michels 62 ).
Twelve of the eighteen studies were rated as negative quality( Reference Tarantino, Valentino and Di Somma 65 , Reference Zhao, Bi and Ma 67 – Reference Mok-Lin, Ehrlich and Williams 69 , Reference Ko, Hwang and Park 71 – Reference Takeuchi, Tsutsumi and Ikezuki 73 , Reference Yang, Hong and Oh 75 – Reference Olsen, Lind and Lind 79 ), six were neutral quality( Reference Carwile and Michels 62 – Reference Wang, Li and Chen 64 , Reference Galloway, Cipelli and Guralnik 66 , Reference Melzer, Osborne and Henley 70 , Reference Song, Hauser and Hu 74 ) and none were positive quality. The lack of positive quality studies was typically due to limitations and issues related to BPA exposure measurement (validity question 5), temporality problems (validity question 6) and/or lack of evaluation of confounding factors (validity question 7). Among the twelve negative quality studies, only three observed statistically significant associations between urinary or serum BPA levels and any measure of body composition( Reference Zhao, Bi and Ma 67 , Reference Ko, Hwang and Park 71 , Reference Takeuchi, Tsutsumi and Ikezuki 73 ), while four( Reference Carwile and Michels 62 – Reference Wang, Li and Chen 64 , Reference Galloway, Cipelli and Guralnik 66 ) of the six neutral quality studies observed statistically significant associations. All six of the serum BPA studies received a negative quality rating( Reference Tarantino, Valentino and Di Somma 65 , Reference Takeuchi and Tsutsumi 68 , Reference Takeuchi, Tsutsumi and Ikezuki 73 , Reference Bloom, Kim and Vom Saal 77 – Reference Olsen, Lind and Lind 79 ), while four of the twelve urinary BPA studies received a negative quality rating( Reference Zhao, Bi and Ma 67 , Reference Mok-Lin, Ehrlich and Williams 69 , Reference Yang, Hong and Oh 75 , Reference Yang, Kim and Chang 76 ). No study, regardless of whether serum BPA or urinary BPA was measured, met the criteria for adequate exposure measurement (question 6).
Discussion
Overall, the literature evaluating the association between BPA levels and obesity is conflicting and inconclusive. Eight out of the eighteen studies observed a positive association between urinary or serum BPA levels and BMI. Among studies that indicated a lack of association, all but one were secondary analyses and all but one were rated negative quality. Significant limitations were present in all eighteen studies included in the present systematic review. No study received a positive quality rating and, thus, all results should be interpreted with caution. Of note, higher-quality studies were more likely to report a positive association between BPA levels and BMI, and all studies that evaluated BMI as a primary outcome observed statistically significant positive associations.
Our findings are consistent with another recently published systematic review by Lakind et al.( Reference Lakind, Goodman and Mattison 82 ). However, the Lakind et al. review included duplicate data, pregnant women, adolescents and children, which further complicated their interpretation of the results. The previous review did not evaluate how the study results differed by quality, methods and whether BMI was the primary outcome. The present review also includes three studies( Reference Ko, Hwang and Park 71 , Reference Lee, Park and Bae 72 , Reference Song, Hauser and Hu 74 ) not included in the Lakind et al. review.
The data presented in all eighteen studies included in the current systematic review were single, cross-sectional measurements of both BPA levels and body composition. The one exception was an analysis of rate of weight change, but that study also had only a single spot urine sample( Reference Song, Hauser and Hu 74 ). Cross-sectional data have an inherent inability to distinguish temporality, so researchers are not able to determine whether differences in observed BPA exposure levels are causally related to current body composition. An additional concern with cross-sectional data is that they only reflect very recent exposures and for many chronic health conditions (including the development of obesity) long-term exposure is most relevant. This is particularly true for BPA, which is generally considered to be absorbed, metabolized and excreted within 24 h of exposure( 48 , Reference Volkel, Bittner and Dekant 83 , Reference Volkel, Colnot and Csanady 84 ), and within-person BPA levels are highly variable over time( Reference Lassen, Frederiksen and Jensen 85 – Reference Braun, Kalkbrenner and Calafat 87 ). Studies have demonstrated high intra-individual variation in urinary BPA levels from spot samples collected at multiple time points on the same day and across multiple days or years( Reference Lassen, Frederiksen and Jensen 85 , Reference Townsend, Franke and Li 86 ). Single-day 24 h urine samples have been shown to also have high intra-individual variability across days. All studies included in the present review used a spot serum, spot urine or a single-day 24 h urine sample to determine BPA levels.
Biomarkers (urine or serum) are currently the only available method for assessing BPA exposure level. Actual results are difficult to compare across studies because of differences in BPA assay methodologies and observed BPA levels. Six studies measured serum BPA level which, regardless of assay method, is currently not considered to be the most appropriate method for measuring BPA exposure due to concerns regarding specimen contamination and the inability of current assay methods and equipment to accurately measure the low levels of BPA that are typically present in serum( Reference Lakind and Naiman 10 , Reference Lakind and Naiman 11 , Reference Geens, Aerts and Berthot 26 , Reference Calafat, Koch and Swan 88 – Reference Mahalingaiah, Meeker and Pearson 90 ). BPA is a non-persistent chemical that is found at nano- to picomolar concentrations in serum, which increases the potential for extraneous sample contamination to influence serum measurements( 48 , Reference Markham, Waechter and Wimber 91 , Reference Volkel, Kiranoglu and Fromme 92 ). Urinary BPA levels are much higher and consist largely of conjugated BPA, which can only be formed in vivo, thus acting as a marker for ruling out contamination by extraneous sources( Reference Calafat, Koch and Swan 88 ). In fourteen of the studies( Reference Wang, Li and Chen 64 , Reference Galloway, Cipelli and Guralnik 66 – Reference Takeuchi, Tsutsumi and Ikezuki 73 , Reference Yang, Hong and Oh 75 – Reference Olsen, Lind and Lind 79 ), including five of six studies that measured serum BPA levels, the manuscripts lacked sufficiently detailed information to determine whether BPA-free materials were used to collect, process and store biospecimens. Failure to use BPA-free laboratory materials could lead to sample contamination and inaccurate BPA measurements, particularly with serum measurements( Reference Wang, Li and Chen 64 , Reference Tarantino, Valentino and Di Somma 65 , Reference Zhao, Bi and Ma 67 , Reference Takeuchi and Tsutsumi 68 , Reference Takeuchi, Tsutsumi and Ikezuki 73 , Reference Calafat, Koch and Swan 88 ). This could result in non-differential misclassification of exposure, which may attenuate observed associations, and should be addressed in future studies. Further complicating interpretations is the lack of reporting of LOD/LOQ and the number of participants who had undetectable levels of BPA in collected samples, which is essential information for evaluating the BPA assessment method and comparing study results.
Given the limitations in measuring low-level BPA metabolites in serum, many researchers consider total urinary BPA to be the preferred approach for measuring BPA exposure( 48 , Reference Calafat, Koch and Swan 88 , Reference Markham, Waechter and Wimber 91 , Reference Volkel, Kiranoglu and Fromme 92 ). However, it is important to note that studies measuring total urinary BPA levels do not directly test the association between internal unconjugated BPA (biologically active) exposure and body composition. Total urinary BPA measures primarily conjugated BPA, which is no longer biologically active and is readily excreted in the urine( Reference Vandenberg, Hauser and Marcus 20 , 48 , Reference Matthews, Twomey and Zacharewski 93 , Reference Snyder, Maness and Gaido 94 ).
It has been suggested that BPA exhibits a non-monotonic dose–response relationship, where very low levels and very high levels are the ranges in which BPA exposure may adversely affect health( Reference Vandenberg, Colborn and Hayes 95 ). However, the broad range of reported urinary and serum BPA levels in currently available studies and the lack of a quality control programme for BPA measurements have been a challenge for testing this hypothesis and defining the cut-off point for low-level BPA exposures. Reliable testing methodology for unconjugated serum BPA is required to fully test this hypothesis. Results were recently published from a round robin including four laboratories with previous experience in environmental chemical analysis( Reference Vandenberg, Gerona and Kannan 96 ). The round robin was established to specifically evaluate and address improvements to serum assay methodologies and standardization of assay protocols. Results indicate that unconjugated serum BPA can be measured using strict protocols for collection, storage and processing materials and appropriate laboratory methodologies.
It is currently unclear whether there is any exposure level at which no adverse health effects occur. Adding to the complexity of evaluating BPA exposures and health outcomes in population-based studies is that nearly all human populations are exposed to low levels of BPA. There is generally no ‘unexposed’ group to compare with the ‘exposed’ population. Prospective population-based studies evaluating different levels of exposure could help elucidate if there are thresholds at which BPA is associated with health outcomes. The lack of an unexposed control group makes it difficult to interpret study findings because a lack of a statistically significant association could mean either: (i) there is no true association; or (ii) any BPA exposure is harmful.
Data analysis approaches varied widely across studies, which likely contributes to the inconclusive findings in the present systematic review. Few of the studies provided sufficient details on their approach to the data analysis. Two major issues were the use only of correlation, especially Pearson’s correlation, and a failure to adjust for relevant covariates. BPA levels generally are not normally distributed in human populations, even after log transformation, which makes Pearson’s correlation an inappropriate analysis approach. Very high outliers have the ability to skew associations, particularly in studies with smaller sample sizes. Most studies showed a range that log transformation would not have sufficiently corrected, thus complicating the interpretation of study results.
Additionally, all of the studies included in the systematic review failed to collect data and/or evaluate important potential covariates, such as dietary factors and correlated chemical exposures. Eating greater quantities of food should theoretically lead to greater potential for BPA exposure, but also higher energy intake, and thus increase the risk of being overweight or obese. Additionally, other chemical exposures found in the human environment are also suspected of being endocrine-disrupting obesogens. As an example, diet is also thought to be the primary route of exposure to phthalates( Reference Clark, Cousins and Mackay 14 , 15 ), which are often added to food packaging materials to increase flexibility and resilience( 15 , Reference Fromme, Bolte and Koch 97 – 100 ). Phthalate exposure has also been associated with increased risk of obesity( Reference Holtcamp 49 , Reference Stahlhut, van Wijngaarden and Dye 101 , Reference Hatch, Nelson and Qureshi 102 ). Data indicate that most people are exposed to both BPA and phthalates, making it difficult to evaluate the individual effects of BPA without considering associations with phthalates( Reference Barr, Silva and Kato 103 ). Future studies should consider overall energy intake and correlated chemical exposures when evaluating the association between BPA and body weight/composition.
While cross-sectional studies have important limitations, there are challenges to evaluating the health effects of BPA exposure using other study designs. If biospecimens are collected as part of a case–control study, the biospecimen collection would occur after the health event of interest has occurred (as the presence or absence of the health effect determines study eligibility) and thus BPA measurements would not reflect long-term exposure or establish the temporality necessary for the determination of causality. In order to optimally address the association between BPA exposure and risk of obesity, new prospective cohort studies are needed in which biospecimens are collected at regular intervals using appropriate procedures and materials to minimize the risk of sample contamination. However, these studies are very expensive, require a large number of study participants for sufficient statistical power and require years of observation time. Many of the existing longitudinal, prospective cohort studies have not collected urine samples, or if they have, the samples are single spot urine samples and/or the samples were not collected using BPA-free materials.
Obesity is a multifactorial health condition and collaboration among obesity researchers from a variety of disciplines (including toxicology, nutrition and epidemiology) is essential. Future research evaluating associations between exposures to obesogenic chemicals, such as BPA, and body composition would benefit from including obesity researchers with expertise in nutrition and physical activity. Studies investigating the association between BPA exposure and changes in body weight or composition must consider the multifactorial nature of obesity and collect and evaluate additional potential confounders or effect modifiers, including dietary intake and concurrent chemical exposures. Reducing the cost of measuring BPA exposure will allow for BPA measurements in large prospective observational studies and for repeated measurements to evaluate longer-term exposure patterns. Research is needed to clarify sources of human BPA exposure and how exposure levels vary over time. This would provide insight for appropriate sample collection and may allow for the development of data collection tools, such as a questionnaire, that could be used to estimate relative BPA exposure in large population-based observational studies. Longitudinal studies that prospectively measure BPA exposures and changes in body weight and composition are needed to establish temporality and causality, and the direction of any observed associations. Finally, improving the accuracy of serum BPA measurements, especially at low levels, will allow researchers to directly test the association between unconjugated BPA levels and body composition and determine if levels of internal exposure are sufficient to adversely affect health.
Conclusion
Currently available evidence is inconclusive with regard to the association between adult BPA exposure and risk of being overweight or obese. Significant methodological issues limit the ability to draw firm conclusions from these studies. However, the lack of high-quality research findings does not mean that there are no health effects. The evidence of widespread human exposure to BPA makes it imperative that the health consequences of BPA exposure be fully evaluated.
Acknowledgements
Financial support: S.J.O. was supported by a National Cancer Institute training grant (T32 CA13267, Principal Investigator: KE Anderson). The National Cancer Institute had no role in the design, analysis or writing of this article. Conflict of interest: None. Authorship: The review question was initiated by S.J.O. The article search and evaluations were performed by both authors (S.J.O., K.R.). The manuscript was written by S.J.O. and edited/reviewed by K.R. Ethics of human subject participation: This systematic review did not require approval from an ethics committee.


