


Nutrition-related conditions such as central obesity have disproportionately affected Mexican Americans( Reference Morales, Flores and Leng 1 , Reference Ford, Maynard and Li 2 ). Central obesity is known as excessive waist size resulting from accumulation of abnormal fat( Reference Ford, Maynard and Li 2 , Reference Tande, Magel and Strand 3 ). Compared with overall obesity, central obesity is associated with higher risks for metabolic diseases; of these diseases, diabetes, hypertension, dyslipidaemia and insulin resistance are most prevalent in Mexican Americans( Reference Barquera, Campos-Nonato and Hernandez-Barrera 4 – Reference Sundquist and Winkleby 7 ).
Diet is an important lifestyle factor that has been related to body weight and composition and is critical in preventing overweight and obesity. Emerging studies are examining weight outcomes in relation to diet quality, in addition to individual food groups, specific nutrient(s) or energy intake( Reference Ayala, Baquero and Klinger 8 , Reference Hu 9 ). Diet quality is used to evaluate the overall dietary pattern and to identify nutrition adequacy and balance( Reference Fransen and Ocke 10 ). One of multiple methods to measure diet quality, the Healthy Eating Index (HEI), was developed by the US Department of Agriculture based on the Dietary Guidelines for Americans( Reference Guenther, Casavale and Reedy 11 ) and has been adopted in many studies( Reference Tande, Magel and Strand 3 , Reference Liu, Chu and Frongillo 12 , Reference Jennings, Welch and van Sluijs 13 ). The total HEI score provides an overall measure of diet quality, while the component scores used to calculate the total HEI score offer opportunities to study important components of dietary intake and their health impact( Reference Tande, Magel and Strand 3 ). Previous studies have suggested inverse relationships between diet quality and risks for overall obesity, CVD and diabetes in general adult populations( Reference Gao, Beresford and Frank 14 – Reference Drenowatz, Shook and Hand 16 ). However, there is a relative shortage of knowledge on whether overall diet quality impacts central obesity among Mexican Americans.
Additionally, little is known about which components of diet quality affect body weight and composition among Mexican-American adults. Using the HEI-2005, Tande and colleagues found that a higher fruit score (all forms of fruit) was associated with 2·6 % lower odds of central obesity in women in the USA( Reference Tande, Magel and Strand 3 ). Among men, a higher score of saturated fat was associated with 3 % lower odds of central obesity( Reference Tande, Magel and Strand 3 ). The HEI-2010 made several changes according to the updated Dietary Guidelines for Americans 2010. These changes included adding a category of seafood and plant proteins to capture specific choices from the protein group, keeping whole grains and refined grains separate to assess the overconsumption of unhealthy grains, and using a ratio of PUFA + MUFA to SFA to replace oils and saturated fat to acknowledge the recommendation to replace saturated fat with mono- and polyunsaturated fat( Reference Guenther, Casavale and Reedy 11 ). Additional research is needed to better understand the new HEI-2010 components and their relationships with central obesity. Using the HEI-2010, Drenowatz and colleagues showed that a higher sodium score, reflecting a lower intake, was associated with lower odds of overweight and obesity( Reference Drenowatz, Shook and Hand 16 ). In contrast, a higher score of total proteins, indicating a higher intake, was associated with significantly higher odds of obesity and this association was significant in men but not in women( Reference Drenowatz, Shook and Hand 16 ). Drenowatz et al.’s research was done utilizing a sample of young, college-educated people of mostly European descent( Reference Drenowatz, Shook and Hand 16 ). There is still a lack of evidence of the effects of HEI-2010 components on central obesity among Mexican Americans, where a great proportion of individuals are of relatively low socio-economic status( Reference Perez-Escamilla 17 ).
Previous studies indicated potential gender differences regarding diet quality and weight( Reference Flegal, Ogden and Carroll 18 – Reference Wang and Beydoun 20 ). Although women are more likely to report eating ‘healthier foods’( Reference Drenowatz, Shook and Hand 16 , Reference Guo, Warden and Paeratakul 21 ), they seem to consume more sugar-laden foods than men, such as cookies, chocolate and ice cream( Reference Wansink, Cheney and Chan 22 , Reference Wardle, Haase and Steptoe 23 ). Men consume a greater percentage of their energy intake from protein( Reference Wansink, Cheney and Chan 22 , Reference Kant, Graubard and Kumanyika 24 , Reference Ribas-Barba, Serra-Majem and Salvador 25 ). In addition, they tend to consume more alcohol than women( Reference Kant, Graubard and Kumanyika 24 , Reference Kant and Graubard 26 ). Furthermore, there may be variations in self-report biases by gender, which could affect the association between diet quality and obesity outcomes( Reference Drenowatz, Shook and Hand 16 , Reference Wardle, Haase and Steptoe 23 ). Women may have a greater reporting bias, possibly due to their greater emphasis on a healthy diet than men( Reference Drenowatz, Shook and Hand 16 , Reference Wardle, Haase and Steptoe 23 ). Among Mexican Americans, while national data showed that the prevalence of obesity outcomes was higher in women than in men( Reference Flegal, Carroll and Kit 27 ), regional data, in California and the Mexico–Texas border region for example, showed that Mexican-American men had the same likelihood to be overweight and obese as their female counterparts( Reference Bowie, Juon and Cho 28 , Reference Wang, Reininger and Cron 29 ). Mixed findings regarding the diet and obesity disparities between Mexican-American men and women indicate a need for further investigation.
Taking advantage of a comprehensive diet quality assessment tool, the HEI-2010, in a national sample of Mexican Americans, the present study aimed to evaluate diet quality and examine the relationship between diet quality and central obesity among Mexican-American men and women.
Methods
Study design and data source
The current study utilized a cross-sectional design based on data from the continuous National Health and Nutrition Examination Survey (NHANES), cycle 1999–2000 to cycle 2010–2012. The continuous NHANES is a complex, multistage probability sample of US non-institutionalized civilians that started in 1999. Each two-year survey cycle examines a nationally representative sample of approximately 10 000 persons and collects information on the health and nutritional status of adults and children. Some subgroups, including Mexican Americans, are oversampled, so that the reliability and precision of the estimated health status indicators for these groups are ensured (detailed information on NHANES is described elsewhere)( 30 ). About 72 000 (n 71 916) individuals completed an in-person home interview in the seven study cycles. Just under 69 000 (n 68 705) completed an interview and an examination in a mobile examination centre, among which 7096 were Mexican-American adults aged 20 years or older. After removing 249 Mexican-American adults with missing dietary data or waist circumference measurement, a total of 6847 individuals with reliable dietary recall status and non-pregnancy status were included in the present study (see online supplementary material, Supplemental Fig. 1). Data from the US Department of Agriculture’s Food Pattern Equivalents Database (FPED) were obtained to translate NHANES dietary data into equivalent servings of the major food groups and subgroups according to the HEI-2010( 31 ). The National Center for Health Statistics’ Research Ethics Review Board approved NHANES and informed consent was obtained from all participants( 30 ).
Measures
The primary study outcome, central obesity, was categorized based on physical exam information from NHANES. Central obesity was defined as a waist circumference of ≥88 cm for women and ≥102 cm for men( Reference Torpy, Lynm and Glass 32 , Reference Heiss, Synder and Teng 33 ). Dietary intake data were obtained from the NHANES in-person 24 h recall interview( 30 ). This information included names of foods, times they were consumed, type of meal or snack, and where the food was consumed. Instructions were provided to the participants orally in English and/or Spanish. Measurement aids and visuals were used to quantify the foods and beverages that were reported. The dietary assessment was carried out by a trained interviewer in a mobile examination centre( 30 ). FPED was used to examine consumption in terms of food group equivalent servings. FPED translated dietary recall data into equivalent servings of the major food groups and subgroups. Mixed foods were disaggregated (i.e. broken down into their ingredients), with solid fats and added sugars counted separately( Reference Guenther, Casavale and Reedy 11 ). Diet quality was calculated by using the HEI-2010. Briefly, the HEI-2010 was designed to evaluate compliance with the key diet-related recommendations of the 2010 Dietary Guidelines for Americans. The HEI-2010 was summed to a maximum total score of 100. HEI-2010 scores were density-based; that is, the amount of a dietary component of interest consumed (i.e. a food group or nutrient) was divided by total energy and multiplied by 1000 or expressed as a percentage of energy( Reference Guenther, Casavale and Reedy 11 ). The density approach measures diet quality, which is a mix of food, rather than diet quantity( Reference Guenther, Casavale and Reedy 11 ).
Sociodemographic covariates included gender, age (20–40, 41–60 or >60 years), education (less than high school, high school or equivalent, or more than high school), marital status (yes or no) and poverty-to-income ratio (PIR<1, 1≤PIR<3 or PIR≥3), smoking status (never, former or current) and alcohol drinking status (never, former or current). Insurance coverage was categorized into: (i) public insurance including Medicare, Medicaid and other forms of government insurance; (ii) private insurance; and (iii) no health insurance. Acculturation was constructed as an acculturation score, which was based on three proxy measures: (i) country of birth; (ii) language spoken at home; and (iii) length of time in the USA. Combining country of birth and length of time in the USA, a score of 0–3 was assigned based on four categories (3=US-born; 2=foreign-born and lived in the USA for ≥20 years; 1=foreign-born and lived in the USA for 10–19 years; 0=foreign-born and lived in the USA for <10 years). A score of 0–2 was assigned to the language spoken at home (2=English only or pro-English; 1=both English and Spanish equally; 0=Spanish or pro-Spanish). These scores were summed to yield a total acculturation score, ranging from 0 (least acculturated) to 5 (most acculturated). This scale was based on one used in a previous study of Hispanic and Chinese populations( Reference Kandula, Diez-Roux and Chan 34 ). The variable of physical activity was examined by using the physical activity questionnaire items employed in NHANES. Participants were asked their engagement in moderate-to-vigorous physical activity during the past 30 d related to transportation, household/domestic tasks and leisure-time activities. Their responses were translated into minutes of moderate-to-vigorous physical activity per week. Each participant’s combined weekly duration of moderate-to-vigorous physical activity was grouped into one of two categories (<150 or ≥150 min/week) based upon their achievement of current activity guidelines( 35 ). Lastly, data release number (SDDSRVRY) was taken into account in the analysis to adjust for potential different distributions of sampled populations in different survey cycles.
Analyses
All statistical analyses for the study were conducted using the statistical software package SAS version 9.4. Multivariable logistic regressions were conducted to investigate the association between HEI-2010 total score and central obesity, as well as the associations between HEI-2010 component scores and central obesity. Considering the complexity of the sampling design, survey-related commands (e.g. PROC SURVEYMEANS) were employed to adjust for the complex survey design effect. In particular, the primary sampling unit and stratum for each observation were taken into account in the analysis( 30 ).
Results
Table 1 presents sociodemographic and behavioural characteristics, as well as central obesity status of Mexican Americans. The mean acculturation score was 2·4 for Mexican Americans in NHANES cycles 1999–2000 to 2010–2012. Almost 51 % of participants were centrally obese. In gender-specific analyses, women appeared less likely to be current smokers (12 v. 27 %) and current drinkers (53 v. 79 %), but more likely to achieve the Physical Activity Guidelines for Americans (63 v. 52 %). However, in comparison to men, women were more likely to be centrally obese (68 v. 36 %).
Table 1 Characteristics of Mexican-American men and women aged ≥20 years (n 6847), National Health and Nutrition Examination Survey (NHANES) 1999–2012

Missing data: age, n 307; education, n 319; PIR, n 1005; married, n 430; insurance status, n 390; physical activity, n 1249; smoking, n 315.
† Poverty-to-income ratio.
‡ 2008 Physical Activity Guidelines for Americans; moderate-intensity physical activity of ≥150 min/week is needed.
§ Central obesity: waist circumference ≥102 cm in men; ≥88 cm in women.
║ Acculturation index is a score ranging from 0 to 5 (0 is the lowest acculturation and 5 is the highest acculturation). The index is derived from information of length of stay, nativity and language spoken at home.
HEI-2010 scores by gender are presented in Table 2. The mean HEI-2010 total score for all Mexican Americans in NHANES cycles 1999–2000 to 2010–2012 was 50. Mexican-American women appeared have better overall diet quality (HEI-2010 total score: 51·1 v. 48·4, P<0·001) than their male counterparts. Compared with men, women also had higher scores across most HEI-2010 component categories, except in the categories of greens and beans (2·0 v. 2·1, P<0·001), total proteins (4·3 v. 4·5, P<0·001) and fatty acids (5·1 v. 5·2, P<0·001), where women scored lower than their male counterparts. Mexican-American women had higher mean HEI-2010 total scores than Mexican-American men (Fig. 1).
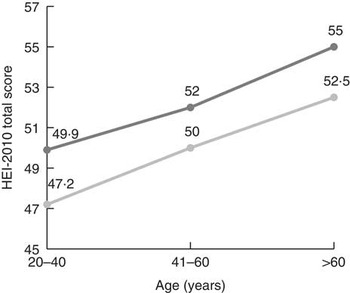
Fig. 1 Mean Healthy Eating Index-2010 (HEI-2010) total score, by gender (![]() , men;
, men; ![]() , women) and age, among Mexican-American men and women aged ≥20 years (n 6847), National Health and Nutrition Examination Survey (NHANES) 1999–2012
, women) and age, among Mexican-American men and women aged ≥20 years (n 6847), National Health and Nutrition Examination Survey (NHANES) 1999–2012
Table 2 Healthy Eating Index-2010 (HEI-2010) total scores and component scores in Mexican-American men and women aged ≥20 years (n 6847), National Health and Nutrition Examination Survey (NHANES) 1999–2012

*P<0·05, **P<0·001.
† P values are based on t tests for differences in scores between men and women.
‡ Score range for each HEI-2010 category is given in parentheses; higher score means better quality.
§ Empty calories are from solid fats, alcohol and added sugars.
Table 3 presents findings from multivariable logistic regression models assessing the relationship between HEI-2010 scores and central obesity. A higher HEI-2010 total score was significantly associated with lower odds of central obesity (OR=0·98; 95 % CI 0·98, 1·00) in Mexican-American men, but not in women (OR=1·00; 95 % CI 0·99, 1·01). Among all Mexican Americans, a one-unit higher score of total fruit and sodium was associated with 4 % (OR=0·96; 95 % CI 0·93, 0·99) and 2 % (OR=0·98; 95 % CI 0·96, 0·99) lower odds of central obesity, respectively (note that a higher sodium score indicates a lower level of intake). However, a higher score of total proteins was associated with higher odds of central obesity (OR=1·08; 95 % CI 1·00, 1·16). When stratifying by gender, a higher whole fruit score was significantly associated with lower odds of central obesity in men (OR=0·95; 95 % CI 0·90, 0·99) but not in women. A higher sodium score was associated with lower odds of central obesity (OR=0·97; 95 % CI 0·94, 0·99) only in men.
Table 3 Logistic regression results of the associations between Healthy Eating Index-2010 (HEI-2010) total scores and component scores and central obesity in Mexican-American men and women aged ≥20 years (n 6847), National Health and Nutrition Examination Survey (NHANES) 1999–2012

*P<0·05.
† Odds of central obesity in Mexican Americans with a lower HEI-2010 score relative to odds of central obesity among individuals with higher HEI-2010 score.
‡ Adjusted for age, education, income, marriage status, insurance status, acculturation, smoking status and alcohol drinking status.
§ Sodium, refined grains and empty calories are ‘moderation’ components, where a higher score indicates a lower level of intake.
Discussion
The present study found that Mexican-American women in general had better diet quality than Mexican-American men. This result is consistent with the finding in the general US adult population( 36 ). The current study also suggested that a better HEI-2010 total score, indicating a better overall diet quality, was associated with a lower chance of central obesity among Mexican-American men. However, in women, the association was not significant. Some obesity studies have used gender-mixed samples or women-only samples( Reference Ayala, Baquero and Klinger 8 , Reference Perez-Escamilla and Putnik 37 ), and few studies have explored in detail the gender difference in diet quality and its association with central obesity among Mexican Americans. The lack of significance for HEI-2010 total score in Mexican-American women may be due to their higher HEI-2010 total scores than men. A higher HEI-2010 score may reflect women’s greater emphasis on a healthy diet( Reference Wardle, Haase and Steptoe 23 ), which may have resulted in a greater reporting bias in women than in men( Reference Drenowatz, Shook and Hand 16 ). Another reason for this gender difference regarding diet quality and its effects on central obesity may be that immigrant men consume fast food more frequently than their female counterparts, possibly due to their preference of its ease and convenience, and their cooking and time limitations( Reference Jasti, Lee and Doak 38 ). Beyond behaviour, basic biology may play a role. Biologically, men tend to store body fat in the abdominal region, whereas women tend to store fat in the lower extremities( Reference Blaak 39 ). This biological difference in fat distribution between genders may also potentially explain the significant association between overall diet quality and central obesity among Mexican-American men.
In addition to overall diet quality, the present study also explored independent effects of fruits, proteins and sodium on central obesity. Even though few studies have examined the relationship between these dietary components and central obesity using the HEI measurement, some reported that increased intake of fruits has inverse relationships to anthropometric measures( Reference Tande, Magel and Strand 3 , Reference Nicklas, O’Neil and Fulgoni 15 , Reference Esposito and Giugliano 40 ). Fruits, which contain little cholesterol but are rich in vitamins, minerals and fibres, are essential for a healthy weight. Fruits also provide the body with phytochemicals including β-carotene, lutein and lycopene, which promote good health and reduce the risk for central obesity( 41 ). The beneficial effects of fruit intake may support the association between fruit score and central obesity found in the current study.
With respect to the finding concerning the relationship between sodium intake and the outcome, the current study showed that a higher sodium score, which reflects a lower level of intake, was associated with lower odds of central obesity in Mexican Americans. Moderate sodium intake is known to be effective in protecting cardiovascular health( Reference Whelton, He and Appel 42 – Reference Karppanen and Mervaala 45 ) and preventing and managing diabetes( Reference Leontos 46 , Reference Barclay, Gilbertson and Marsh 47 ). Researchers have studied a close link between sodium intake and weight gain. According to Karppanen and Mervaala( Reference Karppanen and Mervaala 45 ), a high sodium intake obligatorily produces a progressive increase in thirst. The progressive increase in average intake of salt explains the observed concomitant increase in intake of sugar-sweetened or alcoholic beverages, which are sources of excessive energy intake( Reference Grimes, Wright and Liu 48 – Reference Choi, Park and Kim 50 ). Perhaps the high sodium intake together with intake of unhealthy beverages may help to explain the inverse relationship between sodium score (i.e. a higher score indicates a lower level of intake) and central obesity observed in Mexican Americans. Additionally, previous work has suggested that excessive sodium intake is often correlated with frequency of eating out and consumption of processed packaged foods and salty snacks( Reference Ayala, Baquero and Klinger 8 , Reference Mendoza, Schram and Arcand 51 ). Many Mexican Americans rely on ready-made processed foods and eating out because of the fast-paced life in the USA and the pressure to integrate into American society by eating American-style fast food( Reference Liu, Chu and Frongillo 12 , Reference Lindberg and Stevens 52 , Reference Neuhouser, Thompson and Coronado 53 ). According to the US Centers for Disease Control and Prevention, more than 75 % of the sodium in the average American diet comes from salt added to processed foods( 54 ), which usually are energy-dense and a possible cause of obesity( Reference Ahuja, Pehrsson and Haytowitz 55 , Reference Monteiro, Moubarac and Cannon 56 ). Salt is often used to preserve foods and modify flavour, and is included in additives that affect the texture or colour of foods(55). When the consumption of processed foods and occasions of eating out increase, sodium intake is likely to increase and so too is the chance of gaining weight( 54 , Reference Ahuja, Pehrsson and Haytowitz 55 ). Perhaps the correlation between sodium intake and consumption of processed or restaurant foods can serve as another explanation for the relationship between sodium score and central obesity in Mexican Americans( Reference Mendoza, Schram and Arcand 51 – Reference Monteiro, Moubarac and Cannon 56 ).
The present study results also indicated that a higher score of total proteins, indicating a higher level of intake, was associated with increased odds of central obesity. Similar results regarding the association between protein intake and weight gain have been shown before( Reference Drenowatz, Shook and Hand 16 , Reference Shay, Van Horn and Stamler 57 , Reference Wolongevicz, Zhu and Pencina 58 ). One study assessed the association between diet quality measured by the HEI-2010 and body weight; it found that a high score of total proteins is associated with an increased risk for obesity( Reference Drenowatz, Shook and Hand 16 ). The association was determined in a large US sample( Reference Shay, Van Horn and Stamler 57 ), as well as in an all-women sample from the Framingham nutrition studies( Reference Wolongevicz, Zhu and Pencina 58 ). A potential explanation for the positive association between a higher level of protein intake and obesity outcomes is that there is a positive correlation between fat and total protein intake( Reference Drenowatz, Shook and Hand 16 ). Meat or poultry may contribute a significant share of dietary protein for Mexican Americans( Reference Carrera, Gao and Tucker 59 ). The association between protein and central obesity is probably attributable to increased consumption of processed foods or red meat( Reference Cristofoletti, Gimeno and Ferreira 60 – Reference Wang, Beydoun and Caballero 62 ); and it may be that these products are becoming a major source of proteins for Mexican Americans( Reference Carrera, Gao and Tucker 59 , Reference Wang, Beydoun and Caballero 62 ). This places them at a higher risk for central obesity. Commercially prepared meats such as sandwich meats, bacon, salami or sausage are not only notoriously high in sodium but also high in fat( Reference Bovalino, Charleson and Szoeke 63 ). Processed meats are made by grinding and combining fatty cuts of meat and they can be a potent but overlooked source of saturated fat and energy( Reference Kaluza, Akesson and Wolk 64 ). A recent study showed that Mexican Americans follow a meat-oriented dietary pattern, which includes primarily processed meats, rather than the traditional plant-based Mexican diet that relies on legumes as a major source of protein( Reference Carrera, Gao and Tucker 59 ). These dietary habits, along with the epidemiological evidence that increased processed meat intake increases the risk of chronic disease( Reference Wu, Spiegelman and Hou 65 , Reference Boada, Henríquez-Hernández and Luzardo 66 ), aid in understanding the association between the score of proteins and central obesity, and highlight the importance of promoting healthier protein alternatives such as plant-based protein foods.
Study limitations
The current study has several limitations. First of all, NHANES data are cross-sectional, which precluded examination of changes in diet quality and weight status in the cohort over time. Without a longitudinal design, associations can be assessed but evidence of a causal relationship between diet quality and central obesity cannot be established. Furthermore, the study was exclusively focused on Mexican Americans, so results may not be generalizable to other populations because of the variations within cultural practices and obesity risks across races/ethnicities. Additionally, it is possible that the study excluded some undocumented immigrants. This group of people may be less likely to participate in NHANES questionnaires or physical examinations due to fear of exposing their illegal status.
Measurements for some study variables may have incorporated errors. Although more exact methods exist for measuring visceral adipose tissue accumulation (e.g. MRI and computerized tomography), NHANES did not employ these exact methods. Previous studies have shown that waist circumference has a strong association with visceral adiposity( Reference Sundquist and Winkleby 67 ) and it is therefore the recommended measure to estimate the risk of CVD and type 2 diabetes for many populations( Reference Knowles, Paiva and Sanchez 68 – Reference Wei, Gaskill and Haffner 72 ), including Mexican Americans.
Additionally, potential biases may exist in measuring diet. Under-reporting by participants is common in nutritional studies, especially among those who are overweight or obese( Reference Fisher, Johnson and Lindquist 73 ). Thus, the potential bias towards the null resulting from under-reporting is acknowledged. Extreme dietary intake values were excluded from the current study. Additionally, some scholars argue that the discrete distributions within HEI scoring patterns may reduce its power as a predictor( Reference Wirt and Collins 74 ). Some are also concerned that arbitrary choices made in scoring HEI components may hamper its ability to predict risks for chronic diseases( Reference Wolongevicz, Zhu and Pencina 58 , Reference Waijers, Feskens and Ocke 75 ). In fact, the insignificant finding on the relationship between empty calories and central obesity may demonstrate this limitation. The HEI-2010 considers alcohol above a threshold level indicative of moderate drinking as empty calories. This approach does not directly address other potential positive and negative biological effects of alcohol, nor does it account for specific questions related to frequency of consumption and amounts consumed on drinking occasions( Reference Guenther, Casavale and Reedy 11 ). Perhaps the poor sensitivity of the HEI-2010 empty calories score in predicting central obesity can be partially explained by the limited information on alcohol measurement. Therefore, when using the HEI-2010 to examine relationships between diet quality and health outcomes, additional considerations regarding alcohol may be warranted( Reference Guenther, Casavale and Reedy 11 ).
Study strengths
Despite the limitations, the study contributes to the literature by presenting national-scale evidence regarding the effect of diet quality on clinically validated central obesity among Mexican Americans. The current investigation utilizes a comprehensive measure of diet quality, which allows for an assessment of overall diet quality and major food group balances of Mexican Americans( Reference Barclay, Gilbertson and Marsh 47 ). Most of the existing studies on diet have focused on specific nutrient components, such as fats and sugars, or on the consumption of individual food groups( Reference Ayala, Baquero and Klinger 8 , Reference Hu 9 ). These nutritional outcomes have been critiqued as ‘being overly reductionist, failing to account for how foods are eaten in combination as part of meals or cuisines’, according to Park et al.( Reference Park, Neckerman and Quinn 76 ). Total food intake is a complex construct, which cannot be described or evaluated based on nutrients measured in isolation from one another. The HEI-2010 is able to measure consumption levels of food groups and nutrients concurrently, which is a superior approach in estimating dietary intake(77). It is also worthy to note that the HEI-2010’s utilization of the density approach (i.e. as a percentage of energy consumed) allows for characterization of intake levels while controlling for total energy intake( Reference Guenther, Reedy and Krebs-Smith 78 ), which is highly correlated with the quantity of foods consumed. This may further suggest the HEI-2010 is a better way to measure diet and to inform dietary modifications. Moreover, the study identified that specific aspects of diet, as indicated by HEI-2010 component scores, were related to central obesity. This may suggest particular areas for dietary interventions that are more targeted to the Mexican-American population. Additionally, a Mexican-American sample derived from a national survey data (i.e. NHANES) was used and gender-stratified analyses were conducted. The analyses accounted for survey design complexity and yielded estimates for the nation as a whole. Findings may assist with designing gender-specific and culturally relevant solutions to tackle obesity-related disparities among Mexican Americans.
Implications
The current study findings assist in the understanding of diet quality and central obesity in Mexican Americans by demonstrating their diet quality and how it contributes to the central obesity among them. These findings may lend insights for community-level dietary interventions and national-level policies aimed at reducing the high rates of central obesity and related health problems among Mexican Americans. Nutrition professionals should consider promoting whole fruits that are culturally appropriate, as well as introducing Western produce to the community. Additionally, promoting home cooking as a strategy for reducing sodium intake may be beneficial for Mexican Americans, especially for Mexican-American men who may consume more fast food and have poorer cooking skills than their female counterparts( Reference Larson, Perry and Story 79 ). It is essential that enhancing the understanding of food labels, of nutritional merits of different foods and of food preparation methods be incorporated into the dietary interventions. A regulatory approach that supports the food industry in the reformulation of foods is recommended( 80 ). If these efforts were implemented, they would provide greater flexibility for meeting the sodium intake guideline when individuals consume commercially prepared foods. It is also suggested that other protein-containing foods may better replace meat and poultry, especially processed meat products. The HEI-2010 includes a separate category for seafood and plant-based proteins, which indicates the awareness of the potential detrimental effects of animal-based protein. Scholars have suggested that rather than relying on absolute protein intake, a ratio of total protein to seafood and plant proteins may be a better indicator for a healthy diet( Reference Drenowatz, Shook and Hand 16 ). As for practice, nutrition professionals should encourage the intake of healthier protein alternatives, such as legumes and seafood. Also, cheese made with lower-fat milk, including Hispanic-style cheeses available in lower-fat varieties such as Queso Oaxaca and Queso Fresco, can also be a healthy protein source to be promoted in the community.
Conclusion
The present study showed that, in general, Mexican-American women appeared to have better diet quality than their male counterparts. The study also revealed that a better diet quality was associated with a lower chance of central obesity among Mexican Americans, especially in Mexican-American men. In particular, component scores of fruits and sodium were inversely related to central obesity, but the score of total proteins was associated with higher odds of central obesity. To reduce the risks for central obesity in Mexican Americans, dietary interventions should focus on enhancing the diet quality, especially in the areas of fruit and healthy protein promotion as well as sodium reduction.
Acknowledgements
Financial support: This research received no specific grant from any funding agency in the public, commercial or not-for-profit sectors. Conflict of interest: None to disclose. Authorship: Y.Y. and T.-S.T. designed the research; Y.Y. analysed the data; Y.Y., R.S., L.C., S.B., S.P. and T.-S.T. wrote the manuscript and had responsibility for final content. All authors read and approved the final manuscript. Ethics of human subject participation: The Research Ethics Review Board of the National Center for Health Statistics approved NHANES and informed consent was obtained from all participants.
Supplementary material
To view supplementary material for this article, please visit https://doi.org/10.1017/S1368980016003190


