As college professors, we seek not only to impart knowledge about issues and concepts in American politics but also to engage and inspire students to become more knowledgeable and more active in politics.
This article explains how a student-run exit poll conducted on Election Day 2016 accomplished both goals. Seven faculty members from four universities pooled our students and carried out an exit poll in the District of Columbia, Maryland, Virginia, and Ohio. By the time the polls closed, our students had spoken to more than 2,300 respondents, providing a memorable experience and creating a shared dataset that served as the centerpiece for many final class projects. Through this project, students gained hands-on experience in survey design, sampling, research ethics, polling, and data analysis. Student-run exit polling also provided valuable resources for students and faculty long after the semester was over, forming the basis of hands-on data assignments in other classes and faculty research.Footnote 1
Of course, these experiential learning benefits are not lost on other researchers, who have written useful primers on student exit polls.Footnote 2 We hope to add insight about involving students from multiple universities, using the activity for various teaching goals in different types of classes, and taking advantage of new technologies to facilitate conducting a pilot poll and to speed data entry on Election Day.
Student-run exit polls can be used in a variety of classes. Whereas their applicability to an American politics class on elections is obvious, they also can work in more general courses on public opinion, political parties, and voter behavior. They also pair well with methods courses, regardless of subfield. One of our research-design classes, for instance, had a substantive focus on international security. Faculty members teaching introductory methods courses can use the poll to illustrate basic concepts such as sampling and descriptive statistics. More advanced courses can add complexity by incorporating survey experiments and having students conduct their own analyses. Exit polls also can provide benefits outside of the classroom. For junior faculty in particular, student-run exit polling is the type of activity that generates interest in their research from other areas in the university. It also provides a source of data that faculty might not have the budget to gather in a different way.
First, we discuss the benefits of using an exit poll, for both faculty members and students. Second, we center on the pre-election phase, including initial planning, obtaining approval from the institution’s research-ethics review board, and designing the instrument. Third, we focus on tasks that fall on the days immediately preceding the election and on Election Day. Fourth, we suggest several possible assignments for a range of different types of classes. Fifth is the article’s conclusion.
The primary benefit of a student-run exit poll is that it provides a hands-on learning experience that is both fun and directly relevant to a major current political event.
THE BENEFITS OF A STUDENT-RUN EXIT POLL
The primary benefit of a student-run exit poll is that it provides a hands-on learning experience that is both fun and directly relevant to a major current political event. Many students stated that the poll increased their engagement with election news, particularly reporting on public opinion. They closely followed the polls leading up to November 3 and read survey results reported in the media with greater scrutiny (see appendix C for student feedback on the experience).
The exit poll also gave students direct experience with the empirical-research process. Early in the term, students had to grapple with questions about survey design as they created, fielded, and analyzed an online pilot survey. This included thinking through appropriate topics to cover, parsing the wording of questions, and brainstorming research questions that could be explored with survey experiments. Following the pilot, students made difficult decisions about how to shorten the long list of questions (and experiments) and discussed various potential sampling strategies. This gave students a better appreciation for the complexities of survey design as well as how much potentially can be learned from a voter survey. Many students also were required to complete the IRB online training and certification process. We saw this as a great learning opportunity, particularly with respect to the topic of research ethics, which otherwise is rarely covered in undergraduate courses.
Students also gained an appreciation of the practical challenges of research. First, they had to recruit participants. For some students, approaching strangers came easy; for many, it did not. Most students found interacting with voters rewarding but they also dealt with inevitable rejections from busy voters. Students observed for themselves the reactions of voters to pollsters. In some cases, those experiences were disappointing or uncomfortable. One group, for instance, witnessed multiple cases in which they approached (randomly selected) women, only to have the man with the woman decline on her behalf. These and other experiences led them to think seriously about selection bias in exit polls as well as other surveys.
The students then had to enter the data. Nearly all of the data was manually entered by students, either after they came back from the polling stations or between classes on Election Day and the day after. Having students enter the data was largely a matter of necessity (i.e., using tablets at the polls would have been cost-prohibitive), but doing so resulted in an unexpected benefit. As students read through survey after survey, they noticed patterns as well as interesting anomalies. Students often paused when they came to a response that was unexpected (given the previous answers) and expressed their puzzlement. This frequently led to discussions among students. Many stated that this initial “exploration” of the data was a favorite part of the process, often sparking ideas that served as the basis for term papers.
Finally, the activity gave students experience and skills that would be of value in the job market: actual election polling and data analysis. Many of our students are interested in landing coveted political internships or working on campaigns. Having participated in an exit poll provides a way to distinguish their application from the rest of the pack. The process of designing a survey, interacting with voters, and analyzing data all contribute to making them more attractive candidates, not only to politically oriented employers but also to various nonprofits and private-sector organizations. Interacting with strangers in a political setting also boosted their self-confidence and overall professionalism—something few traditional class activities offer.
The data from student-run exit polls can provide benefits in future classes as well. Some of the faculty later used these data in other courses on survey research and data analysis. Not only did these data provide students an opportunity to apply their newfound knowledge to a real-world dataset, but analyzing a dataset collected by fellow students at their own institution also made data collection seem less daunting. This was not simply another dataset provided by their professor but rather one to which they had a personal connection.
The exit poll also provided several benefits directly to faculty. In allowing a faculty member to tie a course directly to current events, the exit poll not only deeply engages students in real-world politics; it also responds to increasing institutional interest in innovative teaching methods and active-learning exercises. Faculty even may find that their institution’s communications office is interested in writing a story on the poll for a promotional magazine or website, or that their dean’s office wants to highlight the poll as an example of faculty engagement. Generating positive institutional interest in these ways can have special importance for junior faculty.
Conducting an exit poll also creates several opportunities for faculty members to explore their own research interests and even collaborate with students on research (see appendix D). Although the sampled geographic area may be small, incorporating meaningful experiments into the survey is relatively straightforward. Faculty also may choose to use the poll to test the wording of questions or as a pilot for a future, larger study. Because the poll provides faculty the opportunity to ask different types of questions than those on standard election surveys, it also provides data on otherwise difficult-to-obtain topics for research.
Finally, on a more sentimental note, we simply enjoyed sharing in the election experiences of our students, nearly all of whom were voting for the first time. Some faculty members spent all day with the students, from entering data to watching the returns come in. Interacting with other voters for several hours produced many thought-provoking class discussions (for both professors and students) on Election Day and in the following days and weeks. Particularly in the context of a surprising election outcome, this experience helped students better understand the results and the many postmortems from academics and journalists that followed.
PREELECTION PHASE: PLANNING, LEGAL ISSUES, AND INSTRUMENT DESIGN
If the preceding section piqued interest in incorporating an exit poll into one of your courses, the remaining sections will provide a sense of how to do so successfully.Footnote 3
When it comes to planning, the earlier you start, the better (see table 1).
Table 1 Checklist for a Student Exit Poll
Assuming the election is in November, initial planning should start no later than the preceding summer. This gives faculty ample time to decide on the scope of the project and, critically, figure out how to incorporate it into their classes. An exit poll can work in several types of courses, but trying to fit it into a class that is already fully planned with little room to spare can be problematic.Footnote 4 Consider the following: how many students are available; which exercises and assignments will accompany the poll; which portion, if any, of the grade will be determined by the exit poll (and related work); and whether you want to field an online pilot. For those who want to make the poll a central part of the course, see appendix B for suggestions about graded assignments.
In terms of planning the poll, faculty should determine the geographic area to be covered and then create a sampling plan that yields as close to a representative sample of voters in that area as resources allow.
In terms of planning the poll, faculty should determine the geographic area to be covered and then create a sampling plan that yields as close to a representative sample of voters in that area as resources allow. In the case of our poll, we wanted to “represent” a meaningful and easily recognizable area: Washington, DC. To improve the efficiency of our sampling, we drew a stratified random sample using established political strata—that is, DC’s eight voting wards. As is typical of exit polls, the sampling units were polling stations.Footnote 5 To increase the political diversity of the sample, we decided to sample polling stations from neighboring counties in Maryland and Virginia as well.Footnote 6 Students went to the polls in teams of two or three. Once there, they quasi-randomized voter selection by recruiting every third voter leaving the polling station. Students were strictly instructed to interview no volunteer survey respondents.
Early in the planning process, we identified where we could obtain necessary supplies (e.g., clipboards and pens). In some cases, our departments had supplies for us to use. Alternatively, several online office-supply stores were inexpensive when we ordered in bulk. We gave three clipboards to each student, recognizing that they would be recruiting new participants as others were filling out the survey. We also purchased matching long-sleeved t-shirts for all DC-area students that carried the name of the poll as well as school names and logos. This increased their visibility at the polling stations and added professionalism and legitimacy to the operation—which we suspect increased the response rate. An alternative (and less expensive) strategy, which we used in Ohio, was having students wear their own clothing with the school’s name and logo.
The various institutional requirements presented an unexpected hurdle and reinforced the importance of planning far in advance of the semester. One institution, for instance, required that students be informed of the exit poll on the first day of class, in writing, because it would be a required part of the course. This gave them time to drop the class if they did not want to participate; staying implied their consent. Another institution was opposed to requiring participation in the exit poll and informed the faculty member that she must create a way for students to stay in the class even if they did not want to participate.Footnote 7 Faculty also should speak to their institution’s insurance office to determine whether any coverage is needed. An institution’s IRB office also should be informed as soon as possible. For those faculty who wanted to be able to publish findings from the data, the exit poll qualified as “human-subjects research.” They needed IRB approval from their home institution, and everyone involved—including students—needed IRB certification. Finally, we familiarized ourselves and students with state and local laws pertaining to exit polling (e.g., how far from the polling station students must stand).
One aspect of the exit-poll planning that students were heavily involved in was the design of the instrument. To provide more experience with the research-design process and to ensure a higher-quality exit poll, we opted to conduct an online pilot about a month before the actual election using a convenience sample recruited informally by students. The online format allowed us to test more questions and try several potential survey experiments.Footnote 8 It also created a dataset for students to use in a trial run of the final analysis. When deciding to run an online pilot, keep in mind key differences between an online study and an exit poll. Most important: the exit poll will use paper and pencil, which in some cases affects question type and formatting, and it should be no longer than two pages (ours was printed on the front and back of legal-sized paper).Footnote 9 We recommend using multiple-choice questions for ease of survey-taking, data entry, and data analysis. We also learned the hard way that it is critical to make sure the instructions are clear, particularly when only one response is acceptable (e.g., “select one answer only” or “choose the one answer that best describes your opinion”).
To randomize the experimental conditions on a paper survey, multiple versions were printed, collated, and presented to each voter from the top of the pile in order.Footnote 10 Each version (including a unique set of experimental conditions) was given a code number that was included in the data entry.
The appendix includes an example of one of the surveys. We had to work hard to fit many questions on two sides of the paper, while also making sure they were easily readable for all types of voters. The experimental code is in the lower right-hand corner of the figure.
Some faculty also had students practice polling on campus during class with a short (i.e., five-question) survey. This gave students valuable experience approaching strangers and asking their opinion. Student had several reactions to this process. First, they were surprised by how much fun it could be, once they got past their nerves when approaching the first person. Second, they were surprised by the refusal rate. This was a valuable lesson for Election Day, when busy voters often brushed past students.Footnote 11 The practice session also gave students a chance to think about how to randomly select respondents and how to deal with groups who all wanted to take the survey (a situation we instructed them to avoid).
ELECTION DAY
Last-minute preparations included determining how many surveys to send out with each student (we settled on 30 to 50, depending on the team member), assembling packets of surveys and other supplies, and distributing t-shirts. Some faculty also asked students to check in at their location by sending “selfies” (see figures 1 and 2). We set up an online survey that mirrored the instrument so that students could enter the data from multiple locations.Footnote 12 This allowed faculty to track how many surveys were entered in real time and to get a sense of the distribution of responses. Students entered each survey’s unique code number along with their group and precinct number and time of day. They were encouraged to write down any notable incidents, including weather, contact with election officials, and interpersonal conflict with any voter. Students were instructed to refer all complaints directly to a faculty member. If they encountered intimidation or conflict, they were to enter the polling station and contact a faculty member. No serious complaints or conflicts were reported. Most students experienced positive feedback from voters, and some were even the subject of local media attention.
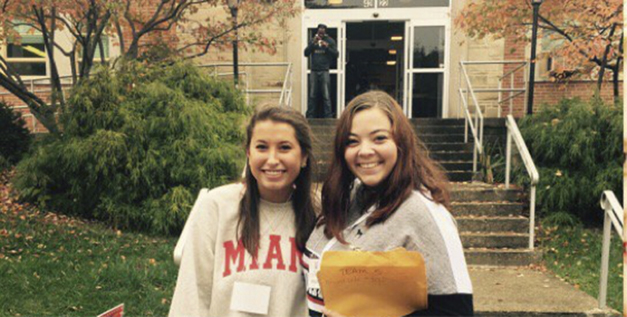
Figure 1 Students Polling in Ohio
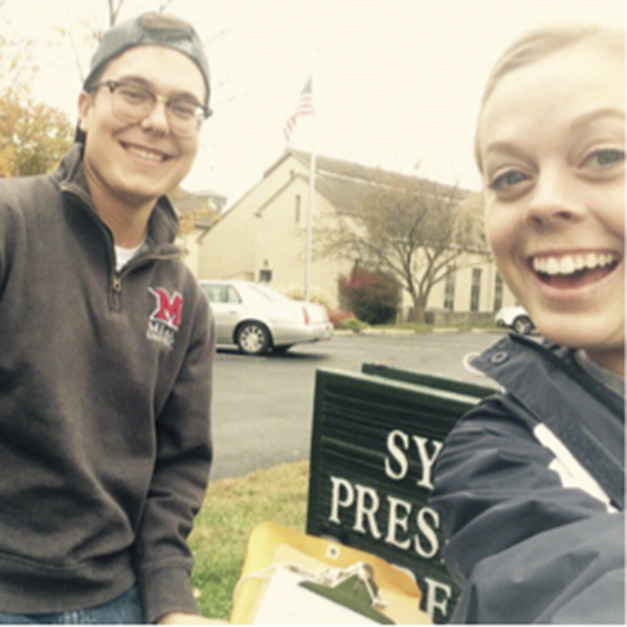
Figure 2 Students Polling in Ohio
Some faculty reserved a room where students could go after polling to enter data as a group. At one school, the faculty member secured a large conference room with televisions so students could watch election coverage as they entered data using their personal laptop computers (see figures 3 and 4). A festive atmosphere was established by providing food and drinks, which attracted more students. In class discussions after the election, many students said this was a favorite aspect of the day. It gave them a chance to share stories about their polling experiences and made the task of data entry more interesting. This setup also worked well for students who were unable to participate in the actual polling. They could drop in when their class schedule allowed, hear the poll workers’ stories, and help enter data.

Figure 3 Students Entering Data in Maryland
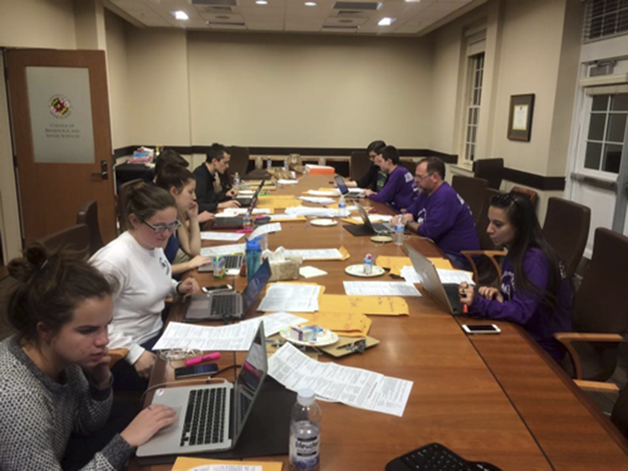
Figure 4 Students Entering Data in Maryland
One thing we learned on Election Day was the need to be flexible. Some problematic questions led to unsystematic answer patterns, making it unclear how to enter the data. For example, what if a respondent chose two answers when only one was allowed? What if a respondent wrote a “clarifying” margin note? We had to quickly devise solutions and communicate them to all participating students, many of whom were already entering data. We also did not anticipate how much inclement weather would impede data collection in some areas or how low the turnout would be at particular locations. Although we allowed students to tweak the “every-third-voter” rule depending on foot traffic, when turnout is very low or refusals are very high, students may simply approach every voter leaving the polling station.
POSSIBLE ASSIGNMENTS
A primary benefit of the exit poll is the number of related assignments that faculty can create. This section briefly describes different projects we required our students to complete. A more detailed list of these assignments is in appendix B.
We used these data to generate assignments for two main types of courses: substantive courses in political science and courses with a data-analytic component. The data were used primarily in undergraduate classes but also could be used in MA-level or cross-listed courses.
For more qualitative classes, faculty gave students the option to write about an aspect of the exit-polling experience. In an upper-division class on an applied topic in American politics, a faculty member gave students the option to write a final paper using the exit-polling experience to address a broader question about American elections and parties. Although she held a breakout session on statistical analysis for students who were so inclined, they could choose to write about their observations in a more qualitative or even narrative fashion.
For undergraduate courses with a methods component, several options exist. One faculty member had her students write policy memos that tested at least three hypotheses. Students had considerable flexibility in the hypotheses that they could test, but they had to include at least one interaction variable and look for treatment effects using at least one of the embedded experiments. Another faculty member simply asked students to use the data to write a final, original research paper that mimicked the format of a (short) scholarly journal article. Another faculty member used the data in subsequent courses on survey methods as a basis for an introduction to basic analytics.
In all cases, the opportunity to complete an assignment that involved the recent election was appreciated by many students. They were more engaged than usual with their research questions and highly motivated to correctly analyze the data. One student continued to pursue the poll-related research after the course concluded and presented the work at a research conference.
CONCLUSION
Overall, although the exit poll had more startup costs and required more planning than we anticipated initially, our takeaway is that the benefits far outweighed the costs. The exit poll allowed for a variety of teachable moments impossible to obtain within the typical course model of readings, lectures, and exams. We look forward to doing more of these as a group in the future, and we hope that our suggestions will make it easier for others to implement exit polls in their courses. Those of us who made the exit poll a central feature of the course appreciated the break it offered from typical lesson plans and the opportunity to engage with students regarding what turned out to be a momentous political event.
SUPPLEMENTARY MATERIAL
To view supplementary material for this article, please visit https://doi.org/10.1017/S1049096518002330