


Regardless of being in the wild or in controlled culture conditions, quantitative limitations of food or feed intake (FI) are relatively common in fish. Feeding costs often represent half of fish farms' operating costs; therefore, it is common for farmers to restrict feeding when facing logistical or financial hurdles. Other causes for the variability in access to food/feed include seasonal variations, disease outbreak, poor water quality, poor feed palatability and nutrient deficiencies. Animals need nutrients and energy to sustain their basal metabolism, enable movement, support their immune system, grow in size and produce gametes to establish the next generation. Contrary to higher vertebrates, fish are characterised by their particularly plastic growth: it is a process that is decidedly responsive to environmental factors while also being highly regulated at the level of organs and body constituents( Reference Weatherley 1 ). When quantitatively restricted, fish will prioritise the available resources between the above-mentioned functions: there is active adaptation as well as utilisation of available dietary nutrients and internal reserves to cover essential needs and achieve metabolic targets( Reference Stroganov and Karzin 2 ). Hence, the consequences of malnutrition depend not only on its severity and duration, but also on the priorities of the individual at a given time, i.e. life stage, health and reproductive status. However, although the far-reaching consequences of feed restriction on the physiology of animals (e.g. puberty( Reference McClure, Hammell and Moore 3 – Reference Shearer and Swanson 5 )) are easily conceivable, our current level of understanding remains mostly empirical. There is a need for more comprehensive and mechanistic approaches to better understand and predict these adaptive changes in a more rational manner.
Naturally, the most-studied consequence of feed restriction is its limiting effect on growth (increase in mass)( Reference Brett, Hoar, Randall and Brett 6 ). For example, feed-restricted fish often, but not always( Reference Massou, Panfili and Lae 7 ), have a lower condition factor K, indicating a change in body shape( Reference Mihelakakis and Kitajima 8 – Reference Ning, Hladyz and Gawne 10 ). This indicates that growth and development of some organs have priority over those of others, as also observed in humans( Reference Balint 11 ), other mammals( Reference McCance and Widdowson 12 – Reference Fleagle, Samonds and Hegsted 14 ) and birds( Reference Zhan, Wang and Ren 15 , Reference Boaamponsem, Dunnington and Siegel 16 ). Moreover, feeding regimens affect nutrient utilisation. Highly and poorly fed animals typically present different body compositions; higher intake generally leads to fatter fish( Reference Bureau, Hua and Cho 17 , Reference Arzel, Metailler and Le Gall 18 ). A negative relationship is characteristically observed between lipid and water contents as one is deposited by substituting the other( Reference Shearer 19 – Reference Love 21 ). However, body protein content remains remarkably constant and correlated with body weight( Reference Dumas, de Lange and France 22 – Reference Watanabe, Ura and Yada 24 ). The deposition of proteins and lipids is achieved through different processes( Reference Bureau, Hua, France and Kebreab 25 ); highly fed fish retain more lipid than protein, whereas fish fed a maintenance ration (metabolisable energy allocation resulting in zero energy gain) still have positive protein retention but mobilise body lipids.
Further reduction of rations may result in cachexia, a loss of lean mass compensated by an increase in water content in an attempt to maintain body weight. Pushing restrictions to the point of starvation will lead to wasting, where nutrient intake becomes so limiting that water accumulation can no longer compensate for the loss of cellular mass( Reference Roubenoff, Heymsfield and Kehayias 26 ). Thus, organisms develop different coping mechanisms according to the degree of feed restriction. It should be noted that despite the apparent similarity of sequential utilisation of nutrient storage during starvation( Reference Crawford 27 , Reference Black and Love 28 ), the metabolic adaptations to feed restriction are different and should not be directly compared.
Few studies have detailed the differences in growth dynamics between growth stages. Dumas et al. ( Reference Dumas, France and Bureau 29 ) showed three distinct growth stanzas in rainbow trout, which were characterised by different growth trajectories. It can be hypothesised that these stanzas can be further described by characteristic nutrient deposition patterns. Likewise, few studies have considered nutrient composition and deposition at the organ level and their relative growth. The viscera comprise organs that are central to essential physiological functions, such as digestion and nutrient processing, osmoregulation, ion and gas exchange, and immunity. These organs are metabolically costly to maintain and thus are tightly regulated by FI: enzyme activities and viscera somatic index are noticeably decreased during starvation( Reference Sainz and Bentley 30 , Reference Blier, Dutil and Lemieux 31 ). Additionally, skeletal muscle is not a homogeneous tissue as it contains, among other cell types, both red and white fibres. The former are typically characterised by aerobic metabolism and high physical endurance, while the contraction of the latter is faster, but their glycolysis-based metabolism makes them more susceptible to fatigue. Different metabolism paradigms imply a situation-dependent usage, typically long-term v. brisk, short-term efforts. Kiessling et al. ( Reference Kiessling, Storebakken and Åsgård 32 ) observed a decrease in the mean cross-sectional surface area of both white and red fibres with decreasing rations in rainbow trout. They found that the size distribution of white fibres was tightly correlated with body length, while that of red fibres was only changed in response to very restricted rations. Thus, evidence suggests that feeding regimens influence growth and nutrient deposition in different body organs or groups of organs. Understanding nutrient deposition patterns is key: from a biological perspective, they reflect the animal's priorities when matching available resources with metabolic targets and may affect lower-priority functions (e.g. immunity or reproduction as mentioned above). From a commercial perspective, tissues have different economic values (fillet v. viscera v. skeleton), and composition is known to determine texture and other physical characteristics that are critical to the food processing industry. However, there are limited quantitative data from which precise predictions of organ growth patterns and nutrient partitioning can be made.
By definition, energy-centred models cannot predict nutrient-specific deposition and are limited in their ability to predict feed efficiency (FE) under a wide variety of conditions( Reference Bureau, Hua, France and Kebreab 25 , 33 ). In the present study, we evaluated the influence of feed restriction on growth at the individual and tissue levels in rainbow trout. We also hypothesised that trout in different growth stages (fingerlings and juveniles) will prioritise nutrient accretion differently in a context of limited access to feed. Specifically, in juveniles, we investigated the patterns of nutrient deposition in four tissue compartments: the red and white muscles, viscera and the rest of the carcass. In fingerlings, we describe the response to feed restriction by analysing red and white muscle fibre hypertrophy and hyperplasia.
Materials and methods
Growth trial
All the experimental procedures were carried out in accordance with the University of Guelph Animal Utilization Protocol (#07R068). Experimental rainbow trout (Oncorhynchus mykiss) were obtained from the Alma Aquaculture Research Station. They were reared in a semi-recirculating system, equipped with twenty-four 46-litre tanks supplied with well water. Temperature was regulated between 12 and 13°C. Each tank was equipped with a sloped bottom and an air stone to provide aeration and help solid removal. The water was then directed to a settling sump followed by mechanical (foam) and biological (fixed-bed) filtration. Routine monitoring included temperature and mortalities (daily) and total NH3-N (weekly). Photoperiod was automatically controlled and set to a 12 h light–12 h dark cycle.
The experiment was set up as a 2 × 4 factorial design: two size classes and four feeding rations, namely 100, 75, 50 and 25 % of satiation. Size classes and feeding rations were randomly allocated to thirty-six tanks (three tanks per ration and per size class). The initial body weights of the two size groups were 68·9 (sd1·0) g (juveniles) and 1·3 (sd0·0) g (fingerlings), respectively. The juveniles were stocked at fifteen fish per tank, while the fingerlings were stocked at 150 fish per tank. Fish size and ration were randomly allocated to available tanks. All fish were fed the same diet, which was a high-quality extruded feed of known composition (open feed formulation MNR-08HS; Table 1) manufactured by Corey Feed Mill for the Ontario Ministry of Natural Resources feed contract. The diet was re-pelleted to 5 mm for the juveniles and 1 mm for the fingerlings. The highest restriction level was chosen because it approximately supports maintenance energy requirements and still allows some (protein) growth( Reference Bureau, Hua and Cho 17 ). All fish were fed twice a day for 6 weeks. At the beginning of the trial, satiation ration was determined for both age groups by manual feeding, and rations for the other groups were subsequently calculated. Rations were re-estimated twice per week.
Table 1 Formula and chemical composition of the diet (open feed formulation MNR-08HS)
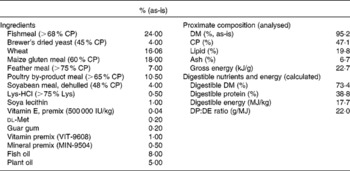
CP, crude protein; DP, digestible protein; DE, digestible energy.
Sampling
Before stocking the tanks, initial samples were taken: seventy-seven fingerlings (100 g) were sampled and frozen in four pools of 25 g for proximate analysis. At the same time, another ten fish were sampled, measured and weighed, and fixed in Serra's solution (absolute ethanol: six volumes; 37 % formalin: three volumes; glacial acetic acid: one volume) and kept at 4°C until transferred to n-butanol pending histological analysis( Reference Alami-Durante 34 ). All fish were killed using an overdose of buffered MS-222. Similarly, six juvenile fish were killed and immediately frozen ( − 80°C) until whole-body proximate analysis. An additional six juveniles were also sampled, weighed and measured, and dissected. The viscera were removed by separating the gill arches from the skull and pulling the gills, heart, digestive system and gonads outside the body cavity. The rectum was then cut as closely to the skin as possible to remove the visceral mass. Finally, the kidneys were scraped off and added to the visceral pool. Fish were then carefully filleted with a scalpel in a dorso-ventral direction in order to leave the ribs on the carcass. The skin was carefully removed, after which the red muscle was separated from the white muscle. Each body compartment (i.e. viscera, white muscle, red muscle and rest of the carcass) was weighed and bagged separately before being frozen ( − 80°C), pending chemical analysis.
At 2 and 4 weeks' time, one juvenile per tank (i.e. n 3 per treatment) was randomly sampled, measured, weighed and dissected as described above. Additionally, three fingerlings per tank (i.e. n 9 per treatment) were randomly sampled, measured, weighed and fixed in Serra's solution (absolute ethanol: six volumes; 37 % formalin: three volumes; glacial acetic acid: one volume) for histological analysis. Finally, upon trial termination (6 weeks), three juveniles per treatment were sampled for tissue dissection and twelve additional fish were frozen ( − 80°C) whole for proximate analysis. A total of nine fingerlings per treatment were randomly sampled, measured, weighed and fixed in Serra's solution for histological analysis, while forty-five additional fish per treatment were pooled and frozen ( − 80°C) for proximate analysis.
Laboratory analyses
Fingerling histology
For histological analysis, each fish was cross-sectioned in six places: at the pectoral girdle; the anterior insertion point of the dorsal fin; the anus; the dorsal and ventral insertion points of the caudal fin segments (Fig. 1(a)). The sections were dehydrated and embedded in paraffin. Ensuing histological slides (6 μm thick) were stained with haematoxylin and orange G( Reference Alami-Durante, Olive and Rouel 35 ). Histological slides were digitised, and the surface areas of the white and red muscles were measured using ImageJ (US National Institutes of Health, http://imagej.nih.gov/ij/). Additionally, the cellularity of white and red fibres was established according to the protocol developed by Alami-Durante et al. ( Reference Alami-Durante, Médale and Cluzeaud 36 ). Specifically, in section 4, all fibres in the dorsal red muscle were counted and measured. A subsampling area was determined in the white muscle to standardise the measurement of fibre diameters (Fig. 1(b)). Fibre count was extrapolated to the entire section based on the measured surface area of the white muscle.
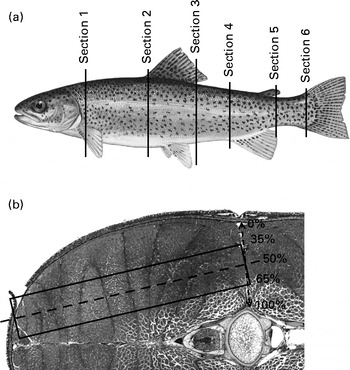
Fig. 1 Location of histological sampling: (a) location of cross-sections and (b) subsampling zone for the measurement of individual white muscle fibres.
SDS–PAGE of the white and red muscles of juveniles
White and red muscle samples of juveniles were analysed for total protein profile. A sample of fresh muscle (1 g) was homogenised in 0·6 m-NaCl solution (1:3, w/w) using an iced mortar and pestle. The resulting slurry was then centrifuged at 21 300 g (middle of the tube) for 20 min at 4°C. The supernatant was analysed for total N (Leco-FP528; Leco Corporation), and the samples were diluted to 2 mg protein per ml with a derivatising solution (15 mm-Tris 8·8, 2·5 % SDS, 5 % mercaptoethanol and 0·01 % bromophenol blue). The samples were then placed in boiling water for 5 min and stored in a fridge until separation by gel electrophoresis. Electrophoresis was conducted using a PhastSystem (GE Healthcare) and pre-cast stacking gels (PhastGel Homogeneous 20). On each gel, two standard ladders (range 14·5–220 kDa) were run. After completion of the separation, the gels were stained using Coomassie staining solution.
Proximate analyses
Samples collected for proximate analyses were autoclaved, ground into homogeneous slurry, freeze-dried, homogenised and stored at − 20°C until analysis. Analyses included DM (since freeze-drying dries the samples incompletely) and ash according to the guidelines of the Association of Official Analytical Chemists( 37 ), crude protein (CP, %N × 6·25) using Leco-FP528, and total lipid according to the method of Bligh & Dyer( Reference Bligh and Dyer 38 ). The ash content of red muscle samples could not be determined due to limited amounts of tissue. The gross energy content of whole-carcass samples was measured using an automated bomb calorimeter (Model 1272; Parr Instruments). Gross energy content was not analysed in body compartment samples due to limited amounts of tissue.
Calculations and statistical analysis
Growth rates were calculated as thermal-unit growth coefficients (TGC)( Reference Iwama and Tautz 39 , Reference Cho 40 ):
 $$\begin{eqnarray} TGC = \frac {FBW^{1/3} - IBW^{1/3}}{\sum ^{ d } T _{ d }}\times 100, \end{eqnarray}$$
where FBW is the individual final body weight (g), IBW is the individual initial body weight (g) and T is the average water temperature for the day (d).
Since individual fish were dissected and analysed, individual FI (g/kg0·8) had to be estimated. However, social interactions (e.g. dominance) prevented us from assuming that the tank ration was equally distributed between the fish. Therefore, FI was estimated based on the regression of TGC against FI using tank-based data over the entire trial. The regression equations were as follows:
 $$\begin{eqnarray} For\ juveniles:\ FI = 111\cdot 19\, e ^{6\cdot 1392\times TGC}\ ( R ^{2}\,0\cdot 9846), \end{eqnarray}$$
 $$\begin{eqnarray} For\ fingerlings:\ FI = 89\cdot 977\, e ^{11\cdot 171\times TGC}\ ( R ^{2}\,0\cdot 9892). \end{eqnarray}$$
Upon sampling, individual fish were weighed, which allowed for the calculation of an individual TGC and then for the estimation of FI since the beginning of the trial. Maintenance rations were estimated by extrapolation of the above equations, solving for TGC = 0. Thus, maintenance ration for juveniles was 2·6 g/kg0·8 per d and that for fingerlings was 2·1 g/kg0·8 per d.
All the results were subjected to statistical analysis using SPSS 19 (IBM). Results were deemed significant when P <0·05, unless otherwise stated. The results obtained for the effect of treatments on proximate composition of the fish, nutrient deposition, SDS–PAGE and muscle histology (surface area and cellularity) were subjected to multiple regression analyses. Regression models between treatment levels were tested for uniformity of slope and intercept by ANCOVA( Reference Snedecor and Cochran 41 ) before running the regression across all the treatments (data not shown).
Results
Growth performance
The growth performance of both the fingerling and juvenile groups reflected the graded levels of feed restriction. At the end of the trial, the average individual weights of fish in the 100 and 25 % feeding groups were 175·2 and 100·5 g for juveniles and 5·8 and 2·5 g for fingerlings. Growth rates (expressed as TGC) increased with FI, ranging from 0·048 to 0·115 in fingerlings and from 0·098 to 0·248 in juveniles. However, this increase slowed down at the highest feeding level. This was confirmed by a significant quadratic relationship between TGC and FI (fingerlings: R 2 0·990, P< 0·0001; juveniles: R 2 0·995, P< 0·0001). Additionally, the plateau was more pronounced in the juveniles than in the fingerlings. FE were also significantly affected in a quadratic fashion. However, in juveniles, FE was decreased only in the highly fed fish (1·22–1·32 in the 25–75 % feeding groups; 1·06 % in the 100 % feeding group), whereas in fingerlings, it was significantly higher in fish in the 50 and 75 % feeding groups (1·23–1·25 in the 25 and 100 % feeding groups; 1·38–1·41 in the 50 and 75 % feeding groups). Overall mortality was 4·5 % in fingerlings, without significant differences between the feeding groups. No mortality was recorded in the juveniles.
Whole-fish composition
Fig. 2 shows the correlations between FI and whole-carcass compositions of fingerlings and juveniles at the end of the trial. In juveniles, water and lipid contents exhibited opposite trends with regard to FI: as the former decreased, the latter increased with higher intake. Although a similar relationship was observed in fingerlings, multiple linear regression analysis indicated that body weight was the only significant factor correlated with body water content. The CP content of fingerlings and crude lipid content of both juveniles and fingerlings were significantly affected by FI (P< 0·001; Table 2). The energy content of juveniles reflects the impact of FI on CP and lipid contents, and thus it was also significantly affected by FI. Contrarily, the water and energy contents of fingerlings were significantly correlated only with body weight. Finally, the protein content in juveniles and the ash content in both juveniles and fingerlings were not significantly affected by body weight or FI (Table 2).
Fig. 2 Whole-carcass composition of fingerlings (a) and juveniles (b) at the end of the trial. ○, Crude protein; ●, lipid; Δ, ash; ▲, water.
Table 2 Statistical results of stepwise linear regression of whole-body composition (g) v. feed intake (FI; g/fish) at the end of the 6-week trial

F, fingerling; BW, body weight; J, juvenile.
Nutrient accretion in the body compartments of juveniles
Fig. 3 shows the nutrient accretion in each of the four body compartments against FI. The deposition of all nutrients showed positive correlations with FI, and no nutrient loss (negative deposition) was observed, including at the lowest FI levels. Regardless of the body compartment, ash was the least-deposited nutrient. Conversely, water was mostly deposited in the white and red muscles along with proteins, whereas lipids were mostly deposited in the viscera.
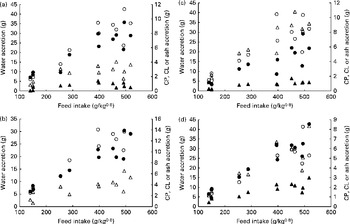
Fig. 3 Nutrient accretion in (a) white muscle, (b) red muscle, (c) viscera and (d) rest of the carcass during the entire trial. ○, Water; ●, crude protein (CP); Δ, crude lipid (CL); ▲, ash.
The data were further analysed using multiple isometric regression analysis. Indeed, allometric regressions yielded higher residuals than isometric regressions (data not shown), in accordance with previous reports( Reference Dumas, de Lange and France 22 ). Nutrient accretion was tested against body weight and FI and their interaction. Results revealed that FI alone was not a significant factor (Table 3): the accretion of proteins, lipids and ash in the white muscle, ash in the viscera, and proteins in the rest of the carcass was significantly affected by the interaction of body weight and FI (R 2 0·719–0·970, P< 0·001). The accretion of all the other nutrients was significantly correlated only with body weight (R 2 0·543–0·950, P< 0·001).
Table 3 Statistical results of stepwise linear regression of nutrient accretion in body compartments at the end of the 6-week trial
BW, body weight; CP, crude protein; FI, feed intake (g/kg0·8 per 6 weeks); CL, crude lipid.
Protein profile in the red and white muscles of juveniles
In the SDS–PAGE of white muscle samples, twenty-one bands with molecular weights ranging from 8·7 to 224·7 kDa were separated. In the SDS–PAGE of red muscle samples, nineteen bands with molecular weights ranging from 14·0 to 233·6 kDa were separated. The bands can be grouped based on the results of multiple regression analyses of accretion v. body weight and FI (Table 4). In the white muscle, four different patterns were observed. In the white muscle, the deposition of most of the bands (nine of twenty-one; first pattern in Table 4) was significantly correlated only with body weight (P< 0·001), while six other bands (second pattern in Table 4) were significantly correlated with neither factor. In the third pattern, the deposition of four bands (20, 40, 45 and 173 kDa) was positively correlated with body weight, but negatively correlated with FI (P< 0·05). Finally, only two bands (22 and 32 kDa) were significantly correlated with only FI (P< 0·01).
Table 4 Results of linear multiple regression analysis of muscle protein separation by SDS–PAGE: correlation with body weight and feed intake (FI)
BW, body weight; +, positively correlated with protein(s) accretion; − , negatively correlated with protein(s) accretion.
In the red muscle, all but one band were significantly correlated with only body weight (P< 0·05). The 98 kDa band was positively correlated with body weight and negatively correlated with FI (P< 0·001).
Fingerling histology
Histological analysis of the muscles of fingerlings indicated differences in muscle growth patterns. Figure 4(a) and (b) shows the changes in total surface area of white muscle and red muscle, respectively, in each of the six cross-sections. The cross-sectional surface areas of the white muscle increased with FI in a logarithmic fashion (P< 0·0001), while those of the red muscle increased more linearly (P< 0·001). Stepwise multiple regression analyses (surface areas v. body weight, FI, fish height, fish total length and fish condition factor) for each of the six sections showed that the four anterior sections were significantly affected by FI, while the two most posterior sections were not (Table 5). Fish body weight was not a significant factor.
Fig. 4 Total surface area of (a) white muscle (WM) and (b) red muscle (RM) in the six cross-sections of fingerlings. ⋄, Section 1; □, section 2; Δ, section 3; × , section 4; ![]() , section 5; ○, section 6.
, section 5; ○, section 6.
Table 5 Statistical results of stepwise linear regression of muscle surface area in each of the six cross-sections at the end of the 6-week trial
FI, feed intake (g/kg0·8 per 6 weeks); FH, fish height (mm); TL, fish total length (mm); K, condition factor.
Table 6 summarises the results of stepwise multiple regressions of fibre diameter and number in the red and white muscles located in section 4: total fish length was the sole significant predictor of the mean and median fibre diameter in the white muscle, as well as the diameter of the five biggest white fibres. Body weight was the only significant factor when regressing against the number of fibres. In contrast, in the red muscle, all husbandry variables were non-significant for all cellular variables except for the number of fibres. Changes in fibre number and diameter for the four dietary levels are shown in Fig. 5. In the white muscle, the number of fibres increased linearly as fish gained weight (P< 0·0001; Fig. 5(a)). Simultaneously, the average diameter of the five biggest white fibres showed a negative linear correlation with fish length (P< 0·0001; Fig. 5(b)). Finally, a negative exponential relationship between the diameter of the biggest white fibres and their number was observed (P< 0·0001; Fig. 5(c)). Additionally, highly restricted fish had fewer fibres but with higher maximum diameter compared with the highly fed fish. In the red muscle, the number of fibres also increased linearly with body weight (P< 0·0001; Fig. 5(a)). However, there was no significant correlation between fish length and the diameter of the five biggest fibres (Fig. 5(b)) or between the diameter of the biggest fibres and the number of red fibres (Fig. 5(c)).
Table 6 Statistical results of stepwise linear regression of red and white muscle fibre cellularity at the end of the 6-week trial
TL, fish total length (mm); BW, fish body weight (g); D mean, average fibre diameter; D median, median fibre diameter; D 5 biggest, average diameter of the five biggest fibres.
* Stepwise models for D mean, D median and D 5 biggest in the red muscle excluded all the variable candidates; therefore, R 2 and P values cannot be computed.
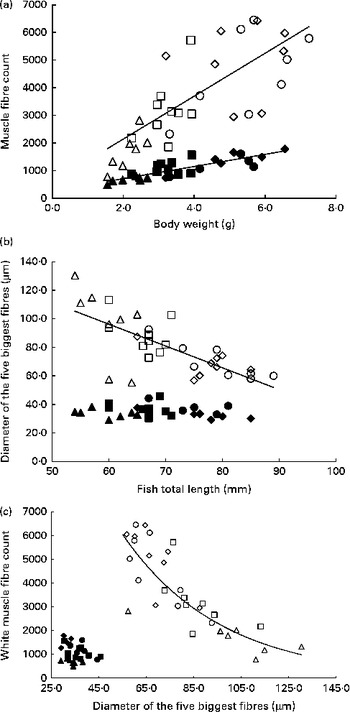
Fig. 5 Cellularity of the white muscle (WM) and red muscle (RM) fibres in fingerlings. (a) Number of WM and RM fibres v. body weight. WM fibres: linear regression, R 2 0·5621, P< 0·0001; y= 776·38x+588·95. RM fibres: linear regression, R 2 0·7050, P< 0·0001; y= 219·76x+271·03. (b) Diameter of the five biggest RM and WM fibres v. fish length. WM fibres: linear regression, R 2 0·5628, P< 0·0001; y= − 1·5278x+187·85. RM fibres: no significant correlation (P>0·05). (c) Number of RM and WM fibres v. diameter of the five biggest fibres. WM fibres: exponential regression, R 2 0·7465, P< 0·0001; y= 22 735 e − 0·024x . RM fibres: no significant correlation (P>0·05). Δ, WM 25 %; □, WM 50 %; ⋄, WM 75 %; ○, WM 100 %; ▲, RM 25 %; ■, RM 50 %; ♦, RM 75 %; ●, RM 100 %.
Discussion
Feed restriction has been shown to influence physiology and metabolism in fish( Reference Imsland and Gunnarsson 42 – Reference Kiessling, Kiessling and Storebakken 44 ). However, most studies were limited to whole fish or a single body compartment. The main goal of the present study was to gain a more comprehensive view of nutrient deposition patterns in response to varying levels of FI. The results shed light on the adaptive strategy of fish, which organ group is prioritised and how these priorities change as fish grow in size.
Effect on tissue and organ growth
At the whole-fish level, proximate composition was significantly affected by the dietary treatment. In accordance with previous studies( Reference Shearer 19 , Reference Suárez, Martínez and Sáez 45 , Reference Lupatsch, Kissil and Sklan 46 ), we observed the well-described water/lipid negative correlation in both the size classes and a stable protein content in juveniles. Nevertheless, in the present study, there was a positive deposition of all nutrients, including lipids, in all the experimental groups, as well as positive growth and good FE. Thus, even the lowest feeding level was above the maintenance level, and the fish were neither wasted nor cachectic( Reference Roubenoff, Heymsfield and Kehayias 26 ). However, we did not observe negative energy retention as Bureau et al. ( Reference Bureau, Hua and Cho 17 ) did when using a similar experimental protocol. This loss of energy was driven by lipid mobilisation at the end of the 24-week trial. There are limitations in expressing feed restriction as a proportion of near-satiation intake due to variability in the latter parameter. It is possible that we would have obtained similar results if the trial had been extended. This suggests that trout are able to withstand heavy feed restriction (about 25 % of satiation ration) for extended periods of time.
The bioenergetics model predicts a gradual decrease in FE as the metabolisable energy intake decreases( Reference Kaushik and Médale 47 , Reference Cho 48 ). However, FE was only marginally affected by feeding rations. In both the size classes, the best FE were observed in the moderate feed restriction groups (50 and 75 % feeding groups: 250–320 and 350–480 g feed/kg0·8 for fingerlings and juveniles, respectively), while lower FE were observed in fish fed to satiation. This is consistent with the results of the study carried out by Cleveland & Burr( Reference Cleveland and Burr 49 ), who reported best FE at 75 % satiation and a significant decrease at 100 % satiation. However, the authors also observed a strongly decreased FE (52 %) in their most-restricted group (52 % at 20 % feed ration), which corresponded to an intake of 33·1 kJ/kg0·8 per d on a digestible energy basis. FE increased to 96–98 % in the other groups fed 58·4 kJ/kg0·8 per d and above. In contrast, we did not observe such a drastic decrease in FE in highly restricted groups in juveniles (FE range 96·9–120·8 %) or in fingerlings (FE range 120·8–139·1 %). However, the lowest intakes were 84·5 and 64·7 kJ/kg0·8 per d in the juveniles and fingerlings, respectively, which are higher than those reported by Cleveland & Burr( Reference Cleveland and Burr 49 ). This is due to higher dietary protein and lipid contents, which resulted in a more energy-dense diet. Therefore, it is likely that the marked drop in FE as observed by Cleveland & Burr( Reference Cleveland and Burr 49 ) is due to a higher level of feed restriction compared with that employed in the present study.
The present study also highlights differences in how fish from the two size classes react to feed restriction. FE decreased significantly in groups fed highly restricted rations (25 %) in fingerlings but not in juveniles. This is probably due to the decrease in CP content in fingerlings, despite a remarkable increase in water content (Table 2; Fig. 2(a)). Dumas et al. ( Reference Dumas, de Lange and France 22 ) also found that smaller fish have a lower CP content. Juveniles, on the other hand, maintain their body protein content and the increase in water content is sufficient to mask the loss of lipid mass. Therefore, they remain able to gain weight in such conditions, hence maintaining FE relatively stable. Additionally, water, protein, lipid and energy contents of juveniles were best described by FI, whereas body weight was the most significant factor explaining water and energy contents in fingerlings (Table 2). Thus, the body composition of fingerlings is more strongly driven by body weight than that of juveniles. This suggests that the priority for juveniles is to maintain their body protein content, whereas maintaining water and energy (i.e. balanced protein/lipid) contents would be more important for fingerlings.
Effect on muscle protein profile
The present study is the first study to describe a preferential accretion of specific proteins in the muscle in response to graded levels of FI. The present results indicate that the deposition of some proteins is simply influenced by body mass, while that of others is significantly affected by FI levels. This suggests that specific proteins can be utilised for catabolism, while some others are protected. This is the case, for instance, for the 20, 40, 45 and 173 kDa fractions in the white muscle and the 98 kDa fraction in the red muscle: the deposition of these proteins is negatively correlated with FI. Therefore, they are preferentially deposited when FI is limited, whereas they account for a smaller proportion of deposition when FI is high. Since these fractions probably include proteins such as α-actin (45 kDa) and subunits of myosin (173 kDa), these results suggest that the priority is logically given to the structural proteins of muscle core function. These results are in contrast with those obtained by Suárez et al. ( Reference Suárez, Martínez and Sáez 45 ), where graded levels of feeding restriction had only marginal, non-significant effects on the myofibrillar and sarcoplasmic protein fractions of the white muscle. However, this study used bigger fish (300–330 g) and restricted them for a shorter period of time (30 d). Other studies described the effects of starvation on the preservation of white muscle proteins( Reference Beaulieu and Guderley 50 , Reference Weber and Bosworth 51 ) and also showed the preservation of myofibrillar proteins such as α-actin.
Changes in myofibrillar and sarcoplasmic proteins are important, because they play a pivotal role in fillet quality characteristics, particularly firmness, that affect consumer acceptance and mechanical processing( Reference Godiksen, Morzel and Hyldig 52 ). Attempts to control sensory characteristics (odour, texture, firmness, etc.) of fish fillet via manipulations of diet composition or swimming exercise resulted in limited effects( Reference Mathis, Feidt and Brun-Bellut 53 – Reference Rasmussen 57 ). However, feeding level may have a more significant effect, provided fish are restricted enough: in salmon, slight feed restriction (80 % of satiation) has virtually no effect on fillet texture or lipid content( Reference Young, Morris and Huntingford 58 ), whereas 50 %-restricted rainbow trout scored significantly lower for firmness and freshness of taste( Reference Johansson, Kiessling and Åsgård 59 ). However, dedicated research is required to ascertain the relationship between these changes in protein profile and sensory quality of the edible muscle.
Fingerlings: effect on muscle growth dynamics and cellularity
Significant differences were observed in the number and diameter of muscle fibres, although FI level was always excluded during the stepwise process in favour of fish length and fish height (Table 6). Since FI level was a significant factor for muscle total surface area (Table 5), a change in fibre size distribution can be considered to be the mechanism by which nutritional status influences muscle size.
As expected, in both the muscles, we observed a linear increase in the number of fibres as the fish gained weight as a result of increasing ration (Fig. 5(a)). This illustrates the hyperplastic adaptation of muscle growth to feeding levels. However, differences between the white and red muscles arise when comparing maximum hypertrophy; in white muscles the maximum fibre diameter is lower in highly fed animals compared with restricted animals, whereas the maximum diameter remains stable in the red muscle regardless of feeding ration (Fig. 5(b)). These results suggest a higher priority for the conservation of the relative contribution of hyperplasia and hypertrophy to muscle growth in the red muscle in response to feed restriction and confirm previous findings that the white muscle is the vector of fish muscle plasticity( Reference Alami-Durante, Médale and Cluzeaud 36 , Reference Weatherley and Gill 60 ).
It is known that in fish, muscle grows both by hyperplasia and by hypertrophy at all ages( Reference Kiessling, Storebakken and Åsgård 32 , Reference Weatherley, Gill and Rogers 61 ). However, muscle grows predominantly by hyperplasia in larvae and fingerlings and then mostly by hypertrophy as fish size increases( Reference Alami-Durante, Fauconneau and Rouel 62 , Reference Koumans, Akster and Booms 63 ). The present study shows that highly fed fish have more white fibres and a lower maximum hypertrophy than low-fed fish, which is not observed in the red muscle (Fig. 5(c)). This suggests that FI mediates muscle growth by influencing the balance between hyperplasia and hypertrophy in the white muscle: low FI favours hypertrophy of existing fibres, while highly fed fish exhibit significantly heightened hyperplasia. However, the fish strive to maintain red muscle cellularity, as shown by the lack of differences between the high and low levels of FI. These findings are in accordance with those obtained in carp larvae, juvenile rainbow trout and Atlantic salmon( Reference Alami-Durante, Fauconneau and Rouel 62 , Reference Higgins and Thorpe 64 , Reference Weatherley, Gill and Rogers 65 ), where hypertrophy in the white muscle was favoured in slow-growing animals. However, this contrasts with findings in large, 2·5-year-old rainbow trout, where slow growth was associated with hyperplasia( Reference Kiessling, Storebakken and Åsgård 32 ). This may indicate a shift in the way the animal prioritises as it ages, thereby influencing its adaptive strategy to low food availability.
Juveniles: coordination of nutrient utilisation between organ groups
Overall, the results of the present study shed light on the coordinated metabolism between major groups of organs. First, body weight was always a significant factor in the analysis of nutrient deposition in the four body compartments, whether as the sole factor or through an interaction with FI. This overwhelming influence strongly suggests that the organism strives to reach a set nutrient deposition target. This is illustrated by the well-described stability of protein content at the whole-body level( Reference Dumas, de Lange and France 22 ). When FI becomes limited and achieving this target is hindered, priorities are set to selectively mobilise nutrient and groups of organ in favour of others. The present study demonstrates some of these priorities.
The present results indicate that the white muscle is the most-affected tissue when responding to feed restriction (Table 3). In fish, the muscle represents the bulk of the body (about 50 % of the body weight in rainbow trout fingerlings and juveniles), hence a nutrient reserve as well. However, there are clear differences in mobilisation between the white and red muscles. This is illustrated by the nutrient accretion results as well as by the SDS–PAGE results; the red muscle is the only body compartment where body weight is the sole significant predictor of nutrient accretion (Table 3), while the SDS–PAGE results indicate that a single protein fraction is significantly affected by FI in the red muscle, compared with six fractions in the white muscle. Taken together, these results advocate for a priority of the red muscle over all other organs and especially over the white muscle. This can be explained by the function of the red muscle, the slow-twitch fibres of which allow for long-term, sustained swimming. On the other hand, the fast-twitch fibres of the white muscle allow for short-term, swift efforts such as attack or escape. The latter behaviours are of lesser priority compared with the ability to sustain swimming, which would explain the effort to preserve the red muscle. The metabolic difference between the red and white muscles is supported by previous studies, which described a differentiation in the metabolic substrate between white and red fibres( Reference Kiessling, Kiessling and Storebakken 44 ): glycolysis is predominant in the white muscle of juveniles, while β-oxidation is mostly observed in the red muscle. Taken together with the nutrient deposition results of the present study, this suggests that lipids stored in the white muscle are mobilised to fuel the aerobic demands of the red muscle.
Although visceral fat deposition was reduced as FI decreased (Fig. 3(c)), the finding that accretion of visceral lipids was only significantly affected by body weight (Table 3) was unexpected. This may have been otherwise if the trial had been run longer. Nevertheless, this suggests that muscle lipids are more labile in rainbow trout and are utilised before visceral fat during periods of restricted access to feed or food.
Summary
In conclusion, we provide evidence of priorities in growth and nutrient deposition in body compartments in response to FI levels in fish. At the whole-body level, juveniles strove to maintain body protein, while fingerlings prioritised water and energy contents. Although live body weight is a strong predictor of nutrient accretion, FI primarily affected the white muscle in juveniles while preserving the red muscle as well as the viscera. Specific proteins were preferentially deposited or mobilised in the muscle in response to varying feeding levels. Finally, fingerlings demonstrated adaptation to low feed availability by decreasing hyperplasia in favour of hypertrophy. Taken together, these results quantify the coordination between groups of organs in orchestrating the response to low food availability. They point to the differences in adaptation strategies between the two size classes studied in the present study. However, additional research will be necessary to incorporate these findings into the further development of nutritional models to accurately predict fish growth, FE and composition of edible products.
Acknowledgements
The authors thank Mashiur Rahman for his assistance with fish husbandry, as well as Marianne Cluzeaud and Susan Lapos for their help with the processing of histological samples. They also thank undergraduate students from the University of Guelph who assisted with some of the chemical and image analyses: Katrina Blackburn, Paige DeMarchi, Nancy-Gioia DeThomas and Samantha Jackson.
The present study was funded by the Ontario Ministry of Natural Resources (OMNR) and the Natural Sciences and Engineering Research Council of Canada (NSERC). Neither OMNR nor NSERC had a role in the design and analysis of the study or in the writing of this article.
The authors' contributions are as follows: G. S. and D. P. B. designed the experiment and led the project; G. S. conducted the feeding trial, collected and analysed the samples, and wrote the manuscript; H. A.-D. provided training and equipment for preparing histological slides and their interpretation; S. B. and M. M. provided training and equipment for SDS–PAGE and corresponding data interpretation. All authors contributed to manuscript preparation.
None of the authors has any conflicts of interest to declare.


