


Sir,
In their paper on the mode of formation of ablation hollows, Reference Rhodes,, Armstrong, and Warren,Rhodes and others (1987) presented some useful ideas on a small scale, but nevertheless an interesting problem. Ablation hollows, often called ablation polygons or sun cups (Reference Matthes,Matthes, 1934; Reference Jahn, and Klapa,Jahn and Klapa, 1968) are common features which form more or less regular networks of hollows and interconnecting ridges, on the surface of compacted “spring” snow. In resolving some of the conflicting observations in the literature, Rhodes and others explained how these hollows can form under conditions in which ablation is forced either by direct solar radiation or by turbulent heat transfer. To achieve this, the role of dirt is considered, in terms of the opposing effects arising from its properties of thermal insulation and low albedo.
Whilst their major conclusions are valid, they seem to have partially misinterpreted the message of Reference Driedger,Driedger’s (1981) “enhancement of ablation” maximum (Fig. 1). Reference Rhodes,, Armstrong, and Warren,Rhodes and others (1987) divided the empirical Driedger curve into two regimes: the rising limb, t < 3 mm, where da/dt > 0, and the falling limb, t > 3 mm, where da/dt < 0 (a = ablation factor, t = ash thickness). They went on to consider the maximum point of ablation as a “threshold thickness”. This concept is particularly important, as we shall see, because of the frequently verified mechanism (Reference Ball,Ball’s (1954) normal trajectory theory (Fig. 2)), which demonstrates that dirt migrates to the summits of ridges as the ablation topography develops and the snow surface is lowered. If the hollows and ridges are to be sustained, the ablation rate at the ridge must clearly be less than that at the hollow. Under conditions dominated by solar radiation, the low-albedo dirt/ash on the ridge will be a strong influence; dirt concentration leads to increased ablation at the ridges, relative to the hollows, setting up a negative feed-back mechanism, thereby preventing their formation. In their interpretation, Reference Rhodes,, Armstrong, and Warren,Rhodes and others (1987) suggested that no negative feed-back would occur under direct sunlight “if the snow is covered with a layer of dirt thicker than the threshold value (c. 3 mm) … and the irregularity (ridge) can continue to grow”. Here, the use of the term “covered” is significant; their interpretation is correct under conditions of total dirt cover but only where thickness on the ridge exceeds thickness on the hollow and both thicknesses exceed the 3 mm maximum. Conditions of total dirt cover are not common, arising only from volcanic-ash or dust-storm events. Examination of ablation hollows and of published photographs and diagrams (e.g. Reference Jahn, and Klapa,Jahn and Klapa, 1968) reveals that debris cover in the hollow areas is minimal. As dirt normally arises at the snow surface by exhumation of irregularly buried mineral and organic material, this is not surprising. The development of an ablation topography becomes more complex, however, when the dirt cover is continuous, but its thickness on the ridge corresponds to the falling (R.H.) limb and the hollow thickness (thinned by normal trajectory theory) lies on the rising (L.H.) limb. This scenario was not discussed by Reference Rhodes,, Armstrong, and Warren,Rhodes and others (1987), but it is possible that conditions favouring topographic development can be transferred into conditions favouring topographic decay simply by the thinning of the hollows’ dirt from the falling to the rising limb.
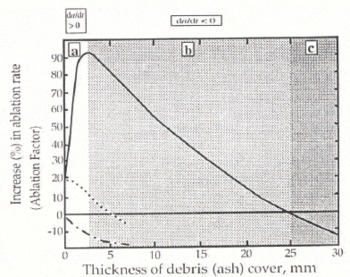
Fig. 1. The change in ablation rate of different (Mount St. Helens) ash thicknesses at experimental plots on South Cascade Glacier, Washington, August 1980. Dotted lines are theoretical representations of conditions of reduced solar radiation. (Adapted from Reference Driedger,Driedger (1981) and Reference Rhodes,, Armstrong, and Warren,Rhodes and others (1987).) (da/dt = increase in ablation.)

Fig. 2. Diagram illustrating how dirt initially uniformly distributed through snow is concentrated at the ridges of polygons as ablation proceeds. Curves 1–5 represent the successive positions of the lowered snow surface. Dirt initially at Β is later located at B′; Similarly for A and C. (Both the figure and the caption from Reference Ball,Ball (1954, fig. 1).)
Under the relatively common conditions of dirt-free hollows, Reference Driedger,Driedger’s (1981) curve can be differently divided into two regimes relating to hollow-ridge enhancement and decay. This dividing-thickness threshold does not correspond to the ablation-rate maximum but is at the point where the increase in ablation rate, relative to no dirt cover, is zero (t = 25 mm). Ridge ablation will exceed hollow ablation, beyond the maximum, although beyond this point the relative ridge ablation will decline with increasing thickness.
The empirical curve represents the maximum possible increase of ablation rate under the weather conditions considered. The additional theoretical curves (Reference Rhodes,, Armstrong, and Warren,Rhodes and others, 1987, Fig. 1), in which solar radiation is of reduced significance, indicate either little or no enhancement of dirt-covered or clean-snow ablation rates. From these curves and from the theoretical assumptions of Reference Rhodes,, Armstrong, and Warren,Rhodes and others (1987), the growth of clean-hollow ablation topography under a (ridge) debris cover of < 25 mm thickness, in a regime dominated by solar radiation, is problematic. That these features do grow in this regime is evident. It would appear that some other, as yet undetermined, factor must be involved in both the inception and development of these features. This conclusion seems to suggest that the growth of ablation topography is favoured by systems dominated by turbulent heat transfer. Until all factors influencing their development are understood, this conclusion should be treated with caution. Furthermore, disregarding the assumption of constant debris cover in relation to the Driedger curve (an assumption implicit, although unstated by Rhodes and others) allows the dynamical development of the ablation topography. Consideration of this possibility suggests that future work should be directed towards detailed and regularly repeated surface mapping of the topography, a strategy that has not been employed in published field studies.
The accuracy of references in the text and in this list is the responsibility of the author, to whom queries should be addressed.


