Introduction
Phylogeographical and population genetic approaches have greatly contributed to elucidating the evolutionary history of individual species or groups of closely related taxa (Hickerson et al. Reference Hickerson, Carstens and Cavender-Bares2010) and defining hotspots in conservation (e.g., Rosauer et al. Reference Rosauer, Blom and Bourke2016, Souto et al. Reference Souto, Mathiasen, Acosta, Quiroga, Vidal-Russell, Echeverría and Premoli2015). Multispecies phylogeographical analyses (Riddle et al. Reference Riddle, Dawson, Hadly, Hafner, Hickerson, Mantooth and Yoder2008) at the community level involve the study of biogeographical patterns that can contribute to conservation actions. Yet phylogeographical scenarios are still to be tested, mainly those related to large phylogenetic gaps across species resulting from long-term extrinsic barriers for gene flow (Avise et al. Reference Avise, Arnold, Ball, Bermingham, Lamb, Neigel, Reeb and Saunders1987). In particular, Avise et al. (Reference Avise, Arnold, Ball, Bermingham, Lamb, Neigel, Reeb and Saunders1987) described the first category of phylogeographical scenarios thusly: “strong biogeographic barriers should mould the genetic structures of independently evolving species in concordant fashion.” Thus, concordant phylogeographical patterns can be used to infer the geographic, geological and climatological phenomena (Hickerson et al. Reference Hickerson, Carstens and Cavender-Bares2010) that can contribute to defining areas relevant to conservation.
The field of comparative phylogeography describes the evolution of landscapes and allows for the analysis of the effects of history and geography on the community structure at both local and regional levels (Bermingham & Moritz Reference Bermingham and Moritz1998). Knowledge concerning the different ages of biotas, their areas of extent and the evolutionary forces shaping different species will enhance understanding of the processes responsible for the origin and maintenance of communities, thus contributing to biodiversity conservation efforts (Bermingham & Moritz Reference Bermingham and Moritz1998) beyond the species level. Moreover, comparative phylogeography has the potential to offer unprecedented insights into the taxa themselves (Papadopoulou & Knowles Reference Papadopoulou and Knowles2016). Until now, the interpretation of phylogeographical patterns in conservation has traditionally focused at the intraspecific level on identifying biogeographic phenomena under the original idea of Moritz (Reference Moritz1994), based on the definition of evolutionarily significant units (ESUs).
In phylogeography, the concordance criterion (Avise Reference Avise2009) is the opposite to that of discordance; however, both are important when co-distributed taxa are analysed, and they can complement each other by providing information on the interaction between species’ ecology and climate change (Papadopoulou & Knowles Reference Papadopoulou and Knowles2016). Phylogeographical patterns were analysed in arthropods with the host pitcher plant (Satler & Carstens Reference Satler and Carstens2016), the symbiosis between a bat and its ectoparasitic bat fly (van Schaik et al. Reference van Schaik, Dekeukeleire and Kerth2015) and biogeographical patterns of several Amazonian taxa (Gehara et al. Reference Gehara, Garda and Werneck2017, Prates et al. Reference Prates, Rivera, Rodrigues and Carnaval2016). In all of these cases, the studies were performed using a pair of taxa or related taxa, where the DNA region analysed or loci used have similar mutation rates. Therefore, the analysis of phylogeographical ‘concerted’ patterns, rather than ‘individualistic’ ones, can offer important insights into fundamental ecological and evolutionary principles (Papadopoulou & Knowles Reference Papadopoulou and Knowles2016). Thus, current genetic data among co-distributed taxa using distinct loci can be used to test for concurrent divergence patterns across multiple taxa (Huang et al. Reference Huang, Takebayashi, Qi and Hickerson2011). The huge public collection of DNA sequence data now available in GenBank (www.ncbi.nlm.nih.gov) provides the possibility of working with samples from a wide diversity of taxa and of scaling up to the community level, opening up new chances for comparative phylogeographical studies in less explored geographical regions that could potentially test classic biogeographical hypotheses above the species level (Riddle et al. Reference Riddle, Dawson, Hadly, Hafner, Hickerson, Mantooth and Yoder2008).
Widespread species usually consist of large and relatively continuous populations with high genetic diversity (Hamrick & Godt Reference Hamrick, Godt, Brown, Clegg, Kahler and Weir1989). Nonetheless, a large amount of neutral genetic variation is structured in space (e.g., due to historical isolation and barriers to gene flow), which allows ESUs and management units within species sensu Moritz (Reference Moritz1994) to be identified. In particular, ESUs have been largely used to design conservation strategies in order to preserve the evolutionary potential of individual species, protecting reciprocally monophyletic groups of populations by means of DNA sequences and showing significant divergence at nuclear genes (Moritz Reference Moritz1994). Moreover, concordant/discordant patterns emerging from the analysis of distinct molecular markers and different species may indicate shared major evolutionary forces and current ecological processes shaping their gene pools that can contribute to the conservation of biodiversity (Manel et al. Reference Manel, Gugerli, Thuiller, Alvarez, Legendre, Holderegger, Gielly and Taberlet2012).
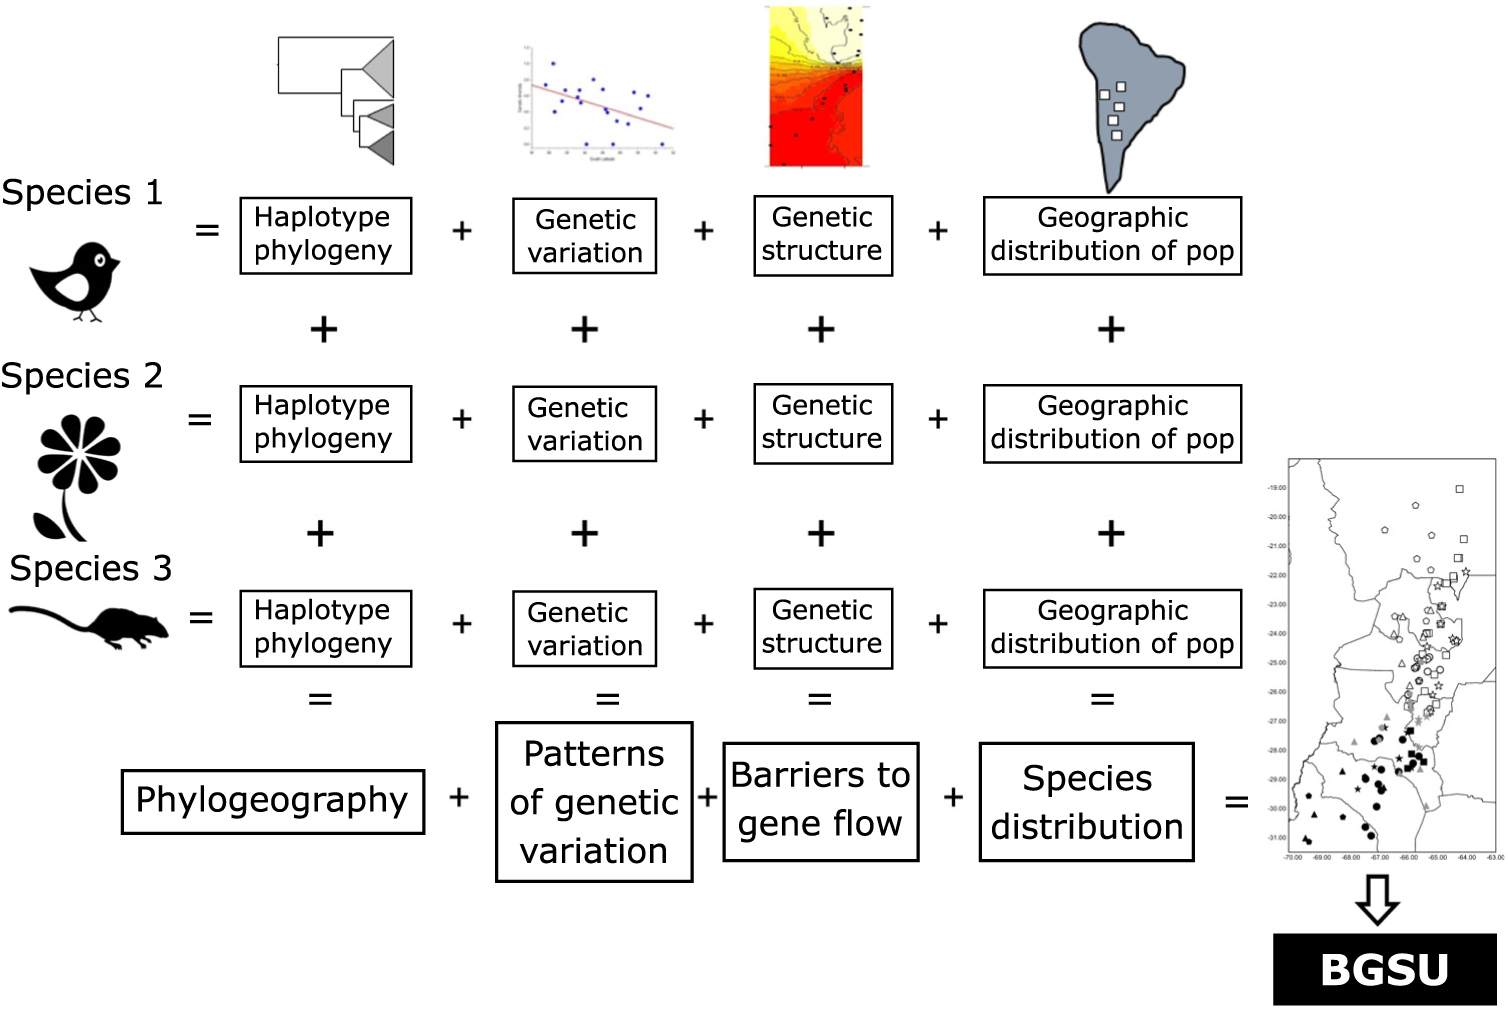
As phylogeography and biogeography can answer the same questions by approaching them through different methodologies, here we suggest using these two disciplines to extend Moritz’s (Reference Moritz1994) ESU concept to a more inclusive hierarchical level, scaling up ESUs to the biota. We propose to use the evidence of concordant barriers to gene flow of independent lineages (obtained from multivariate analysis based on bi-parental markers or divergences in haplotype phylogenetic trees) as evidence of processes that occur at the regional level that involve communities to delimit biogeographically significant units (BGSUs). We follow the hypothesis of Endler (Reference Endler1982) that all of the species within an area were subjected to the same series of vicariant events. The underlying argument for protecting these areas is based on the phylogeographical principle that persistent barriers to gene flow can result in significant genetic discontinuities (Avise Reference Avise2004). Therefore, the conservation implications of this concept are broader than those of ESUs, and they can contribute to identifying geographic areas with common evolutionary histories defined by multiple genetic lineages.
We developed the BGSU concept using the complex landscape of north-western Argentina (NWA), which is characterized by abrupt climate changes along numerous valleys and a complex mountain system that varies along latitude and longitude (Supplementary Fig. S1(a), S1(b), available online). The Cordillera de los Andes decreases in altitude from west to east, ending in the dry lowland Chaco. Along this elevation gradient, the climate changes from arid high-elevation Puna to cool rainforest in the Yungas highlands and to humid subtropical forest in Pedemont lowlands. The Yungas mountain slopes have an irregular surface, generating a discontinuous distribution of different habitats, thus having consequences for biodiversity and distributions of endemisms (Brown et al. Reference Brown, Grau, Lomáscolo and Gasparri2002). In northern Argentina, Bolivia and Chile, the Andes are extremely arid on the west face between 15°S and 27°S latitude. Parallel mountain ranges block moisture-bearing winds that originate in the Amazon basin and the Atlantic, leading to humid eastern flanks and aridity within the Puna–Altiplano Plateau in the west (Strecker et al. Reference Strecker, Alonso, Bookhagen, Carrapa, Hilley, Sobel and Trauth2007). Arid climates of the western Andes are recorded from the late Triassic (Clarke Reference Clarke2006). Thus, aridity-inducing factors during the Miocene uplift intensified the Andean rain shadow, which already existed 15 Ma ago (Hartley Reference Hartley2003). Arid conditions have prevailed in this area throughout geologic time. Nonetheless, intense climate oscillations, such as the northward displacement in weather patterns during the Pleistocene and increased westerly circulation at 28°S (Clarke Reference Clarke2006), probably had local effects on the biota. In addition, at the same latitude further east, a subtropical rainforest exists, stratified into at least three altitudinal levels as Yungas, Montane forest and Pedemont (Brown Reference Brown1990).
Material and methods
In order to identify BGSUs, we use previously published data to compare the genetic structures of phylogenetically independent lineages that coexist in the NWA region. A rigorous bibliographic search was performed looking for articles containing molecular information from taxa occurring in the region of interest using the Google Scholar and Scopus platforms. From an extensive list, we selected published population genetic articles from six species from Yungas, High Monte, Puna and Prepuna desert. The criteria used for the selection of appropriate species were the following: selected species were present at between 20°S and 30°S latitudes; selected species showed molecular evidence of a differentiation north and south of the barrier; and selected species were phylogenetically independent lineages. The selected species were four plants – Echinopsis terscheckii (Cactaceae), Munroa argentina (Poaceae), Podocarpus parlatorei (Podocarpaceae) and Tillandsia capillaris (Bromeliaceae) – and two animals – Hypsiboas andinus (Hylidae) and Thylamys pallidior (Didelphidae). These are hereafter named by genus. All of these species occur between latitudes 17°S and 31°S in different biomes, and localities from each species occurring in these latitudes were selected (Table 1, Supplementary Fig. S1). Published genetic data sources included isozymes and DNA sequences of the chloroplasts (cpDNA), mitochondria (mtDNA) and nucleus (nDNA). The sequences were used to identify haplogroups. This information was combined with levels of genetic diversity to provide geographically controlled information that may guide conservation and management actions. Geographic distributions of intraspecific polymorphisms in these markers were used to identify concordant patterns among distinct species. Latitude and longitude were obtained from the original articles for each species of studied populations, except for Hypsiboas, where the geographical location was subsequently georeferenced using Google Earth v. 7.3.2.5491.
Table 1. Population sample sizes, total number of individuals (in parenthesis) and markers used for each species, with references to each species. The population sample data for each species are in Supplementary Fig. S1.
For all species and outgroups, haplotype sequences were downloaded from GenBank (Supplementary Table S1). Sequences were aligned manually using Bioedit v. 7.1.3.0 (Hall Reference Hall1999); gaps were coded as binary characters using simple indel coding (Simmons & Ochoterena Reference Simmons and Ochoterena2000). Concatenated aligned sequences were: Echinopsis: trnH–psbA, trnM–trnD, trnS–trnG and ITS1–2 – 1938 bp; Hypsiboas: cytB – 340 bp; Munroa: rps16–trnK and ndhA – 1968 bp; Podocarpus: trnL–trnF – 330bp; Tillandsia: ycf1 – 4417 bp; and Thylamys: cytB – 1149 bp. We included as outgroups related species (Hypsiboas riojanus, Munroa andina, Podocarpus salignus and Tillandsia virescens) and a geographically distant individual from the northern distribution for Thylamys. For Echinopsis, the absence of data did not allow outgroups to be included. We included isozyme data to calculate cluster genetic distances for Podocarpus (Quiroga & Premoli Reference Quiroga and Premoli2007) and Echinopsis (Quipildor et al. Reference Quipildor, Mathiasen and Premoli2017).
Genetic diversity
We calculated geographic variation of within-population genetic parameters for those species consisting of more than one individual per population. Thus, we estimated haplotype diversity (H) for sequence data for Munroa (DNA regions rps16–trnK and ndhA) and Hypsiboas (DNA regions rps16–trnK, ndhA and cytB). In addition, we calculated expected heterozygosity (He) for Podocarpus and Echinopsis using information on isozymes. These parameters were calculated using Arlequin v. 3.5 (Excoffier & Lischer Reference Excoffier and Lischer2010) and GenAlEx v. 6.5 (Peakall & Smouse Reference Peakall and Smouse2006) for sequence and isozyme data, respectively. We performed regression analyses of H (for DNA sequence data) and He (for isozymes) with latitude using STATISTICA 7.0. We excluded Tillandsia and Thylamys from these analyses because the available data consisted only of one individual per population and genetic diversity parameters are population based.
Genetic structure
In order to deduce the geographic structure of genetic variants (haplotypes/allelic frequencies), we used DNA sequences of Echinopsis, Hypsiboas, Munroa, Tillandsia and Thylamys and isozyme information of Podocarpus and Echinopsis. These analyses were performed using Geneland in R prompt (Guillot et al. Reference Guillot, Renaud, Ledevin, Michaux and Claude2012). We analysed all of the species following the same setting: 100 000 iterations with 100 thinnings, with the number of populations varying from 1 to 5. This analysis identified a minimum number of clusters (K) that maximized the divergence between groups. Analysis of molecular variance (AMOVA) and estimates of divergence (FST) among genetic groups were performed in Arlequin v. 3.5 and GenAlEx v. 6.5 for sequence and isozyme data, respectively.
Phylogenetic analyses
Intraspecific phylogenies of each species using haplotypes for DNA sequences were used to identify the geographic associations of distinct lineages. The evolutionary substitution model using the Akaike information criterion (AIC) and the AICc correction as implemented in jModelTest v. 2.1.5 (Darriba et al. Reference Darriba, Taboada, Doallo and Posada2012) were performed for each set of markers and species. Phylogenetic trees for each species were constructed using a Yule tree prior in BEAST v. 1.7.2 (Drummond & Rambaut Reference Drummond and Rambaut2007). Runs were performed for 100 million generations (sampling every 10 000 generations and a tree annotator burn-in of 10 000 trees); subsequent trees were used to estimate Bayesian posterior probabilities in a consensus tree. Convergence of estimated parameters was verified using Tracer v. 1.6.1 (Rambaut & Drummond Reference Rambaut and Drummond2009). Multivariate cluster analysis by the unweighted pair group method with arithmetic mean (UPGMA) using isozyme data was performed for Podocarpus and Echinopsis based on the modified Rogers’ genetic distance (Wright Reference Wright1978).
Monophyletic clades found by phylogenetic trees and/or UPGMA clusters of each species depicting latitudinal disjunction and the geographical location of studied populations were assembled on a map using QGIS 2.10 Pisa (QGIS Development Team 2012). We used information from the haplotype phylograms and Geneland results to assign each population to a region (north, centre and south to K = 3; or north and south to K = 2). We identified different groups within a given geographic area that are flanked by a barrier to gene flow. The superposition of the group delimited for each species based on the grouping of haplotypes and/or allele frequencies was used to evaluate the concordance among species and to identify the barriers producing population disjunctions in NWA.
Results
Genetic diversity
Parameters of genetic diversity (H for Hypsiboas and Munroa from DNA information and He for Podocarpus and Echinopsis from isozyme information) increased in a concordant fashion towards the south in Hypsiboas (β = 0.079; R2 = 0.19; p < 0.0368), Echinopsis (β = 0.025; R2 = 0.45; p < 0.0003) and Podocarpus (β = 0.49; R2 = 0.55; p < 0.0001). However, Munroa presented the opposite pattern (β = –0.062; R2 = 0.222; p < 0.0357), with higher levels of genetic diversity towards the north of the distribution (Supplementary Fig. S2(a–d)).
Genetic structure
The geographic structure of multiple populations’ and species’ genetic data inferred using Geneland mainly yielded two patterns. The genetic structure of Munroa, Hypsiboas and Thylamys consisted of K = 3 groups produced mainly by the presence of two barriers located at 25–26°S and 27–28°S. Groups were designated as north, central and south, and populations at the central location were derived either from the northern or southern group (Fig. 1(a–c)). Populations of Echinopsis, Tillandsia and Podocarpus were clustered in K = 2 groups, designated as north and south, which were separated by a barrier located at 27°S (Fig. 1(d–f)). In the case of Echinopsis, one different haplotype characterized populations on each side of this barrier, and this genetic structure was concordant for nuclear internal transcribed spacer and chloroplast DNA sequences. In Podocarpus, two isozyme alleles and one chloroplast DNA haplotype were detected exclusively in southern populations (at 27°S). For Tillandsia, three haplotypes characterized northern populations and two haplotypes characterized southern populations. The AMOVA tests for each species and divergence among geographic groups (FST) were all statistically significant (Supplementary Table S2).
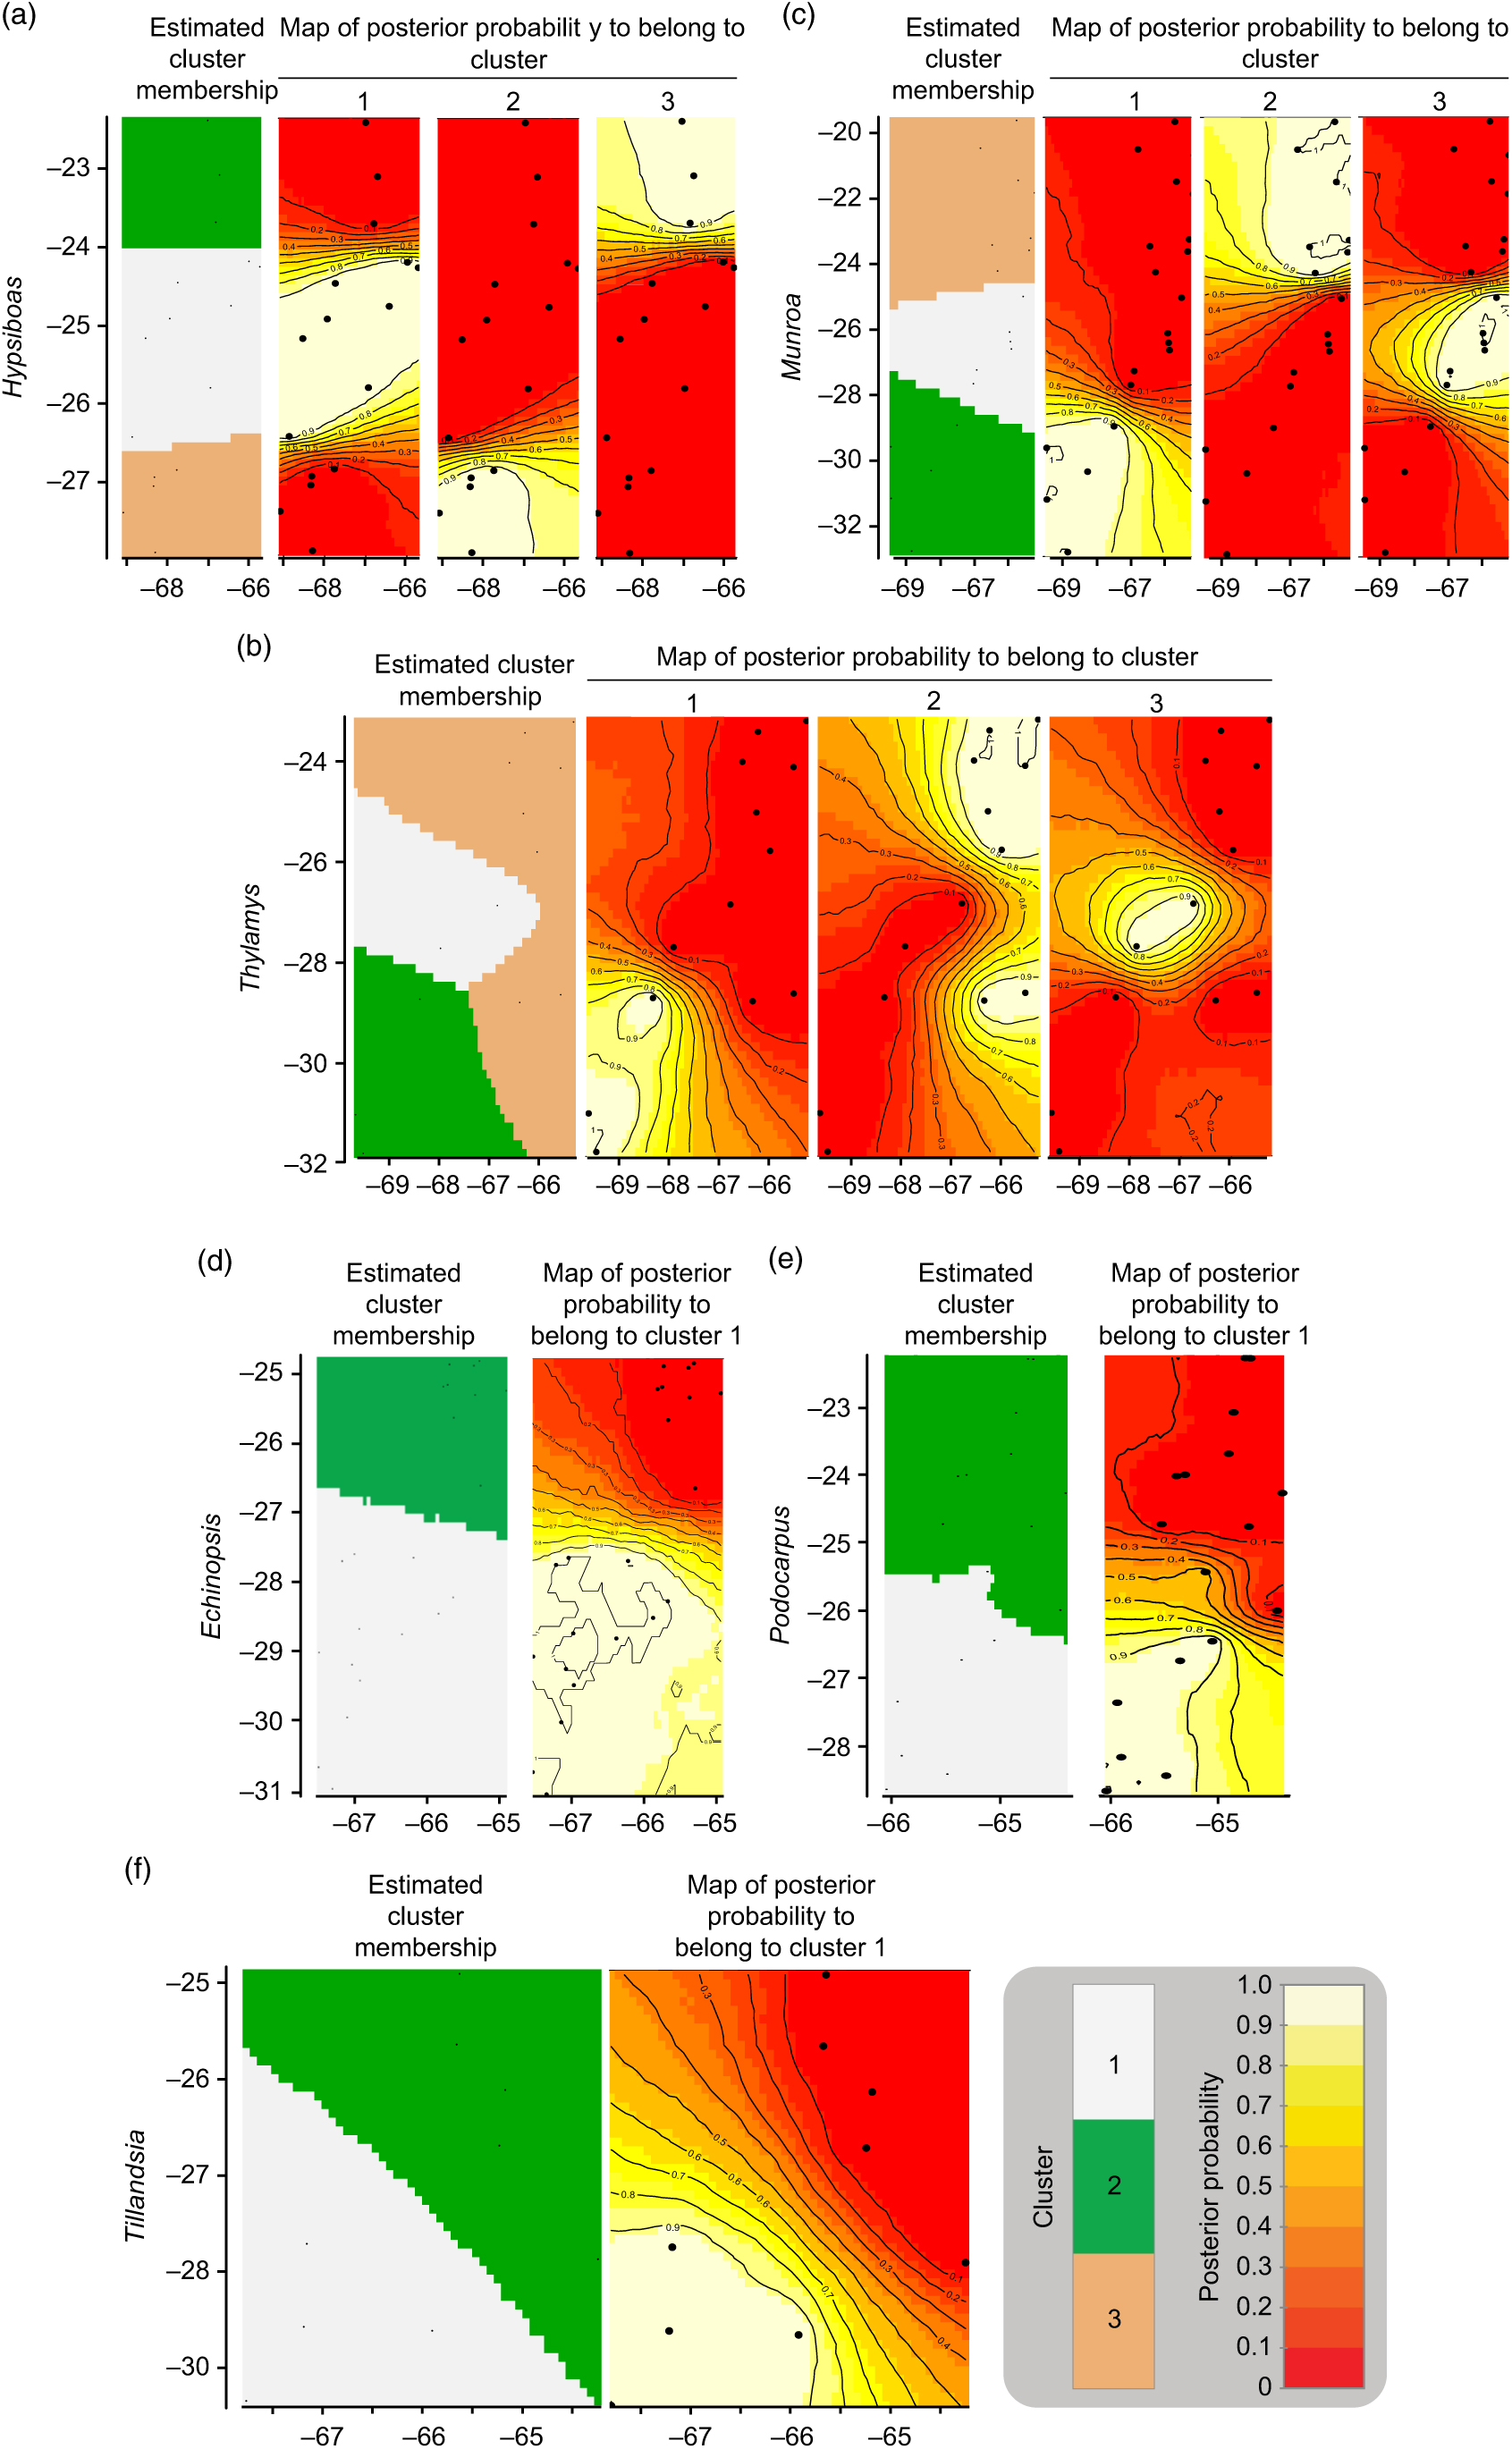
Fig. 1. Genetic structure by longitude (x-axis) and latitude (y-axis) yielded by Geneland analysis for each species. (a) Hypsiboas; (b) Thylamys; (c) Munroa; (d) Echinopsis; (e) Tillandsia; and (f) Podocarpus.
Phylogenetic analyses of haplotypes
The phylogeny of haplotypes was congruent with geography and yielded latitudinally structured clades. Haplotypes of Tillandsia and Echinopsis were segregated into two clades delimiting the north and south regions (Supplementary Fig. S3(a), S3(c)). The same pattern was supported by the cluster analysis using genetic distances based on isozymes for Echinopsis (data from Quipildor et al. Reference Quipildor, Mathiasen and Premoli2017). For other species, the genetic structure consisted of three regions (named north, centre and south): Thylamys and Hypsiboas showed a centre region more related to the north group (Supplementary Fig. S3(d), S3(f)), while populations of Munroa of the centre region were more similar to the south region (Supplementary Fig. S3(b)). Although the phylogram based on chloroplast DNA haplotypes of Podocarpus showed no geographic differentiation between regions (data from Quiroga et al. Reference Quiroga, Pacheco, Malizia and Premoli2012), a significant north–south genetic structure was yielded by the cluster analysis based on genetic distances using isozymes (Supplementary Fig. S3(e)) and Geneland analysis (Fig. 1(e)). The combination of the grouping of haplotypes into two or three genetic regions and the population coordinates for all species resulted in different distribution maps of genetic variants. For taxa producing two clades, such as Echinopsis, Tillandsia and Podocarpus, the north variants were located north of 25–26°S and the south ones were south of 27–28°S (Fig. 2(a)), while for those species producing three groups, the centre region was located at 25–28°S for Munroa, Hypsiboas and Thylamys (Fig. 2(b)). All analysed species shared a major discontinuity at 27–28°S latitude.
Fig. 2. Distribution maps of haplogroups in (a) two and (b) three sectors. Hs, Hc and Hn correspond to south, central and north haplogroups. Each species is represented by a different symbol. Different shades depict haplogroups within each region: black = south; grey = central; white = north.
Discussion
The geography, ecological and evolutionary processes acting within the study area have moulded the gene pool of the co-distributed species in a concordant fashion. Such events affected studied species independently of their phylogenetic and life history characteristics. We propose that the identification of concordant barriers to gene flow in several independent lineages provides evidence of common major landscape-level processes acting on communities (Fig. 3). These impediments are conventionally recognized as being reflected in concentrations of distributional limits for many species (Avise et al. Reference Avise, Arnold, Ball, Bermingham, Lamb, Neigel, Reeb and Saunders1987). Accordingly, we suggest that groups of populations of unrelated and phylogenetically independent taxa share a given area within a biome delimiting BGSUs.

Fig. 3. Diagram representing the information systematically processed from several lineages to construct the biogeographically significant units (BGSUs).
Although our analysis was based on a small number of phylogenetically independent species with contrasting life histories and reproductive strategies, the genetic data were similarly structured (Figs 1, 2; Supplementary Fig. S2). On the one hand, we analysed two animals with wide distributions: a frog that is dependent on humidity for reproduction and grows in deeply incised river valleys that penetrate the Andes, spanning from humid Montane forests to Montane grasslands (Koscinski et al. Reference Koscinski, Handford, Tubaro, Sharp and Lougheed2008); and a marsupial with a broad distribution in Andean Montane habitat (elevations <3900 m) (Braun et al. Reference Braun, Van Den Bussche, Morton and Mares2005, Giarla et al. Reference Giarla, Voss and Jansa2014). The four plant species have wide distributions, yet are ecologically different: a cold-tolerant, high-elevation conifer (Quiroga & Premoli Reference Quiroga and Premoli2007); a specialized cactus that inhabits ecotonal areas between seasonally dry forests, Monte and Puna that withstands water deficit and is dispersed by ants and birds (Quipildor et al. Reference Quipildor, Mathiasen and Premoli2017); an epiphyte bromeliad with high seed dispersal by wind that grows in various environments, including vertical granite walls at high elevation, semi-arid forests in valleys and humid mountain forests on various hosts (Castello et al. Reference Castello, Barfuss, Till, Galetto and Chiapella2016); and an annual grass that inhabits open plains and mountains from mid-elevations (1000 m) to high elevations (4200 m) on alluvial and sandy–stony soils along seasonally dry creeks and rivers and grows only in riverbeds in areas with very low precipitation (Amarilla et al. Reference Amarilla, Chiapella, Sosa, Moreno and Anton2015). Thus, the species used in this combined analysis do not share ecological tolerances, phylogenetic evolutionary histories or unique biomes (Supplementary Fig. S1). The genetic discontinuity in NWA at 26–27°S had a central zone that was either recently colonized from one of the two sectors or could be a secondary contact area between two divergent gene lines for three of the six studied species. Nevertheless, this disjunction was estimated for different periods of time. The divergence times among haplotypes using indirect methods with fossil calibration and molecular clocks were estimated to be 2.2–3.4 Ma in Munroa (Amarilla et al. Reference Amarilla, Chiapella, Sosa, Moreno and Anton2015), 1.0–2.0 Ma in Hypsiboas (Koscinski et al. Reference Koscinski, Handford, Tubaro, Sharp and Lougheed2008) and 1.4–2.4 Ma in Thylamys (Giarla et al. Reference Giarla, Voss and Jansa2014). Differences in divergence times may be due to species-specific factors that had impacted on each species’ gene pool, including abiotic events such as climate and tectonism or biotic processes; for example, reproduction and survival strategies that determine barriers to gene flow and may vary over time. Mountain uplift is likely to influence climate, creating rain shadows that may have a synergistic effect on species’ distributions (e.g., Quipildor et al. Reference Quipildor, Kitzberger, Ortega-Baes, Quiroga and Premoli2018). In addition, tectonic forces may affect sea-level changes that could impact lineage divergence (e.g., Acosta et al. Reference Acosta, Mathiasen and Premoli2014). One or a combination of such forces could mould population size and gene flow, resulting in spatially congruent lineage divergence, which seems to be asynchronous for distinct taxa; a similar pattern was shown using multispecies analyses for Mesoamerican taxa by Ornelas et al. (Reference Ornelas, Sosa and Soltis2013).
Biogeographical history
Other concordant barriers to gene flow or species distributions have been identified in South America in Amazonia (Aleixo Reference Aleixo2004, Antonelli et al. Reference Antonelli, Quijada-Mascareñas, Crawford, Bates, Velazco, Wüster, Hoorn and Wesselingh2010), Huancabamba in Peru (Vargas et al. Reference Vargas, Ortiz and Simpson2017), Patagonia in Argentina and Chile (Premoli et al. Reference Premoli, Mathiaen, Acosta and Ramos2011, Sersic et al. Reference Sersic, Cosacov and Cocucci2011) and Mata Atlantica in Brazil (Turchetto-Zolet et al. Reference Turchetto-Zolet, Salgueiro and Turchetto2016). Although based on limited information, the present study identifies the first barrier for NWA. Emerging concordant phylogeographical patterns may indicate shared evolutionary histories (Manel et al. Reference Manel, Gugerli, Thuiller, Alvarez, Legendre, Holderegger, Gielly and Taberlet2012). Such evidence is growing in association with new mathematical developments (e.g., hierarchical approximate Bayesian computation), the capacity to process multilocus datasets (Huang et al., Reference Huang, Takebayashi, Qi and Hickerson2011) and neutral and also adaptive loci that enable Avise et al.’s (Reference Avise, Arnold, Ball, Bermingham, Lamb, Neigel, Reeb and Saunders1987) assumptions to be corroborated. Considering the permanent development of new molecular data tools and their subsequent analysis, the evidence of concordant phylogeographical patterns should be consistent and robust. Avise (Reference Avise2009) also postulated the concept of multilocus concordance. Therefore, the geographic/molecular evidence to be considered in a BGSU analysis must be consistent, strong and independent of the molecular marker (regardless of whether it is neutral or adaptive), lineage and geographic location. Nevertheless, because divergent evolutionary processes may occur in distinct areas within a given region such that the different units may not be under the same selection forces, adaptive variation may yield geographic patterns that are discordant with neutral markers, which deserve consideration.
Biogeography, phylogeography and current ecological processes can contribute to the conservation of biodiversity. BGSUs thus constitute delimited areas for the biota that share ecological and evolutionary events (Fig. 3). A barrier resulting from the synergistic effects of orography and climate may operate on the genetic structure of different species building up concordant phylogeographical patterns. The presence of the Sierra de Aconquija located at ≤27°S in NWA may in part be responsible for the differences between northern and southern groups of populations of distinct species (Quipildor et al. Reference Quipildor, Kitzberger, Ortega-Baes, Quiroga and Premoli2018). The Sierra de Aconquija constitutes an effective orographic barrier to the moisture flux coming from the Atlantic Ocean: the eastern flank receives much more precipitation (>2 m year–1) than the western slope (Sobel & Strecker Reference Sobel and Strecker2003). The continual south central Andes uplift (24−27°S and 64−69°W) between 3.4 and 2.4 Ma ago generated great aridity on western slopes, which highlights the role of tectonics in the evolution of climate in this part of the Andes (Coutand et al. Reference Coutand, Carrapa, Deeken, Schmitt, Sobel and Strecker2006). Genetic patterns observed in different lineages may be due to geological events, which could be reinforced by climatic effects.
Numerous studies highlighted the importance of the contribution of population genetics, phylogeography and the spatially explicit identification of areas where evolutionary processes occur to the design of conservation actions (Carvalho et al. Reference Carvalho, Brito, Crespo and Possingham2011, Hanson et al. Reference Hanson, Rhodes, Riginos and Fuller2017, Richardson Reference Richardson2012). In addition, conservation planning at the regional level has been recently recognized as a priority (Baldwin et al. Reference Baldwin, Trombulak, Leonard, Noss, Hilty, Possingham, Sacarlett and Anderson2018), and tools are needed to help implement landscape conservation. Other tools that can be added to improve BGSU analysis are niche models, as suggested by Smith et al. (Reference Smith, Godsoe, Rodríguez-Sánchez, Wang and Warren2019), incorporating population-level differentiation (e.g., by means of molecular variants that may provide information on ecotypes and local adaptations). Considering species as single, undifferentiated entities may lead to incorrect range predictions and therefore misplaced conservation efforts (Hällfors et al. Reference Hällfors, Liao and Dzurisin2016). A constraint is that we often do not know the degree to which populations are geographically structured. The approach proposed here for the delimitation of BGSUs seeks to achieve this knowledge. While the use of ESUs in conservation is relevant in terms of the evolutionary potential of a given species, BGSUs provide a multispecies perspective that may be more in accordance with the community-level responses needed under rapid climate change. Whereas one of the main objectives in conservation is to develop plans for emblematic species or lineages with unique genetic architectures, we hereby suggest that we should also focus on protecting priority areas delimited by natural, persistent barriers that operate through time and impact entire biotas.
Environmental conservation actions for NWA
We demonstrated a concordant genetic pattern for the NWA region, where a zone of elevated endemism was reported. A large number of endemic plant species was detected for the transition zone between the High Monte and the Southern Andean Yungas between 26–27°S and ≤28°S (fig. 2 in Godoy-Bürki et al. Reference Godoy-Bürki, Ortega-Baes, Sajama and Aagesen2014). Rodent species show a concentration of Montane endemics at 2500 m altitude in the southern Yungas from 26°S to 27°30′S (Ferro Reference Ferro2013). A dataset of 805 species of plants and animals identified a centre of endemism between latitudes 25º50′S and 28°S (Szumik et al. Reference Szumik, Aagesen and Casagranda2012). Endemic species are indicators of biodiversity, and help to define priority conservation areas biogeographically (Morrone Reference Morrone1994). However, the evolutionary and ecological processes responsible for producing centres of endemism are complex and reflect interacting aspects of climatic, geological and biogeographical history (Harrison & Noss Reference Harrison and Noss2017) that can differentially impact each species’ gene pool in an individualistic fashion. For the species studied here, genetic diversity may result in discordant latitudinal patterns (e.g., Munroa decreasing while Echinopsis, Hypsiboas and Podocarpus are increasing towards the south; Supplementary Fig. S2), while also showing the same generalized barriers to gene flow.
The evidence presented here and elsewhere (e.g., Brown et al. Reference Brown, Grau, Lomáscolo and Gasparri2002, Halloy et al. Reference Halloy, Gonzalez and Grau1994) suggests that the Upper Bermejo River Basin and the Aconquija range are important areas for conservation because of their diversity, endemism and probable long-term stability. Important conservation efforts in the Yungas have resulted in the creation of 15 protected areas under national or provincial management. Nevertheless, the area located between the southern Yungas and the arid Monte and Chaco in Catamarca Province is not included in any protected area. Thus, concrete actions should be promoted in order to conserve this contact zone of two different phytoregions with high genetic diversity and many endemic species.
Based on the present genetic evidence and that on endemisms (Ferro Reference Ferro2013, Godoy-Bürki et al. Reference Godoy-Bürki, Ortega-Baes, Sajama and Aagesen2014, Szumik et al. Reference Szumik, Aagesen and Casagranda2012), we suggest that the area from 26°S to 27°S should be urgently included in conservation and management plans for flora and fauna in NWA. In particular, c. 27°S is the southern geographical limit for subtropical species of the Yungas, such as Podocarpus parlatorei. This is the only conifer that characterizes Montane forests, hosting a significant number of epiphytic species (Brown Reference Brown1990) and generating microclimates, which make it a keystone species for multiple lineages. New models of climatic change predict that the southern region of Yungas and the boundary area between drylands (Monte and Puna) and Yungas will suffer changes not only in terms of temperature, but also in terms of precipitation, which will affect the distribution of plant species such as P. parlatorei (Quiroga et al. Reference Quiroga, Premoli and Kitzberger2018) and others (Godoy-Bürki Reference Godoy-Bürki2016). An important centre of endemism or genetically valuable populations could be lost (Quiroga et al. Reference Quiroga, Premoli and Kitzberger2018) in the near future or, in the best of cases, it might shift (e.g. Godoy-Bürki Reference Godoy-Bürki2016).
Conclusion
We propose that molecular evidence from phylogenetically independent taxa helps to delimit BGSUs that might be used to develop conservation actions within a biogeographic area. Our analysis, although based on few taxa yet using a wide diversity of lineages with broad distributions, may guide future studies to seek concordant genetic patterns that can contribute to the conservation at the community at the regional level. Concordant information from phylogenetically independent taxa could contribute to the identification of barriers to gene flow in any region of the world. This will allow areas to be identified where evolutionary processes operate independently and where potential sources of the evolutionary novelties of each lineage should be protected.
Supplementary material
To view supplementary material for this article, please visit https://doi.org/10.1017/S0376892919000286.
Acknowledgements
We thank LD Amarilla, TC Giarla and D Koscinski for their collaboration by sending us additional information or explanations in addition to the data published in the original works. We thank E Zattara for figure assistance. All authors are members of CONICET (Consejo Nacional del Investigaciones Científicas y Técnicas), Argentina.
Financial support
Financial support was provided by project FONCyT PICT 2015-1563.
Conflict of interest
None.
Ethical standards
None.