


Vitamin D belongs to the group of lipophilic vitamins and accumulates in the adipose tissue of rats, pigs and humans( Reference Brouwer, Beek and Ferwerda 1 – Reference Didriksen, Burild and Jakobsen 3 ). Serum or plasma 25-hydroxyvitamin D is considered the best biomarker of vitamin D status( Reference Jones 4 ), but its correlation with the tissue concentration of vitamin D is unknown( Reference Heaney, Armas and Shary 5 ).
Vitamin D exists in two major forms: vitamin D2 and vitamin D3. Vitamin D3 is synthesised in the skin after UV exposure( Reference Holick and Chen 6 ) and is naturally found as vitamin D3 and 25-hydroxyvitamin D3 (25(OH)D3) in products of animal origin, e.g. meat and eggs( Reference Mattila, Piironen and Uusi-Rauva 7 , Reference Mattila, Lehikoinen and Kiiskinen 8 ). Within the European Union, vitamin D3 is the main vitamin D source in animal feed, but recently, 25(OH)D3 has been approved for supplementary use in pigs and hens. The maximum permitted level of vitamin D sources is 50 µg/kg pig feed( 9 , 10 ).
Comparing the serum and plasma 25(OH)D3 levels after the administration of either of the two sources of vitamin D3, oral 25(OH)D3 has been found to be more potent than oral vitamin D3, although the data are inconsistent. In humans, oral 25(OH)D3 is 2- to 5-fold more potent than oral vitamin D3 ( Reference Cashman, Seamans and Lucey 11 , Reference Jetter, Egli and Dawson-Hughes 12 ); and in pigs, oral 25(OH)D3 is 1- to 3-fold more potent than oral vitamin D3 ( Reference Jakobsen, Maribo and Bysted 2 , Reference Lauridsen, Halekoh and Larsen 13 – Reference Höller, Quintana and Gössl 15 ).
For humans 25(OH)D3 is a significant compound for the dietary intake of vitamin D( Reference Ovesen, Brot and Jakobsen 16 ). However, the vitamin D source, either vitamin D3 or 25(OH)D3, used in pig feed determines distribution of the two vitamin D metabolites in the fat in slaughter pigs fed the same feed throughout their lives( Reference Jakobsen, Maribo and Bysted 2 ). Moreover, the amount of vitamin D3 stored depends on the fat content of the given tissue( Reference Jakobsen, Maribo and Bysted 2 , Reference Clausen, Jakobsen and Leth 17 ). However, information regarding the difference between the distribution of oral 25(OH)D3 and oral vitamin D3 stored in the body is sparse. Since 25(OH)D3 is more polar than vitamin D3 and the affinity of 25(OH)D3 for vitamin D-binding protein is more than 500 times stronger than that of vitamin D3, more vitamin D3 is assumed to be present in its free form, which will allow it to diffuse directly into adjacent tissues( Reference Schuster 18 ).
The aims of this study were to investigate the concentrations of vitamin D3 and 25(OH)D3 in pork meat (muscle, adipose and liver tissue) from pigs that were fed different doses of vitamin D3 or 25(OH)D3, and to assess whether serum 25(OH)D3 is a biomarker for the tissue concentration of vitamin D3 and 25(OH)D3.
Materials and methods
Animal experiment
Details of the animal study including diet composition can be obtained in Lauridsen et al.( Reference Lauridsen, Halekoh and Larsen 13 ). In brief, 160 prepubertal gilts ((Danish Landrace × Danish Yorkshire) and Duroc; body weight 156 (se = 7·1) kg) were included in the main pig study investigating the nutritional benefits of vitamin D for reproducing female pigs, with special emphasis on bioefficiency of the two vitamin D sources in terms of bioavailability, early reproduction, bone status markers, and transfer of vitamin D to the progeny( Reference Lauridsen, Halekoh and Larsen 13 ). The animals were randomly assigned to dietary treatments containing four concentrations (5, 20, 35 and 50 µg/kg feed) of one of the two different vitamin D sources: vitamin D3 and 25(OH)D3. A subpopulation of four animals from each of the eight dietary treatments, except three from the group receiving 50 µg vitamin D3 and five from the group receiving 35 µg 25(OH)D3/kg (total n = 32 pigs, body weight = 186 kg), was randomly selected from the population of 160 gilts (body weight 186 (se = 7·2) kg at slaughter). The basal diet consisted of barley (75 %), soyabean meal (8 %), wheat bran (5 %), green grass (5 %), molasses (3 %), animal fat (2 %), and vitamins and minerals (2 %). The analysed concentrations in the diets were very close to the formulated amounts( Reference Lauridsen, Halekoh and Larsen 13 ). The study was carried out at Aarhus University, Foulum, Denmark, and the pigs were housed indoors with an artificial lighting (no UVB) regimen 12 h per d. The pigs were killed after 49 d on the experimental diets.
Sampling
Blood samples obtained at slaughter from the vena jugularis were collected in Vacutainer tubes containing no additives and processed to serum, which was immediately stored at −80°C until analysis. After the carcasses were eviscerated, samples of the liver, longisimus dorsi (loin), and of the psoas major (red muscle tissue) were obtained. Adipose tissue and muscle tissue (white muscle tissue) were carefully dissected from the loin. All samples were stored in plastic bags at −20°C until analysis. Before analysis each sample was slowly thawed and homogenised for 2 min (1094 Homogenizer; Tecator).
Analysis of 25-hydroxyvitamin D3 and vitamin D3 in tissue and 25-hydroxyvitamin D3 in serum and tissues
The tissue samples were analysed by a previous published method using HPLC( Reference Jakobsen, Maribo and Bysted 2 , Reference Jakobsen, Clausen and Leth 19 ). In short, the internal standard of vitamin D2 and 25(OH)D2 were added to the test sample. The samples were saponified, liquid/liquid extracted, cleaned-up in a solid-phase step, followed by a preparative normal-phase HPLC step. For the final separation, detection and quantification reversed-phase chromatography coupled to a UV detector and a diode array detector (DAD) was used. The analyses were performed accredited according to ISO17025( 20 ), and quality control included participation in proficiency testing (FAPAS; www.fapas.com). Duplicate analyses were used to assess precision, which for samples with contents of vitamin D3 and 25(OH)D3 above 1 µg/kg showed a between-day precision of ≤5·6 and ≤5·1 %, respectively. For samples with contents below 1 µg/kg the between-day precision was ≤0·06 µg/kg for both compounds.
Serum was analysed for 25(OH)D3 by HPLC equipped with a DAD and a UV detector for detection and quantification as described in detail elsewhere( Reference Jakobsen, Bysted and Andersen 21 ), showing a between-day precision of ≤5·7 % from duplicate analyses. Participation in the Vitamin D External Quality Assessment Scheme (DEQAS; Charing Cross Hospital, London, UK) ensured trueness of the results. Samples of liver and red muscles were analysed for the groups fed 5 or 50 µg/kg feed only, due to economic resources.
Analysis of fat content in muscle tissue
The content of fat in the muscle tissue was determined by the gravimetric method by a modified Schmid–Bondzynski–Ratslaff (SBR) method( 22 ). In short, the sample was boiled with hydrochloric acid followed by the addition of ethanol and extraction of the lipids with diethyl ether–petroleum ether (1:1, v/v). After evaporation of the solvent, the fat was weighed. Due to a limited amount of sample of the red muscle, fat content was only determined on samples from pigs receiving 20 or 35 µg/kg feed.
Statistics
The effects of vitamin D3 form (vitamin D3, 25(OH)D3) and level in feed (5, 20, 35, 50 µg/kg) on the content of 25(OH)D3 and vitamin D3 in tissues were analysed by the regression model:
 $$\eqalign{ y_{ijk} & = \;{\rm \beta} _{0,i} + \;{\rm \beta} _1\;{\rm form}_{ij} + {\rm \beta} _2\;\hbox{feeding level}_{ik} \cr & \quad + \;{\rm \beta} _3{(\hbox{feeding level}{\times}{\rm form})_{ijk}},}$$
where ‘y’ is the response variable for eight different types of measurements (i = 1,2,…,8) of vitamin D, i.e. the combination of measured vitamin D3 or 25(OH)D3 in four different meat cuts: adipose tissue, white muscle tissue, red muscle tissue, and liver. The index ‘j’ (= 1, 2) is used for the two forms of vitamin D, vitamin D3 and 25(OH)D3, in the feed. For each type of response variable (i) β0 refers to the intercept, β1j is a categorical parameter, and β2and β3j are regressor parameters.
β0 and β1j represent the cut offs and β2 and β3j represent the slopes of the regression lines for feeding level of vitamin D3 and 25(OH)D3, respectively. The two regression lines for each response variable were analysed simultaneously. This way not only the power of the test was increased by increased df, the simultaneously estimation also served the purpose of being able to determine whether the two cut-offs (β1j ) were significantly different from each other, and to determine whether the slopes (β3j ) were significantly different from each other.
The associations between serum 25(OH)D3, dietary vitamin D form, and vitamin D3 and 25(OH)D3 in tissues were investigated by a similar type of model as shown above (equation 1), except that the explanatory variable ‘feeding level’ was replaced by ‘serum’.
In the dataset one outlier was detected using the methods described by Cook & Weisberg( Reference Cook and Weisberg 23 ). Results in the tables and figures are given as means with their standard errors. All data were analysed using proc glm, SAS version 9.3 (SAS Institute), and a significant level of α = 5 % was used as cut-off value for the P values. For plotting, the program Prism 5 for Windows (GraphPad Software) was used.
Ethics statement
The experiment complied with the guidelines of the Danish Ministry of Justice with respect to animal experimentation and care of animals under study.
Results
All results (means with their standard errors) of the content of vitamin D3 and 25(OH)D3 in meat cuts, i.e. adipose tissue, white muscle tissue, red muscle tissue and liver, and serum 25(OH)D3 are shown in Tables 1 and 2. Overall, the content of 25(OH)D3 in serum was between 8·7 and 67·1 ng/ml. In the tissues the content of 25(OH)D3 was between 0·37 and 11·9 µg/kg, while the content of vitamin D3 was between 0·10 and 8·41 µg/kg.
Table 1. Serum level and content of vitamin D3 and 25-hydroxyvitamin D3 (25(OH)D3) in adipose tissue (subcutaneous fat from loin), white muscle tissue (lean meat from loin), red muscle tissue (chain muscle) and in the liver following feeding for 49 d with 5, 20, 35 and 50 µg vitamin D3/kg feed (n 4, 4, 4, 3, respectively)
(Mean values with their standard errors)
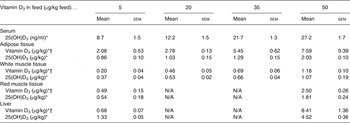
N/A, not applicable.
* Increasing doses of vitamin D3 in the feed increased the content of vitamin D3 and 25(OH)D3 (P < 0·001).
† The vitamin D3 content was significantly higher (P < 0·001) for pigs fed vitamin D3 compared with 25(OH)D3 in the feed (data shown in Table 2).
Table 2. Serum level and content of vitamin D3 and 25-hydroxyvitamin D3 (25(OH)D3) in adipose tissue (subcutaneous fat from loin), white muscle tissue (lean meat from loin), red muscle tissue (chain muscle) and in the liver following feeding for 49 d with 5, 20, 35 and 50 µg of 25(OH)D3/kg of feed (n 4, 4, 5, 4, respectively)
(Mean values with their standard errors)
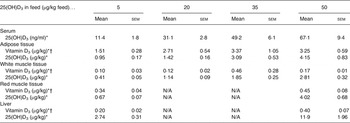
N/A, not applicable.
* Increasing doses of 25(OH)D3 in the feed increased the content of vitamin D3 and 25(OH)D3 (P < 0·001).
† The 25(OH)D3 content was significantly higher (P < 0·002) for pigs fed 25(OH)D3 compared with vitamin D3 in the feed (data shown in Table 1).
The content of fat in red muscle tissue and in white muscle tissues was 3·7 (sem 1·2) % (n = 32) and 2·1 (sem 0·7) % (n = 16), respectively.
Overall, for all eight types of response variables the increasing doses of either vitamin D3 or 25(OH)D3 in feed increased the content of 25(OH)D3 and vitamin D3 in all tissues (β2: P < 0·001). The vitamin D3 content in all analysed tissues was significantly (β3: P < 0·001) higher for pigs fed vitamin D3, whereas the tissue content of 25(OH)D3 was significantly higher (β3: P < 0·002) in all tissues when 25(OH)D3 was provided in the feed. ‘Dose 0’ is a theoretical result for vitamin D in tissues if concentration of vitamin D in the feed is zero. The parameter β1 was not significant for any of the analyses meaning that for ‘dose 0’ the content of vitamin D3 and 25(OH)D3 in all tissues was the same for the two regression lines (Figs 1(a)–(d)). The baseline values for the two groups are thus the same.
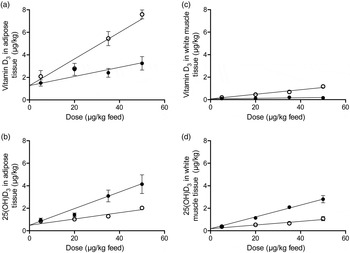
Fig. 1. Vitamin D3 (○) (a and c) and 25-hydroxyvitamin D3 (25(OH)D3; ●) (b and d) in adipose tissue and white muscle tissue plotted against content of vitamin D3 or 25(OH)D3 in feed. Values are means, with standard errors represented by vertical bars.
As shown in Figs 2(a) and (b), the content of vitamin D3 in adipose and white muscle tissues was linearly correlated with serum 25(OH)D3 (β2: P < 0·001). Furthermore, the concentration was dependent on the dietary vitamin D3 form, as the interaction term was significant (β3: P < 0·001).
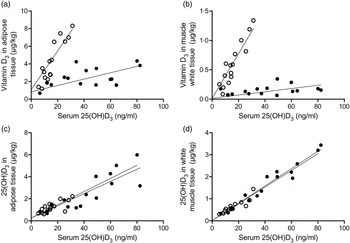
Fig. 2. Content of vitamin D3 in adipose and white muscle tissues v. serum 25-hydroxyvitamin D3 (25(OH)D3) (a and b) were linearly correlated (P < 0·001), and concentration dependent on the dietary vitamin D3 form (P < 0·001). Content of 25(OH)D3 in adipose and muscle tissues v. serum 25(OH)D3 (c and d) for pigs fed either vitamin D3 or 25(OH)D3 were linearly correlated (P < 0·001), but concentration independent on the dietary vitamin D3 form (P > 0·72). (○), Vitamin D3 in feed; (●), 25(OH)D3 in feed.
The content of 25(OH)D3 in adipose and white muscle tissues (Figs 2(c) and (d)) was also linearly correlated with serum 25(OH)D3 (β2: P < 0·001). The correlation coefficient was, however, independent of the dietary vitamin D3 form (β3: P > 0·72).
Discussion
In the present study, we compared the effects of different levels of 25(OH)D3 and vitamin D3 in pig feed on the concentrations of both 25(OH)D3 and vitamin D3 in different pig tissues. Adipose, liver and muscle tissues were chosen for the analysis as representative of the major tissues in the pig that are consumed by humans.
Jakobsen et al.( Reference Jakobsen, Maribo and Bysted 2 ) found that vitamin D3 and 25(OH)D3 levels depend on the fat content. In the present study we found a higher content of vitamin D in adipose tissue than in muscle tissue. We presume that the difference between red muscle tissue compared with white muscle tissue is due to the difference in fat content.
Other studies in pigs have investigated a single feeding level of each of the two vitamin D metabolites on their tissue contents( Reference Jakobsen, Maribo and Bysted 2 , Reference Höller, Quintana and Gössl 15 ). Comparing absolute levels obtained in different studies has to be done with caution, due to differences in study design, experimental animals and analytical methods.
The pigs fed 50 µg vitamin D3/kg feed had vitamin D3 levels of 7·59 µg/kg in adipose tissue (subcutaneous fat) and 1·18 µg/kg in white muscle tissue (lean meat). These levels are in the same range as pigs fed 24 µg vitamin D3/kg feed for 70 d resulting in 7·47 µg vitamin D3/kg in adipose tissue and 1·11 µg vitamin D3/kg in white muscle tissue, respectively( Reference Jakobsen, Maribo and Bysted 2 ). The corresponding concentrations of 25(OH)D3 in subcutaneous fat and lean meat we found to be at 2·03 and 1·07 µg/kg, respectively, were also similar to previously found( Reference Jakobsen, Maribo and Bysted 2 ). Although the amount of vitamin D3 in the feed of the two studies was different, 50 µg/kg feed and 24 µg/kg feed, the levels of vitamin D3 and 25(OH)D3 in the tissues were similar. Another study also provided 50 µg vitamin D3/kg feed to slaughter pigs, and reported no tissue content of 25(OH)D3 ( Reference Höller, Quintana and Gössl 15 ); however, the method used showed a limit of quantification of 5 µg/kg, thus excluding quantification at the levels that we report.
The pigs (females) in the present study provided with 20 µg of 25(OH)D3/kg feed had similar levels of 25(OH)D3 in adipose tissue and lean meat as slaughter pigs (both sexes) fed 20 µg of 25(OH)D3/kg feed( Reference Jakobsen, Maribo and Bysted 2 ). In contrast, the corresponding level of vitamin D3 was five times higher in the pigs in the present study: 2·71 v. 0·57 µg/kg. This discrepancy may be due to differences in study design. In the present study, all pigs were fed vitamin D3 up to inclusion in the study, while the pigs were divided into the different feeding groups after weaning( Reference Jakobsen, Maribo and Bysted 2 ). Höller et al.( Reference Höller, Quintana and Gössl 15 ) reported a content of 5·7 µg of 25(OH)D3/kg lean meat of slaughter pigs fed 50 µg of 25(OH)D3/kg feed for 119 d. This value is 50–100 % higher than we found in white and red muscle tissue.
Interestingly, the vitamin D level found in the present study was relatively low compared with the vitamin D content determined in a study of Göttingen minipigs( Reference Burild, Frandsen and Poulsen 24 ). The vitamin D3 levels in the adipose tissues of the minipigs were 98 µg vitamin D3/kg and 67 µg of 25(OH)D3/kg, i.e. more than 10 times as high as found in the present study (7·59 and 2·03 μg/kg, respectively). The minipigs were fed 3·7–4·4 µg vitamin D3/kg body weight (approximately 200 µg/kg feed) for 5 weeks, which is about four times higher than the highest level in the present study. However, it can be speculated that the content of fat in the different breeds affects the concentration of vitamin D, e.g. the Göttingen minipig is a breed with small stores of fat, which will result in a higher concentration in the fat if the same amount of vitamin D is stored.
Our study showed that increased vitamin D3 levels in feed increase the contents of vitamin D3 and 25(OH)D3 in pork meat, and increased 25(OH)D3 levels in feed increase the content of 25(OH)D3 in pork. These findings demonstrate that increasing the levels of vitamin D in pig feed has the potential to increase the dietary intake of vitamin D from biofortified pork; however, the potential has a limitation due to the maximum level of vitamin D allowed in feed( 9 , 10 ).
Furthermore, we demonstrated that the adipose and white muscle tissue content of 25(OH)D3 could be predicted from the serum 25(OH)D3 level independently of the ingested form of vitamin D3. The content of vitamin D3 in these tissues was also related to the serum 25(OH)D3 level, but the correlation depended on the dietary source of vitamin D3.
Extrapolation from pig data has estimated the level of vitamin D stores in humans( Reference Heaney, Horst and Cullen 25 ). However, the content of vitamin D in human adipose tissues is generally higher (32–45 µg vitamin D3/kg)( Reference Heaney, Horst and Cullen 25 – Reference Blum, Dolnikowski and Seyoum 27 ) than in adipose tissues from pigs found in the present study at 7·6 µg vitamin D3/kg. However, content of 200 µg vitamin D3/kg in adipose tissue in Göttingen minipigs has been shown following daily exposure to UV light similar to 10–20 min in the midday sun at 55°N during summer( Reference Burild, Frandsen and Poulsen 24 ).
Conclusion
This study showed that the concentration and distribution of vitamin D3 metabolites (vitamin D3 and 25(OH)D3) in tissues depend on the ingested form of vitamin D. Furthermore, this study showed that serum 25(OH)D3 in pigs is a poor biomarker for the tissue vitamin D3 content if the dietary vitamin D source contains both vitamin D3 and 25(OH)D3.
Acknowledgements
This nutritional subproject received funding from Danish Ministry of Science.
C. L. was responsible for the design of the pig trial and performed all sample collections. J. J. was responsible for the design of this nutritional related subproject and performed the chemical analyses. A. B., J. J., N. F. and H. M. S. designed the statistical test, and N. F. performed the statistical analysis. A. B. wrote the draft paper. All authors approved the final version to be published.
There were no conflicts of interest.


 Open access