

10.1 Introduction
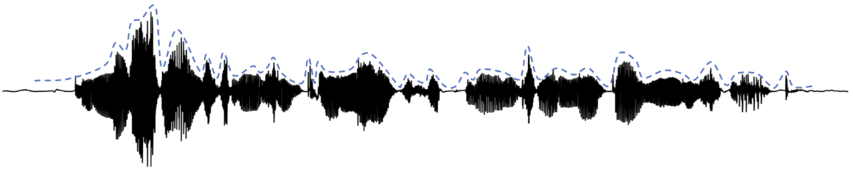
The analysis of amplitude envelopes has become a widespread method in the speech sciences (Gibbon, Reference Gibbon2021; Mermelstein, Reference Mermelstein1975; Rosen, Reference Rosen1992), language acquisition research (Goswami, Reference Goswami2018, Reference Goswami2019), and neurolinguistics (Assaneo et al., Reference Assaneo, Ripolles and Orpella2019; Gross et al., Reference Gross, Hoogenboom and Thut2013; Obleser et al., Reference Obleser, Herrmann and Henry2012; Poeppel, Reference Poeppel2014; Poeppel and Assaneo, Reference Poeppel and Assaneo2020). Loosely speaking, amplitude envelopes capture the amplitude distribution over the waveform of an utterance; a common metaphor is that their shape is like a blanket put over a waveform such that the individual positive glottal spikes “carry” the blanket. High-energy sounds (vowels, but also some sonorants and sibilants) lead to bumps in the amplitude envelopes; low-energy sounds (non-sibilant fricatives, stops) lead to troughs, as visualized in Figure 10.1. These amplitude envelopes present a low-frequency time-varying signal.
Schematic display of amplitude envelope.
Waveform (black) with a stylized amplitude envelope (dashed line) shifted upwards to increase visibility.
Like for any other signal, one can extract the spectrum of the low-frequency amplitude envelope, which gives an indication of the frequencies of modulation that have the most direct association with the concept of speech rhythm. Three reasons make the analysis of amplitude envelopes and modulation frequencies (i.e., modulation spectra) interesting. First, envelopes capture the part of the signal that is relevant to convey rhythm, which makes them a prime candidate for a fresh look at acoustic research on speech rhythm (Arvaniti, Reference Arvaniti2009, Reference Arvaniti2012; Barry, Reference Barry, Trouvain and Gut2007; Ramus et al., Reference Ramus, Nespor and Mehler1999), beyond the analysis of durational cues (Dauer, Reference Dauer1983) and acoustic isochrony. Second, the method is easy to apply to speech, without manual annotation. Third, it has been proposed that neural oscillations at different frequency bands track linguistic structure in speech, such as phonemes or syllables (Assaneo et al., Reference Assaneo, Ripolles and Orpella2019; Gross et al., Reference Gross, Hoogenboom and Thut2013; Poeppel, Reference Poeppel2014).
Despite the increasingly widespread use across disciplines, there is little research on which aspects of speech influence the amplitude envelopes in what ways. Cross-linguistic comparisons suggest that a language’s rhythm affects the modulation spectra in particular (see Section 10.3.1). The aim of this chapter is twofold: It first provides an acoustic and statistical overview of previous studies (Section 10.2); then it reviews some literature on modulation spectra for linguistic contrasts at the phrase level (Section 10.3: cross-linguistic differences, speaking styles, and illocution type) and more locally at the word level (Section 10.4: the role of segmental length and pitch accent type). Where possible, we provide data of our own, analyzed with the same workflow to allow for comparison of the magnitude of the differences (as a measure of effect size) and the frequency bands at which linguistic contrasts exert their differences (to allow for generalizations and the generation of hypotheses for future studies). Of the five linguistic contrasts included in this chapter, pitch accent type is the only one that does not alter the general rhythmic structure of an utterance (irrespective of accent type, the pitch accent is associated with the very same word; pitch accents primarily consist of frequency modulations, not amplitude modulations; see Gibbon, Reference Gibbon2021). Pitch accent type is hence not expected to change the amplitude envelopes and serves as a perfect control condition to probe the specificity of the procedure for capturing rhythmic aspects. The chapter closes with an overview of the effect sizes and frequency domains in which effects are located for the own data (presented in Sections 10.3.1, 10.3.3, 10.4.1, and 10.4.2), discusses potential generalizations, and postulates desiderata for future research (Section 10.5).
This contribution focuses on the interpretation of amplitude envelopes in terms of phonetic and linguistic factors. Adhering to the book’s scope, it primarily covers research that investigates aspects that pertain to speech rhythm. Hence, it does not cover the neurolinguistic literature that is concerned with testing links between brain oscillations and modulation frequencies of the amplitude envelope (see Chapters 3 and 5). Amplitude envelopes share some overlap with research on perceptual centers (p-centers; see Marcus, Reference Marcus1981; Rathcke et al., Reference Rathcke, Lin, Falk and Dalla Bella2021) and amplitude rise times, which are related to vowel onsets (Chapter 11). This literature is, however, not covered here.
10.2 Acoustic and Statistical Background
Low-pass-filtered amplitude envelopes capture the slow-varying energy distributions over the course of an utterance. Technically, modulations can be extracted in different ways (for a comparison between extraction techniques and their relation to vowel onset, see MacIntyre et al., Reference MacIntyre, Cai and Scott2022). A common procedure is to filter the spectrum into a range of bands (between 70 Hz and 10,000 Hz). The cutoff points for filtering are either spaced logarithmically or equidistantly on the cochlear map (Chandrasekaran et al., Reference Chandrasekaran, Trubanova, Stillittano, Caplier and Ghazanfar2009; Gross et al., Reference Gross, Hoogenboom and Thut2013; Todd and Brown, Reference Todd and Brown1994; Varnet et al., Reference Varnet, Ortiz-Barajas, Erra, Gervain and Lorenzi2017). The initial decomposition of the signal into bands has the advantage of representing amplitude information from different frequency bands, information that has been shown to affect intelligibility (see Chapter 8) because the different frequency bands provide information on an utterance’s linguistic structure (Assaneo et al., Reference Assaneo, Ripolles and Orpella2019; Gross et al., Reference Gross, Hoogenboom and Thut2013; Poeppel, Reference Poeppel2014). The envelope itself can be extracted using half-wave rectification (making the signal positive) followed by low-pass filtering (Caetano and Rodet, Reference Caetano and Rodet2011; Gibbon, Reference Gibbon2021; Kolly and Dellwo, Reference Kolly and Dellwo2014; Loizou et al., Reference Loizou, Dorman and Tu1999) or by using the Hilbert transform (Braiman et al., Reference Braiman, Fridman and Conte2018; MacIntyre et al., Reference MacIntyre, Cai and Scott2022; O’Sullivan et al., Reference O’Sullivan, Power and Mesgarani2015). These two methods are said to achieve largely similar results (Ding et al., Reference Ding, Patel and Chen2017, p. 182). The wideband envelope is derived by the sum of the narrowband envelopes (Chandrasekaran et al., Reference Chandrasekaran, Trubanova, Stillittano, Caplier and Ghazanfar2009) or their average (Varnet et al., Reference Varnet, Ortiz-Barajas, Erra, Gervain and Lorenzi2017). Other authors do not initially decompose the signal into frequency bands but first band-pass-filter the signal (e.g., between 400 and 4,000 Hz) and then low-pass-filter it (<10 Hz), for example, by using Butterworth filters (Tilsen and Johnson, Reference Tilsen and Johnson2008).
In most cases, researchers analyze amplitude envelopes spectrally, that is, in the frequency domain. To that end, modulation frequencies are extracted by discrete Fourier transform (Gibbon, Reference Gibbon2021; Tilsen and Johnson, Reference Tilsen and Johnson2008). The result is a spectrum, that is, a continuous power curve across frequency bands. The signal typically follows a 1/f trend; that is, it has the highest energy in low-frequency bands (note that this 1/f trend is removed in some approaches). The different frequencies relate to linguistic units of different sizes (phrasal rate: 0.6–1.3 Hz; word/stress rate: 1.8–3 Hz; syllable rate: 4–5 Hz; phone rate: 8–10 Hz [Keitel et al., Reference Keitel, Gross and Kayser2018]). One metric that is employed is the frequency of the highest peak (when the 1/f trend is removed), which is consistent across languages (Ding et al., Reference Ding, Patel and Chen2017; Varnet et al., Reference Varnet, Ortiz-Barajas, Erra, Gervain and Lorenzi2017) and related to the syllable rate (but see Zhang et al., Reference Zhang, Zou and Ding2023). Other researchers analyze the envelope in the time domain using empirical mode decomposition of the amplitude modulation (Tilsen and Arvaniti, Reference Tilsen and Arvaniti2013) and extract different parameters from that signal. Some authors combine measures from both the frequency and the time domains (Lau et al., Reference Lau, Patel and Kang2022). It is clear that the variety of signal-processing methods makes it hard to directly compare results and effect sizes across studies. For the analysis of our own data presented here (specifically in Sections 10.3.1, 10.3.3, 10.4.1, and 10.4.2), we used nine gammatone frequency bands between 100 and 10,000 Hz, spaced equidistantly on the cochlear map, followed by low-pass filtering of the rectified narrowband signals. These narrowband envelopes were summed to derive a wideband envelope, which was then submitted to Fourier analysis (see Einfeldt and Braun, Reference Einfeldt, Braun, Skarnitzl and Volín2023 and Frota et al., Reference Frota, Vigário, Cruz, Hohl and Braun2022, for more details on these methods). Neither the sound files nor the amplitude envelope modulation spectra were normalized (i.e., the 1/f trend was not removed).
There are different kinds of analyses of amplitude envelopes in the literature. One approach has been to correlate aspects of the amplitude modulation spectra with visual phonetic information (Chandrasekaran et al., Reference Chandrasekaran, Trubanova, Stillittano, Caplier and Ghazanfar2009, with mouth-opening data), acoustic information (MacIntyre et al., Reference MacIntyre, Cai and Scott2022, with acoustic vowel onsets; Varnet et al., Reference Varnet, Ortiz-Barajas, Erra, Gervain and Lorenzi2017, with temporal rhythm metrics such as pairwise variability indices), or phonological information (Gibbon, Reference Gibbon2021, with morphophonological information; Leong and Goswami, Reference Leong and Goswami2015, with feet, syllables, and onset–rime units; Todd and Brown, Reference Todd and Brown1994, with the phonological stress hierarchy of a word). It has also been tested how useful the amplitude envelope information is for prediction (Ludusan et al., Reference Ludusan, Origlia and Cutugno2011: prominent syllables; MacIntyre et al., Reference MacIntyre, Cai and Scott2022: vowel onsets) and clustering (Gibbon, Reference Gibbon2021). In studies that investigate effects of particular factors on the amplitude modulation spectra, mixed-effects models (Baayen et al., Reference Baayen, Davidson and Bates2008) or general additive mixed models (GAMMs) have been employed (Wood, Reference Wood2006). For our own data presented here (see Sections 10.3.1, 10.3.3, 10.4.1, and 10.4.2), we used GAMMs as they allow the researcher to model differences in power across frequency bands in a continuous manner, while accounting for autocorrelation (see Frota et al., Reference Frota, Vigário, Cruz, Hohl and Braun2022, for details of the statistical modeling). GAMMs establish the frequency bands in which significant differences occur across conditions and can be used for both exploratory and hypothesis-testing research questions. They allow for a statistic comparison of effect sizes (differences in log power, mathematically equivalent to ratios of raw power) and frequency bands across conditions.
10.3 Cross-linguistic and Cross-stylistic Comparisons
10.3.1 Cross-linguistic Comparisons
In linguistics, languages have been grouped into different rhythm classes (stress-timed, syllable-timed, mora-timed) based initially on perceptual impression. A common assumption is that there is a roughly equal distance between the respective linguistic units. Since such isochrony (typically established by annotation of segments) has been difficult to establish (e.g., Chapter 14; Dauer, Reference Dauer1983), other composite metrics have been suggested (see Grabe and Low, Reference Grabe, Low, Gussenhoven and Warner2002; Ramus et al., Reference Ramus, Nespor and Mehler1999), all relying on manual annotation. However, these measures are also not without difficulties (Arvaniti, Reference Arvaniti2009, Reference Arvaniti2012), and the analysis of low-frequency amplitude envelopes is expected to support cross-linguistic differences in speech rhythm. Interestingly, there are a number of studies that suggest that amplitude envelopes have globally similar shapes across languages, including peaks in power for low-modulation frequencies followed by a decrease in amplitude (Ding et al., Reference Ding, Patel and Chen2017; Poeppel and Assaneo, Reference Poeppel and Assaneo2020; Varnet et al., Reference Varnet, Ortiz-Barajas, Erra, Gervain and Lorenzi2017). One of the most comprehensive studies was conducted by Ding et al. (Reference Ding, Patel and Chen2017). They analyzed amplitude modulations from nine different languages (American English, British English, Chinese, Dutch, Danish, French, German, Norwegian, and Swedish). Their analyses show a peak in the (1/f-corrected) speech modulation spectrum around 4 Hz, independent of (the rhythm of the) languages. Varnet et al. (Reference Varnet, Ortiz-Barajas, Erra, Gervain and Lorenzi2017) analyzed semi-spontaneous productions from 10 languages (Basque, Dutch, English, French, Japanese, Marathi, Polish, Spanish, Turkish, and Zulu). They showed that the amplitude envelopes differed between stress-timed and syllable-timed languages (p. 1981). Frota et al. (Reference Frota, Vigário, Cruz, Hohl and Braun2022) compared amplitude envelopes in three rhythmically different languages: stress-timed German, and more syllable-timed Brazilian and European Portuguese. They showed that rhythmic differences across languages are reflected in modulation spectra: stress-timed German had higher power than more syllable-timed Brazilian and European Portuguese in the delta (1–2 Hz) and theta bands (6–8 Hz). European and Brazilian Portuguese also differed, but only in the delta band (1–2 Hz), with similar mean differences as between German and the two Portuguese varieties. The difference between the two Portuguese varieties may be due to macro-rhythmic difference (see Jun, Reference Jun2012): There are more frequent pitch accents in Brazilian than European Portuguese, affecting the energy distribution over the utterance, which is then picked up in the low-frequency amplitude envelope. Tilsen and Arvaniti (Reference Tilsen and Arvaniti2013) compared six languages (English, German, Greek, Italian, Korean, and Spanish) (see Section 10.3.2 for more detail). Their cross-linguistic analysis showed that English differed from the other languages, but no other comparisons were significant. The special characteristics of English were explained in terms of the “relatively high degree of supra-syllabic periodicity in English and minimal differences among the other languages in the corpus” (p. 635). In sum, Varnet et al. (Reference Varnet, Ortiz-Barajas, Erra, Gervain and Lorenzi2017) and Frota et al. (Reference Frota, Vigário, Cruz, Hohl and Braun2022) reported differences between stress-timed and syllable-timed languages, while Ding et al. (Reference Ding, Patel and Chen2017) and Tilsen and Arvaniti (Reference Tilsen and Arvaniti2013) did not. Possible reasons for discrepancies in outcomes are differences in the type and amount of materials (read sentences versus longer texts and more spontaneous productions; see Section 10.3.2) or differences in the type of signal processing.
10.3.2 Speaking Styles
The most rhythmic style analyzed in the literature is probably English nursery rhymes spoken in synchrony to a metronome in infant-directed speech (Leong and Goswami, Reference Leong and Goswami2015). But also, quite generally, infant-directed speech showed a higher amplitude in the delta band (around 2 Hz) than adult-directed speech (Leong et al., Reference Leong, Kalashnikova, Burnham and Goswami2017), suggesting a clearer foot-based rhythm. In their cross-linguistic study introduced in Section 10.3.1, Tilsen and Arvaniti (Reference Tilsen and Arvaniti2013) further tested for effects of speaking styles (spontaneous speech, read sentences, read passages). They showed an effect of speaking style on time domain aspects of the speech envelopes, distinguishing spontaneous speech from the two read speech recordings (p. 635).
10.3.3 Illocution Type
Hohl and Braun (Reference Hohl and Braun2023) tested the influence of illocution type, in particular whether a question was meant as an information-seeking or a rhetorical one. This contrast can be signaled lexically – see (1) versus (2) – but also by means of prosody.
(1)
What time is it? information-seeking question (2)
Who likes paying taxes? rhetorical question
Prior analyses have shown that rhetorical questions are realized with longer constituent durations than information-seeking questions (Braun et al., Reference Braun, Dehé, Neitsch, Wochner and Zahner2019; Dehé and Braun, Reference Braun, Dehé, Neitsch, Wochner and Zahner2019, Reference Dehé and Braun2020). Furthermore, they were more often realized with a breathy voice quality (in particular in German) and differed in global intonation. In English polar questions, moreover, participants often shifted the accent from the default accent on the final noun in information-seeking questions (e.g., Does anyone like lemon?) to the indefinite in rhetorical questions (e.g., Does anyone like lemon? [small capitals signal accent location]). The analyses of amplitude envelopes showed differences across illocution types in all languages. The strongest difference (0.5 log power) was observed for English between 3.1 and 4.7 Hz (with larger power for rhetorical than for information-seeking questions). Further smaller differences were present between 1.4 and 1.9 Hz. Icelandic showed differences in slightly lower frequency bands (0.5–1.2 Hz and 3.4–3.8 Hz), but of a smaller magnitude than English (0.2 log power with large variability). The magnitude of the differences for German lay in between (0.4 log power), but occurred in a higher frequency band (7.3–9.1 Hz). The authors argued that the differential effects of illocution type in the three languages cannot be explained by differences in segment durations alone (which were overall largest in Icelandic and smaller in German and English) but must be caused by other differences. Likely predictors are accent placement (for English) and the use of a breathy voice in initial segments in rhetorical questions (in German). We will return to this in the General Discussion (Section 10.5).
10.4 Local Differences in Segmental Length and Pitch Accent Type
10.4.1 Segmental Length
In languages with segmental length contrasts, the length of segments (vowels or consonants) distinguishes lexical candidates. It is expected that the different durations influence the “local” rhythmic structure of target words and hence the modulation spectra. Hohl et al. (Reference Hohl, Behrens-Zemek and Braun2022) extracted spectra for German word pairs differing in vowel length, which were matched for lexical frequency (e.g., Mitte [ˈmɪṫʰə] “center” versus Miete [ˈmiːtʰə] “rent”). Note that length in German is often, but not always, accompanied by vowel quality. The results showed that words with a long vowel had a lower power in a small frequency band just below 2 Hz and, importantly, between 5 and 8.5 Hz (mean difference of 0.4 in log power). Interestingly, the segmental length effect disappeared when the target words were embedded in carrier phrases (Das nächste Wort war XXX, “The next word was XXX”), suggesting that the effect of vowel length on the global rhythmic profile of utterances is negligible.
The effect of consonantal length in native speakers of Italian was studied in Einfeldt and Braun (Reference Einfeldt, Braun, Skarnitzl and Volín2023) (see top panel of Figure 10.2). In their first experiment, they extracted modulation spectra from six Italian speakers from 16 minimal pairs only differing in phonemic consonant length (e.g., fato [ˈfato] “fate” and fatto [ˈfatːo] “fact, done”). The results showed that the Italian consonantal length contrast is evident in a large frequency band in the modulation spectra. Compared to the German vowel length contrast, the Italian consonantal length contrast has power differences in a larger frequency interval (2–7.4 Hz compared to 5–8 Hz) and is larger in magnitude (up to 0.5 larger log power in geminates than in singletons). The most likely reason for these cross-linguistic differences in magnitude and frequency band between Italian consonantal and German vocalic length is that the Italian length contrast is distributed over a longer temporal interval, with adjustments to not only the duration of the consonant but with complementary temporal adjustment in the preceding vowel (Payne, Reference Payne1995) and even the word-initial consonant (Turco and Braun, Reference Turco and Braun2014).
Differences in amplitude envelope spectra for two linguistic contrasts.
Estimated effects of consonantal length in Italian (top) and pitch accent type in German (bottom), as predicted by the GAMM model (left panel) and estimated differences (right panel). The gray band shows the 95% CI of the difference.
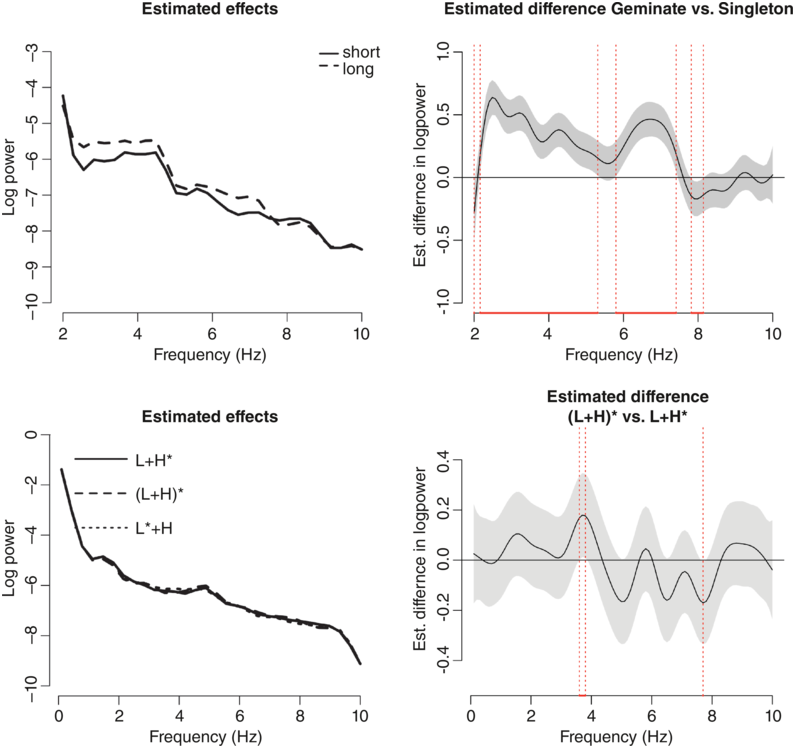
Figure 10.2 Long description
Top left. A line graph of log power ranging from minus 3 through minus 10 versus a frequency that ranges from 2 through 10 hertz. The graph plots a solid line for short consonants (Singleton) which originates from (2, minus 4), declines and terminates at (10, minus 8.5) and a dotted line for long consonants (Geminate), which is higher than the solid line in certain frequency bands. Top right. A line graph compares the estimated difference in log power between two conditions, namely, Geminate and Singleton across different frequency bands. It plots a fluctuating line along with the shaded area the represents the confidence interval. Bottom left. A line graph compares the log power with the frequency. It plots an overlapping line which represents L plus H star, LH star and L star plus H The line originates at approximately at (0, minus 1.5), declines, and terminates at (10, minus 9). Bottom right. A line graph compares the estimated difference in log power between two conditions across frequency bands. It plots a fluctuating line with the shaded area that represents the confidence interval.
10.4.2 Pitch Accent Type
So far, there has been little information in the literature as to whether/how pitch accent type (i.e., rising or falling) directly affects the amplitude envelope. The data used for testing this factor was originally collected in Zahner-Ritter et al. (Reference Zahner-Ritter, Einfeldt and Wochner2022). The study tested three conditions that differed in the alignment of the low and high tonal targets with respect to the stressed syllable in rising–falling accents. In L+H*, the low (L) tone preceded the stressed syllable while the high (H) tone was aligned with the stressed syllable; in (L+H)*, both the low and the high tonal targets were aligned with the stressed syllable; and in L*+H, the low tone was aligned with the stressed syllable and the high tone in the following syllable. Since a change in accent shape (on the same word) does not have a strong influence on an utterance’s rhythm, we do not expect an effect of intonation condition on the amplitude modulation spectra. The data hence serve as a control condition to test the specificity of the modulation spectra for rhythmic contrasts.
For the purpose of this chapter, we analyzed the modulation spectra of imitation data from native German speakers who imitated the three-way accent contrast in rising–falling accents on words in wh-questions (e.g., Wer malt denn mandalas? “Who draws PRT mandalas”). The results of the GAMM analysis showed an improvement in the modal fit when adding a random smooth for accent over a model without that random smooth term (χ2(6) = 6903.6, p < 0.0001). However, the estimated effects of the three accents overlap to a large degree (see Figure 10.2, left panel). Pairwise comparisons between the three kinds of accentual realizations showed only minimal differences in power for one of the accent contrasts: There was slightly higher power in (L+H)* than L+H* in the frequency range between 3.6 and 3.8 Hz. The mean difference in power was 0.2, with a lot of variability (95% CI [confidence interval] of the difference: [0.01;0.38]; see bottom panel of Figure 10.2). It is possible that the model picked up on the higher energy exerted by producing a salient rise in the stressed syllable compared to shallower rises in L+H* and L*+H accents. In any case, the effects of fundamental frequency (f0) contour are minimal.
10.5 General Discussion
This chapter provided an overview of the extraction and analysis methods of amplitude envelope modulations in the literature. It then focused on the role of some linguistic factors that may affect the rhythmic structure of utterances: rhythm class, speech style and illocution, as well as segmental length. As a control condition, to test the specificity of the method for capturing rhythmic contrasts, we added an analysis of the effect of pitch accent type on amplitude envelopes. As expected, this factor only marginally affected the amplitude envelope modulation spectra (in a very small frequency band and with little difference in power), supporting the view that amplitude envelopes carry first and foremost rhythmic information.
The different aspects examined here had different effects on the amplitude envelopes, both in terms of the magnitude of the (log) power differencesFootnote 1 and of the frequency bands that were affected: The largest mean differences across conditions were observed for different rhythm classes (macro rhythm: Brazilian versus European Portuguese; stress timing versus syllable timing: German versus Portuguese), followed by consonantal length in minimal pairs in Italian, and rhetorical versus polar questions in English (mean differences > 0.5). The other linguistic factors had smaller effects (rhetorical versus information-seeking questions in German and Icelandic, differences in vowel length in German) (see Table 10.1). Pitch accent type, the control condition, showed very small effects with a large spread.
Overview of differences in amplitude modulation spectra (frequency bands, maximum frequency range of significant differences Δf) and maximum differences in log power (including the 95% CI of the difference) for selected linguistic contrasts, analyzed with the same method, ordered by decreasing maximum mean difference in log power. (EP: European Portuguese; BP: Brazilian Portuguese).
| Contrast | Frequency bands of significant differences (Hz) | Max Δf (Hz) | Max. mean difference | 95% CI of difference |
|---|---|---|---|---|
| Macro rhythm (EP vs. BP) Stress timing (German) vs. syllable timing | 1.3–2.5 G vs. EP: 1.4–1.8; 6.7–9.3 G vs. BP: 1.6–2.4; | 1.2 2.6 1.0 | 0.7 0.6 0.6 | [0.5;1.0] [0.5;1.0] [0.4;1.0] |
| 7–7.9; 9–10 | ||||
| Consonant length | 2–7.4 | 5.4 | 0.6 | [0.5;0.7] |
| English rhetorical vs. information-seeking questions | 1.4–1.9; 3.1–4.7 | 0.5 | 0.5 | [0.35;0.65] |
| Vocalic length | 2.1–3.8 | 1.7 | 0.4 | [0.1;0.6] |
| German rhetorical vs. information-seeking questions | 7.3–9.1 | 1.8 | 0.35 | [0.15;0.55] |
| Icelandic rhetorical vs. information-seeking questions | 0.5–1.2; 3.4–3.8 | 0.7 | 0.3 | [0.15;0.45] |
| Pitch accent type | (L+H)* vs. L+H*: 3.6–3.8 | 0.2 | 0.2 | [0.01; 0.4] |
Differences in the lowest frequency bands (0.5–2.5 Hz) are observed for rhythm class (macro rhythm, stress timing versus syllable timing) as well as English and Icelandic rhetorical versus information-seeking questions (roughly in the range between), that is, aspects that concern the whole utterance. However, differences in the highest frequency bands (> 7.3 Hz) are also caused by phrasal aspects (stress timing versus syllable timing, German rhetorical versus information-seeking questions). This is surprising given that these frequency bands capture phone-sized units (Keitel et al., Reference Keitel, Gross and Kayser2018). We conclude that rhythm class and illocution type exert influence on a segmental level as well, which is then tracked in these higher frequency bands. The more local length contrasts had different effects: vowel length in the vicinity of the syllable rate (around 4 Hz), consonant length in a very broad frequency band. This is consistent with the observation that the consonantal length contrast is not limited to the duration of the respective consonant but is distributed more widely. The effect of the control condition, pitch accent type, was minimal.
In terms of the size of affected frequency intervals, Italian consonantal length exerted effects in the largest frequency range (Δ = 5.4 Hz; see Table 10.1). Pitch accent type, on the other hand, had differences in the smallest frequency range (Δ = 0.2 Hz). This latter finding strengthens the conclusion that differences in pitch accent type alone do not alter the amplitude envelope (or the rhythmic structure).
For future research, it would be desirable to provide access to off-the-shelf, open-source programs, such that results across languages and factors become more comparable across labs. In terms of the signal processing involved, application-oriented researchers may benefit from mathematically easier methods (e.g., low-pass filtering compared to Hilbert transform) because they can be more readily understood and results may find a broader audience.Footnote 2
Carefully controlled materials provide a useful first step to target the linguistic aspects that influence low-frequency amplitude envelopes. This will ideally lead to a model from which we can derive testable predictions for future research and for analyzing more heterogeneous speech materials. To date, it clearly seems that (macro-)rhythmic differences across languages as well as consonantal length have a robust influence in the low-frequency range (around 2 Hz). Studies from more languages are needed to test the generalizability of this finding.
10.6 Acknowledgements
I thank Friederike Hohl, Hendrik Behrens-Zemek, and Marieke Einfeldt for recording participants and pre-processing data. Thanks are further due to Volker Dellwo for providing the script to extract the narrowband envelopes, to Sonia Frota and Antje Strauß for general discussion about low-frequency amplitude envelopes and cross-linguistic differences, to Anna Verebély for help with figure quality, and to Dafydd Gibbon for valuable comments on an earlier version.
Summary
After an introduction to amplitude envelopes, the chapter compared several linguistic contrasts (rhythm class, speaking style, consonantal and vocalic length, pitch accent type) with regards to their respective effects on amplitude envelope modulation spectra. Results showed the largest power differences for rhythm class and the smallest differences for pitch accent type.
Implications
Amplitude envelopes provide a holistic measure that efficiently captures rhythmic differences. The comparison of controlled data allowed us to isolate different factors and work towards a model of factors that influence amplitude envelopes. Future research will benefit from more languages and the provision of transparent open-source scripts to ease comparison.
Gains
Neurobiology has long thought of links between amplitude envelopes in the speech signal and brain oscillations. The current research allows us to better understand the links between linguistic factors and the amplitude envelope, ultimately leading to a model that describes the connections between linguistic units and brain oscillations.


 Open access