Introduction
Closed-basin lakes are excellent indicators of changes in climate. Due to their nature, water levels can vary dramatically, as precipitation and evaporation change over time. Evidence of these changes can be found in the form of perchedor flooded shorelines (Reference GilbertGilbert, 1890; Reference Jones, Carver, McSaveney and TickhillJones and others, 1971; Cut-field, 1974), and salt deposits in lake sediments (Reference Hardie, Smoot and EugsterHardie and others, 1978; Reference EugsterEugster, 1980). Changes in lake level and water volume often correspond with changes in the water chemistry. During water-level rises, solutes are diluted, while during water depletion solutes can be concentrated. Minerals, such as calcite, can be precipitated if their saturations are reached. These chemical changes, in turn, affect the biology of the lakes, as higher nutrient concentrations cause higher productivity, and higher solutes generally limit the number of species present in a lake ( Reference MelackMelack, 1983). Biological activity in these types of lakes, as anywhere on Earth, is closely connected to the carbon cycle. Photosynthesis and respiration deplete and enrich inorganic carbon in lakes. These processes can change the stable carbon isotopic composition (δ13C) of the lake water. Shifts in rates of productivity and mineralization can cause the organic contents of lake sediments to vary. These changes in the quality (isotopic) and quantity (organic vs inorganic matter) of the carbon have been used widely to deduce paleo-conditions from lake sediments (Reference McKenzieMcKenzie, 1985). in order to interpret sedimentary records it is essential to qualify and quantify present closed-basin lake systems. Closed-basin lakes in Antarctica respond like lakes in more moderate climates (Reference Doran, Wharton and LyonsDoran and others, 1994). Because they are located in the driest desert of the Earth, and are recharged only by Glacial meltwater, their water levels are very sensitive to climate changes (Reference Clow, McKay, Simmons and WhartonClow and others, 1988; Reference Wharton, McKay, Clow, Andersen, Simmons and LoveWharton and others, 1992). The amount of recharge can vary drastically from year to year, and is controlled in the temperature (Chinn, 1985 . These lakes are also covered with a perennial ice cover. This “lid” affects the lakes by reducing gas exchange, excluding wind mixing and absorbing 97-99% of the incoming light (Reference VincentVincent, 1987; Reference Lizotte and PriscuLizotte and Priscu, 1992; Wharton and others, 1992). The balance between ice-cover gain (by freezing of water to the bottom of the ice) and loss (via ablation from the surface) itself is affected by climate variation, and as a result the thickness changes over time (Wharton and others, 1992). This in turn directly influences the transmissivity, and the productivity in these partially light-limited lake systems.
Site Description
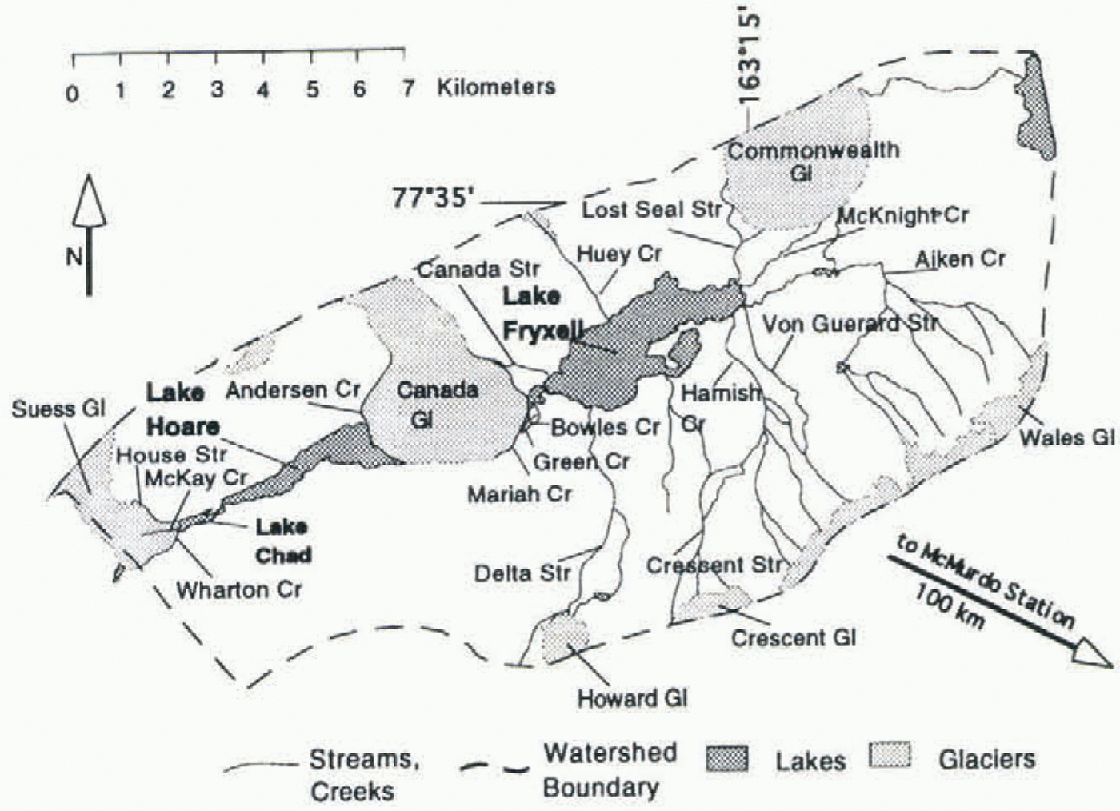
Lakes Hoare and Fryxell are located in Taylor Valley, southern Victoria Land, Antarctica (Fig. 1). in 1993 a U.S. National Science Foundation- (NSF-)supported long-term ecological research (LTER) site was established in Taylor Valley, and various chemical, physical and biological parameters have been monitored by the LTER team on a routine basis. The valley is located ~100km northwest of McMurdo Station, at 76-78° S, 160-164° E. The valley is arid, with a precipitation of ≤ 100 mm a−1 (Clow and others.1988). The average annual temperature is less than -20°C, but temperatures rise above freezing during a few days of the summer. No vascular plants grow in the valley. There are algaeand lichens growing in the soil (Reference Campbell and ClaridgeCampbell and Claridge, 1987), but most plants are located in algal mals in the lakes and the streams (Wharton and others, 1983). As a result, terrestrial input of organic matter into the lakes is very limited (Reference McKnight, Aiken and SmithMcKnight and others, 1991, Reference McKnight, Aiken, Andrews, Bowles, Harnish, Green and Friedman1993). Lake Hoare is a fresh-water lake (total dissolved solids (TDS) = 300-750 mg 1 −1) of 30 m depth, that is oxygenated all the way to the bottom, except for some small anoxic pockets in its deepest parts. Lake Fryxell is 18 m deep, is brackish (TDS = 300-8000 mg 1−1) and has a steep chemo- and oxy-cline at 9 m depth.

Fig. 1. Map of the eastern part of Taylor Valley, Antarctica. Glaciers are light gray, lakes dark gray; white areasconsist of morainal material and bedrock. All streams feeding Lake Hoare flow along Canada and Suess Glaciers. The lake levels are a Jew meters above sea level. The Ross Sea is about 5 km to the east.
Methods
Water samples were collected at the location of the greatest water depth. Holes were drilled and melted at the beginning of each season. The holes could be used during the whole season (October-January). Five-liter Niskin bottles were lowered through the holes, and samples collected 3-4 times per season. pH was measured electrometrically (Beekman portable pH meters with various silver-silver-chloride glass electrodes; accuracy ±0.05) in the field within hours after sample collection. Temperature was measured with a Sea-Bird CTD probe. Dissolved inorganic carbon (DIC) samples from thelakes were stabilized with chloroform, stored in cooler boxes at ~4°C. The samples were injected into 6 NH2SO4 sparged with nitrogen gas and measured with an MSA Lira infrared gas analyzer (personal communication from J. C. Priseu, 1997), generally within 2 weeks of sampling. For streams, alkalinity was determined by titration and Gran plot (Reference DreverDrever, 1988). The relative standard deviations for the DIC and alkalinity analyses were ±3%. The samplesfor major cations/anions were filtered through Whatman 0.4 µm filters in the field, and analyzed in McMurdo Station byion chromatography (Reference Welch, Lyons, Graham, Neumann, Thomas and MikesellWelch and others, 1996), using a Dionex DX-300 Chromatograph. Those analyses were finished within ~2 months after sampling, and the error, expressed as percentage errors in the charge balance between cations and anions, was 3.4% for the streams and 3.0-1.4% for the lakes. The speciation models PHREEQE and PHRQPTTZ (Reference Parkhurst, Thorstenson and PlummerParkhurst and others, 1980; Reference Plummer, Parkhurst, Fleming and DunklePlummer and others, 1988) were used to calculate CO2 concentrations in the water. Samples for δ 13 C analysis were filtered into pre-evacuatcd 60 ml serum bottles, using Whatman 0.4 µm GF-F filters, and stabilized with 0.2 ml concentrated mercuric chloride solution. They were analyzed at the NASA Ames Research Center on a modified Nuclide 6-60RMS mass spectrometer (Reference Hayes, Des Marais, Peterson, Schoeller and TaylorHayes and others, 1977).
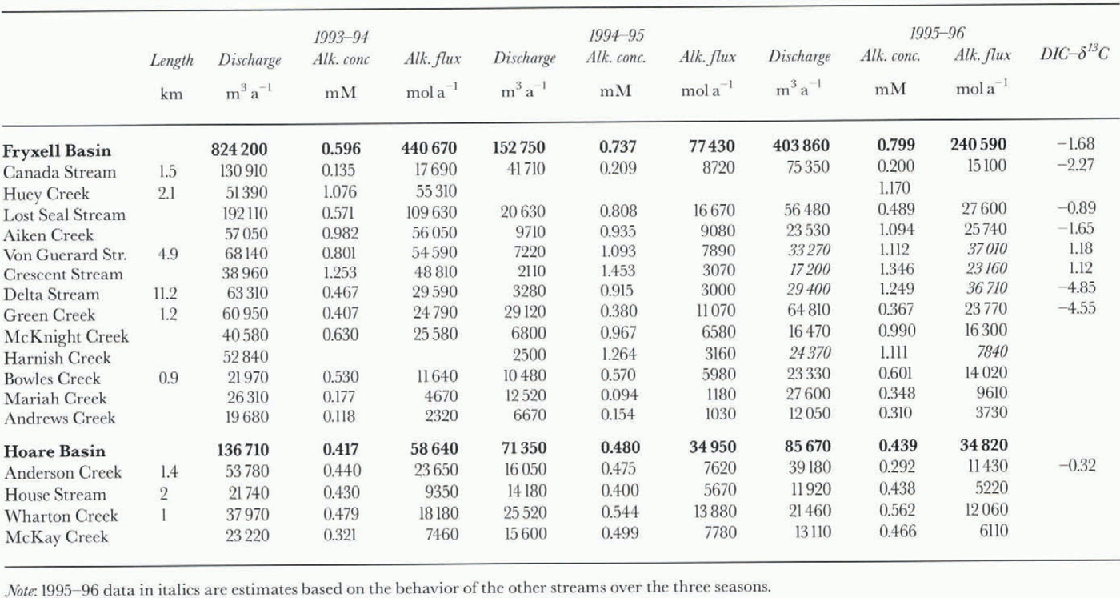
Table. 1. Stream length ( Reference AlgerAlger and others, 1997), annual water discharge, alkalinity concentrations and alkalinity fluxes, and δ13C values for streams in Lake Fryxell and Lake Hoare basins

Results
Data for the DIC flux in the streams entering Lakes Fryxell and Hoare are shown in Table 1. The values for the 1993-94season had to be calculated from the charge balance since no direct alkalinity measurements were made. The alkalinity in streams of Fryxell basin is generally higher than in Hoare basin; the averages are 0.7 and 0.4 mM, respectively. Both water and carbon discharge varied greatly: for example, during the 1993-94 season more than 800000 m3 ofwater and 440 000 mol alkalinity were discharged into Lake Fryxell, whereas in the 1994-95 season the amounts were 152000 m3 and 77400 mol alkalinity (i.e. a reduction of >80%). As a result, the carbon input into the lakes isprimarily controlled by the variation in annual discharge. The changes in flow of the streams entering Lake Hoare weremuch smaller than those of the streams entering Lake Fryxell. in the same two seasons, flow was reduced by only 50%. in the 1995-96 season the influx of alkalinity into Lake Fryxell tripled over the previous season, while it remained about the same in Lake Hoare basin.
δ13 C values of some streams during the 1994-95 season are shown in Table 1. Isotopic compositions ranged from -4.85‰ to + 1.18‰. The streams vary considerably in length, amount of algal mats present, gradients and exposure to direct radiation. The heaviest isotopic compositions occur in the streams with the highest alkalinitics, Von Guerard and Crescent Streams (Fig. 1). If weighted by discharge, the average inflow into Lake Fryxell has a δl3C of-1.7%a in Lake Hoare basin, only Anderson Creek has been sampled for carbon isotopes, and the values are -0.32‰ and -3.21 ‰ for samples collected at different dates.
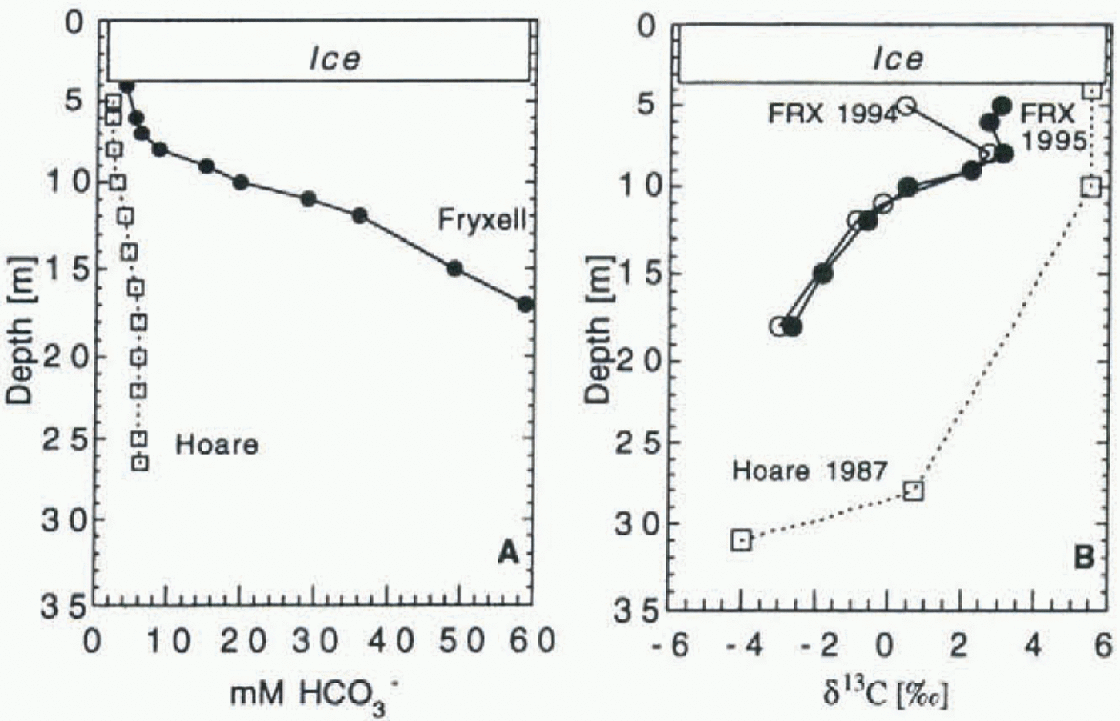
[DIC] and δ 13 C profiles for Lakes Fryxell and Hoare are shown in Figure 2. The [DIC] profiles are from November 1994. Both lakes show an increase in [DIC] with depth. Lake Hoare's values increase to 5.9 mM at 18 m depth, and then remain constant, while values in Lake Fryxell increase to the bottom, reaching 59 mM. At the end of the austral summer, both lakes show a trend of decreasing DIC in the uppermost parts of the water column (Fig. 3). The isotope profiles of Lakes Fryxell and Hoare are similar in shape. Values are enriched in the upper part of the water column. in Lake Fryxell, they decrease below the chemocline at 9 m depth and are lowest at the bottom, with values of-3.02‰ and -2.64‰ in 1994 and 1995, respectively. Values below the chemocline are identical for the two years, but the DIC in the upper, oxic part of the lake is heavier in 1995. with a maximum δ13 C of +3.03‰. in 1994, the heaviest value observed was +0.41 ‰. The data for Lake Hoare are from Wharton and others (1993] and were measured in 1987. The DIC has its heaviest value in the upper waters (δ13C = +5.3‰). To a depth of 10 m the values are constant, then they drop to 4.0% at 30 m depth.

Fig. 2. (a) Concentrations of bicarbonate in Lakes Hoare and Fryxell. Lake Fryxell has an oxycline and chemocline at 9 m depth; salinities increase sharply below. ( b) DIC-δ13C distributions in the same lakes. Data for Lake Hoare are from Wharton and others (1993).
Discussion
Streams
In absolute terms, streams put a large amount of DIC into the lakes (table 1). All the streams in both basins are undcrsaturatcd with respect to calcite. Calcite has been observed in soils (Campbell and Claridge, 1987), and a longer exposure of the water to calcite will result in a higher DIC load in the water. For example, the substantially longer streams in the Lake Fryxell basin generally exceed Lake Hoare basin streams in their DIC concentration. Alkalinity, whichunder the pH conditions encountered in these streams is roughly equivalent to [HCO3], varies by one order of magnitude within Fryxell basin streams. The shortest streams (table 1), Andrews, Mariah and Green Creeks, have the lowest [DIC] Algal mats are common in many of the stream beds, but are not evenly distributed (Alger and others. 1997).Most of the streams consist of slow-flowing stretches that are covered with algae, and fast-moving parts that flow over soil and morainal material. Algal mats could function both as a sink and as a source of DIC to the streams. When they are photo-synthetically active they may take up DIC, and increase the δ13C of the DIC remaining in the water by preferential uptake of light l2C (Des Marais and Canfield, 1994; Des Marais, 1995). When they respire, they add isotopically light CO2 to the water. of the short streams, Mariah Creek had no significant matspresent over the period of sampling, while large parts of the bed of Green Creek were covered with mats. However, the DIC is roughly the same in both streams. On the other hand, Green Greek had a δ13C of-4.55%. DIC in equilibrium with the atmosphere should have δ 13C values of+3‰ to +2‰, for temperatures of 0-10°C. The low values observed in Green Greek can only be caused by the respiration of light organic matter, i.e. algal mats. Accounting for the various discharge rates of the streams, the average DIC input into Lake Fryxell has a δ13C of -1.7% Even given the uncertainties caused by the incomplete measurements (~20% of the inflow was not sampled), this value is more negative than the value expected for DIC equilibrated with the atmosphere. The two samples in Lake Hoare basin were laken at the mouth of Anderson Creek at two times of the season, and had δ13C values of 0.32‰ and 3.21%. The algal mats are less important for the DIC loading than the stream length, but they seem to have a significant impact on the isotopic composition of the DIC.

Fig. 3. Seasonal changes in DIC and CO2aq concentrations in Lakes Fryxell and Hoare. Note the difference in the scales for the concentrations, especially in[CO2]aq.
Lakes
The chemical compositions of Lakes Hoare and Fryxell have been discussed extensively (e.g. Reference Angino, Armitage and TashAngino and others, 1962; Wilson, 1979; Green and others, 1988; Reference Lawrence and HendyLawrence and Hendy, 1989; Wharton and others, 1989). The isotopic data for Lake Hoare from Wharton and others (1993), data for Lake Fryxell in 1994 from Neumann and others (1995) and additional data for both lakes from the 1995-96 season are shown in Figure 2. Lake Hoare and Lake Fryxell profiles are strikingly similar: both have bottom waters with negative values that increase toward the surface. The steepest increase of δ13C values in Lake Fryxell occurs at the chemocline at 9 m depth. in 1995 the uppermost part of the water column of Lake Fryxell had the same structure as Lake Hoare, with the heaviest δ13C compositions with values around +3‰ just below the ice. in 1994 the uppermost sample had a value of +0.41 %a The fractionation of δ 13C in the water column is a result of biological activity. The Fryxell profile reflects primary production maxima at 9 m and just beneath the ice. The maxima are caused by availability of nutrients at the chemocline (which also is a “nulricline"; Priseu, 1995), and the highest irradiance in the lake just underneath the ice.
[DIC] also increases with depth in both lakes (Fig. 2). [DIC] in the bottom water of Lake Fryxell is one order of magnitude larger than the concentration in Lake Hoare. [CO2]aq also increases with depth. The difference between [DIC] and [CO2]aq is that, in the uppermost meter of the water column, [DIC] decreases over the season, while [CO2]aq values increase (Fig. 3). Over the austral summer 1994-95, pH values decreased from 8.8 to 8.5 in Lake Hoare, and from 7.6 to 7.0 in Lake Fryxell. This can be caused by two processes: the melting of lake ice and associated percolation of low-DIC meltwater into the lake water, and the influx of stream water in the late season. Stream water is low in [DIC], but high in [CO2]aq (table 2), while the uppermost lake water in Lake Hoare is depleted in [CO2]aq (Fig. 4). The pH values are also slightly lower in the stream waters (7-8; sec Table 1) than in Lake Hoare (8.5-8.8). Stream watcr should be relatively buoyant in Lakes Hoare and Fryxell, thus remaining directly underneath the ice. Stream water entering Lake Fryxell hasnegative δ13C values, and that can be reflected in the lighter composition of the uppermost lake water.
To calculate the inorganic carbon balance for Lakes Fryxell and Hoare, we modified an equation from Reference Quay, Emerson, Quay and DevolQuay and others (1986):

where V is volume of the lake, I is inflow (m3s−1), S is conversion of DIC to organic carbon and removal to deeper water (mol s−1), and DICL and DICI are dissolved inorganic carbon concentrations in the lake and inflows (mol m−3). A factor that is not accounted for in this equation is the removal of DIC by calcite precipitation. in Lake Washington, the dissolution and/or precipitation of CaCO3 was not significant (Quay and others, 1986). Our calculations show that the upper meters in Lake Fryxell change from super- to undersaturation with respect to CaCO3 through the season. in Lake Hoare, water above 15m is supersaturated with respect to calcite, and CaCO3 minerals have been found in sediments (Wharton and others, 1989). At present, we have no data that would allow any qualitative estimate of calcite precipitation in these lakes, and we cannot include this process in our calculation.
Table. 2. Water discharge, pH, pCO2, and [CO2]aqflux in Lake Fryxell and Lake Hoarebasins, 1994-95


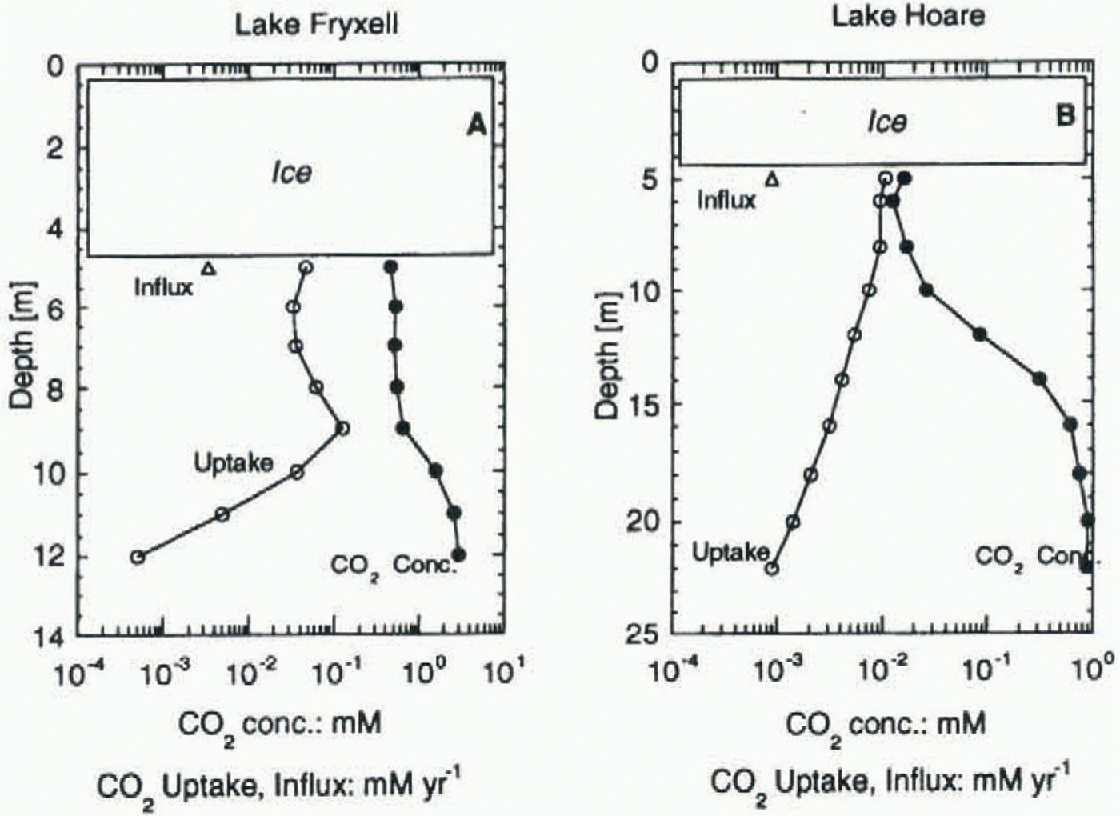
Fig. 4. CO2 uptake (prisce, 1995), recharge via streams, and CO2aq, concentrations in Lakes Fryxell and Hoare. Note the different scales for depth and concentrations/fluxes.
Lake Fryxell should be allected more strongly by the DIC input from streams than Lake Hoare because it receives much higher loads of DIC (tables 1 and 2). Using the modified formula, normalizing the DIC input with the lake area and assuming a mixing of the incoming stream water with the uppermost meter of the lake's water column, Lake Fryxell annually received 3.8%, 0.7% and 2.1% (average = 2.2%) of the DIC pool in the uppermost meter. The values for Lake Hoare are 9.3%, 5.5% and 5.5% (average = 6.8%). The absolute influx into Lake Hoare is much smaller, but because the lake has sucha low concentration of DIC it plays a more important role than in Lake Fryxell.
Primary productivity rates (PPRs) from Priseu (1995) were used to compare the average annual uptake of carbon at various lake depths with the available DIC At 5-8m depth, the annual uptake accounts for 0.43% of the DIC in Lake Hoare, and for 0.76% of the DIC in Lake Fryxell. These ratios are very similar, given that the PPR in Lake Fryxell is roughly four times as high as in Lake Hoare, and do not explain the different isotopic signatures found in the lakes. Most algae do not use all DIC as source for carbon, but rather a small fraction of it, [CO2]aq. [CO2]aq is much smaller in Lake Hoare (see Fig. 3), due to lower DIC and higher pH. The resulting ratio of [CO2]aq uptake vs supply shows a large difference between the two lakes (Fig. 4). While in Lake Fryxell the annual carbon uptake accounts for only 9% of the [CO2]aq at 5-9 m depth, in Lake Hoare (5-8 m) it accounts for 64%. This higher percentage uptake of CO2 in Lake Hoare explains why the carbon-isotope composition in the uppermost water column is consistently heavier than in Lake Fryxell. Wharton and others (1993) showed that a large part of the organic matter produced in the upper part of the water column is respired beforeit becomes incorporated into the sediment. This respiration results in increased [DIC] values and light isotopic composition in the lower part of the water column.
How will the carbon cycle and the isotopic signatures of Lakes Fryxell and Hoare react to climate changes? An increasein temperature would increase water and DIC discharge into the lakes. The main effect would be to raise lake level. The carbon budget of Lake Hoare will be greatly impacted, because the original [DIC] is much lower than that of Lake Fryxell. However, inflow of low-TDS stream water would dilute the nutrients dissolved in the lake and probably decrease the productivity.This will lead to less carbon uptake, and lighter carbon-isotopic compositions in the lake too. in situ produced calcite will have light δ13C values, or the [DIC] will become so low that calcite will be undersaturated.
A decrease in temperature and discharge would lower the water and DIC input into the lakes. in Lake Hoare this should lead to a heavier carbon-isotope composition. The already small carbon supply would be utilized further, and the DIC would become heavier. Increased calcite precipitation would effectively remove carbon from the system, potentially making the system carbon-deficient. Calcite precipitated in these conditions will be isotopically heavy.
Lake Fryxell water level would also drop, but the high [DIC] will reduce effects on the carbon cycle. These shifts in isotopic composition are possible only because the lake waters are separated from the atmosphere by the perennial ice cover. in lakes in higher latitudes deficits in CO2aq are compensated by dissolution of atmospheric CO2 into the water. Thus Lakes Fryxell and Hoare offer sedimentary repositories that could yield important paleoclimatic and pa-leobiological information.
Conclusions
The carbon cycle in the perennially ice-covered lakes in Taylor Valley is mainly governed by three factors: (1) the ice cover that limits gas exchange with the atmosphere, (2) the amount of DIC recharge via streams, and (3) the primary productivity in the lakes. Removal of inorganic carbon via calcite precipitation may also be important, but currently this process cannot be quantified. The amount of DIC in the streams is dependent on the stream length, with longer streams having higher DIC values due to more extensive dissolution of calcites. Algal mats in the streams seem to have little influence on the DIC concentration, but might have an effect on the isotopic composition. in the lakes, [DIC] and[CO2]aq increase with depth, while PPR and isotopic composition decrease. A seasonal decrease ofDIC and pH and an increase of pCO2 occur in the uppermost water column. The annual carbon uptake by phytoplankton at 5-9 m depth represents 9% of the CO2aq in Lake Fryxell. but 64% of the CO2aq in Lake Hoare. This high utilization rate causes the continuously heavier δ 13 C composition in Lake Hoare. Lakes Hoare and Fryxell will react differently to climate changes, with Lake Hoare, with its small pool of DIC, being affected more directly than Lake Fryxell, with its higher DIG concentrations.
Acknowledgements
We would like to thank K. Welch of the University of Alabama, and R. Ldwards of Montana State University, Boze-man, for their extensive help in the field and in the laboratories of Antarctica. A. Tharpc of NASA Ames Research Center performed the δ 13 measurements. We thank j. Priddle and H. Kennedy for reviewing this paper. This work was supported by NSF grant OPP-92/1773.


