


Introduction
Legionnaires’ disease is a type of pneumonia caused by infection with Legionella sp. after inhaling water vapor or mist that is contaminated by the organism. Legionella pneumophila, the most common species that causes the disease in humans, is identified in about 90% of cases reported in the United States [Reference Fields, Benson and Besser1]. Legionella is a fastidious Gram-negative bacillus found in freshwater environments at levels that do not usually cause human illness [Reference Garrison2]. But, under the right conditions, the organism proliferates in man-made water systems such as potable water storage tanks and air conditioning systems and, if distributed in the air, can cause infections in humans [Reference Garrison2]. Conditions encouraging proliferation include inadequate maintenance of water systems coupled with optimal growth temperatures. Infection with Legionella sp. can cause legionellosis; either Legionnaires’ disease, the severe form involving pneumonia, or Pontiac fever, a self-limited flu-like illness without pneumonia.
On 25 August 2015, providers at California State Prison A noted an unusual number of inmates with pneumonia. Prior to identifying the etiological agent, the workup of inmates presenting with pneumonia included polymerase chain reaction (PCR) testing of nasopharyngeal swabs for Mycoplasma pneumonia, Chlamydia pneumonia, Legionella sp. and ten viral respiratory pathogens. On 27 August 2015, one inmate with pneumonia was confirmed with L. pneumophila serogroup 1 infection by urine antigen (Ag) and soon an additional 12 confirmed infections were identified. Inmates were encouraged to seek medical care for complaints of fever, respiratory or gastrointestinal symptoms. Those presenting with shortness of breath or a cough (with or without fever) or gastrointestinal symptoms with a fever received a chest radiograph and were tested with a urine Ag test and sputum culture. On 27 August 2015, the potable water system, showers, and cooling towers at Prison A were turned off, pending an investigation into the source. Because the prison could not be evacuated, portable toilets and showers, and refrigerator and freezer trucks, bottled drinking water and boxed meals prepared off-site were procured.
While cooling towers are a common source of Legionnaires’ disease outbreaks [Reference Garrison2], to our knowledge, outbreaks in correctional settings are rare and have not been reported on in detail. In contrast to typical community outbreaks in hotels and resorts, inmates in California state prisons have a high level of access to health care. We describe our findings from the epidemiological and environmental investigations.
Methods
Case definition
We defined a confirmed case as meeting the Centers for Disease Control and Prevention (CDC) case definition for laboratory-confirmed legionellosis [3], including those with clinically-confirmed pneumonia (Legionnaires’ disease) and without pneumonia (Pontiac fever). We defined a probable case as radiographically confirmed pneumonia without laboratory confirmation since pneumonia associated with Legionnares’ disease is indistinguishable from pneumonia from other causes [Reference Edelstein4]. We counted inmates who were under clinical surveillance for legionellosis as possible cases if they had negative urine Ag and chest radiographs. For the outbreak investigation, we included all confirmed and probable cases among inmates who were diagnosed while incarcerated in Prison A, with onsets of symptoms from 1 August through 15 September 2015, including about 2 incubation periods before and after the source of the exposure was halted.
Epidemiological investigation
We conducted an epidemiological investigation among inmates to identify the most likely source of the exposure and characterise morbidity. Nursing staff at Prison A entered demographic, clinical and laboratory information for inmates under observation into a database. We used the information in the database to determine inmates who had confirmed or probable cases. To assess the low proportion of lab-confirmed cases, we compared urine Ag-positive rates among those were hospitalised with those not hospitalised and among those who were tested before initiating treatment with those treated later.
We conducted case finding among employees, in collaboration with the local and state health public health departments, through surveillance of sick leave absences and reportable disease reports. The local health department followed up with employees to determine if they met the case definition for having a probable or confirmed case. If the local health department was unable to obtain documentation of chest radiographs and laboratory results, they collected employee self-reported pneumonia and test results. Since we did not have access to employee health records, we included only cases among inmates in our epidemiologic investigation.
To chart the course of the outbreak and determine if preventive measures (e.g. halting the use of the cooling towers) were effective, we updated an epidemiological curve (with the number of cases among inmates by onset date) daily. We calculated the most likely exposure period by applying a method described by the CDC [5] to the maximum incubation period (19 days) for Legionnaires’ disease [6]. We compared underlying illnesses among inmates with cases to the general population of inmates at Prison A using data from our inmate chronic conditions registry.
Environmental investigation
Our investigation focused on the water systems (e.g. the storage tank, the showers, and the cooling towers) at Prison A as the most likely sources of legionella. All water used at Prison A is from a single 3-million-gallon tank supplied by municipal water. Showers are flash heated at the point of use (e.g. in the housing unit). There are four cooling towers on the grounds, one near the kitchen, associated with the refrigerators and freezers, and three on the roof of the central clinical building, associated with the air conditioning of that building.
To determine the likely source of exposure, we collected information about possible mist exposures at the prison (through a tour of the prison grounds focused on the cooling towers and the potable water system) and conducted a descriptive study of inmates with probable or confirmed cases. We constructed a map of inmate cell locations at the time of onset and interviewed ill inmates using a standardised questionnaire with questions about activities that could expose the patients to steam or mist in the institution. We collected ambient air temperature data [7] to determine if the temperatures during the exposure period were conducive to legionella proliferation.
On 28 August 2015, state prison system facilities management staff collected water samples from: the municipal water storage tank (n = 2), the cooling towers (n = 4), and the sink (n = 1) and the shower (n = 1) in the cell of the inmate with the first confirmed case. One swab sample was collected from the housing unit near the cooling tower for the kitchen. On the 2nd and 3rd of September 2015, environmental consultants collected three water samples from the kitchen cooling tower, 97 potable water samples (including hot and cold water from sinks and showers in all housing blocks, the kitchen and the warden's house) and 15 swab samples from the Prison A grounds. Because the water had been drained from the cooling towers of the central clinical building, the consultants collected five samples of sludge (heavy biofilm) from the three towers.
On 11 September 2015, after the cooling towers had been cleaned following the Occupational Safety and Health Administration (OSHA) recommended procedure [8], the environmental consultants collected 12 water samples: three from each of the four cooling towers.
Statistical analysis
We detected differences in the frequencies of characteristics of interest between inmates with probable or confirmed cases with the general population of inmates in prison A using the Pearson's χ 2 test at a significance level of 0.05. We used SAS software (Version 9.4, Copyright © 2013 SAS Institute Inc., Cary, North Carolina, USA) for all statistical analyses.
Results
Epidemiological investigation
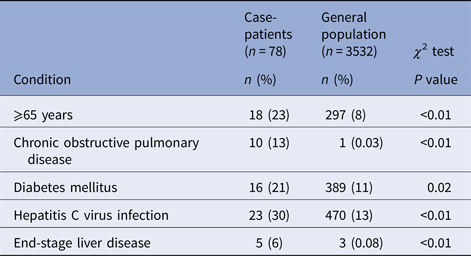
Onsets of illness for probable and confirmed cases among inmates were from 10 August through 15 September 2015, and illnesses peaked on 27 August 2015 (Fig. 1). Seventy-eight inmates had illnesses that met the case definition for probable Legionnaires’ disease (n = 64) or confirmed (n = 14) legionellosis; 13 inmates with confirmed cases had Legionnaires’ disease and one had no chest radiograph (Table 1). Of 62 probable or confirmed cases with urine Ag testing, 13 (21%) had a positive result. The 14th lab-confirmed case was urine Ag negative but had L. pneumophila serogroup 1 seroconversion. Of 122 other inmates evaluated for Legionnaires’ disease, 97 were possible cases; 42 had a chest radiograph only and 55 had a urine Ag and chest radiograph. Twenty-five inmates had a medical visit only. All sputum cultures (n = 48) and PCR tests (n = 22) for M. pneumonia and C. pneumonia and the panel of viral respiratory pathogens (n = 12) were negative. One sputum culture was PCR positive for Legionella of a non-pneumophila species. The calculated exposure period was 8–26 August 2015. Thirteen (17%) inmates were hospitalised (for 2–13 days); there were no deaths. We found a statistically-significant association of positive urine Ag test results with hospitalisation (55% positive in those hospitalised vs. 15% positive among those not hospitalised, P = 0.02) and a trend (non-significant association) of a lower positive rate among those tested after treatment was initiated (12% among those who were tested after starting treatment vs. 23% among those tested before treatment; P = 0.48). The median age of inmates with probable or confirmed cases was 56 years with a range of 25–83 years. Compared with the general population at Prison A, the inmates with probable or confirmed cases were more likely to be ⩾65 years old, have the chronic obstructive pulmonary disease (COPD), diabetes mellitus, hepatitis C virus infection, or end-stage liver disease (Table 2).
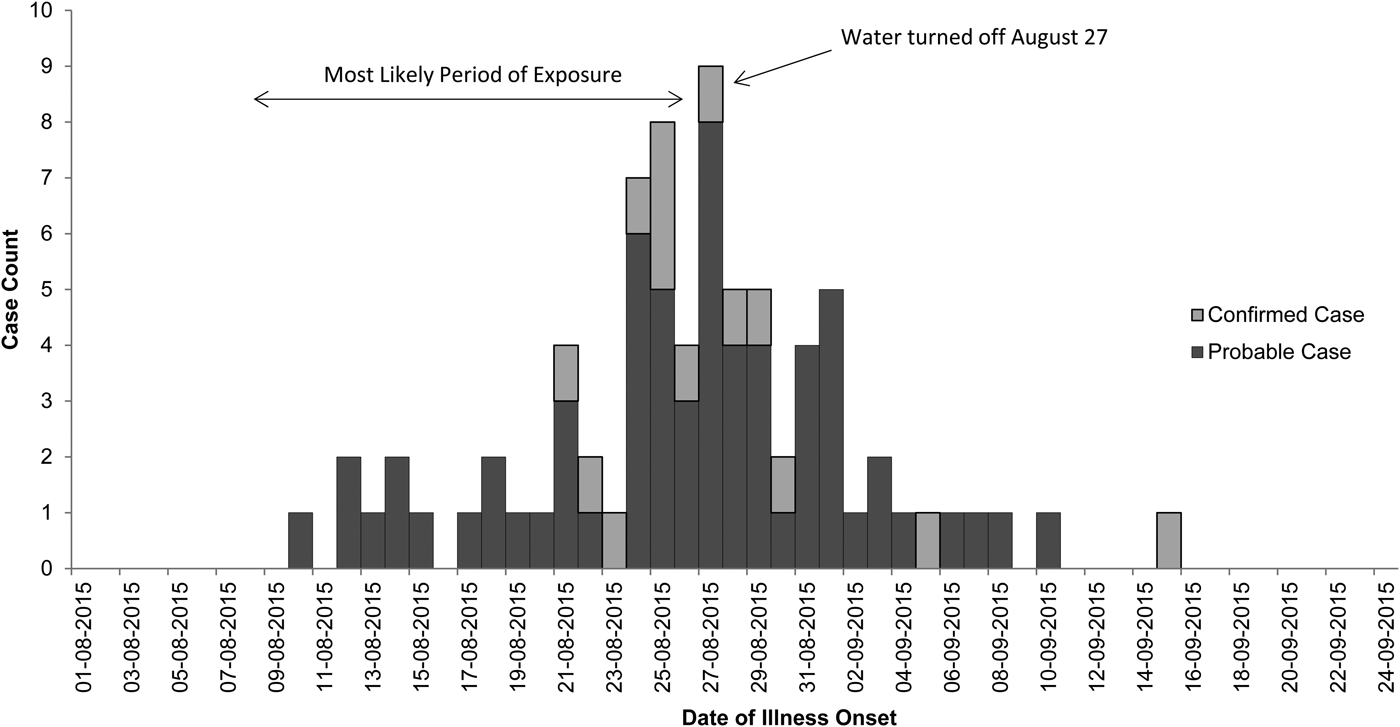
Fig. 1. Epidemiologic curve of confirmed and probable cases of legionellosis among inmates at California State Prison A, August 2015.
Table 1. Summary of chest radiograph and laboratory test data used in categorising inmates with symptoms compatible with legionellosis at California State Prison A, August 2015
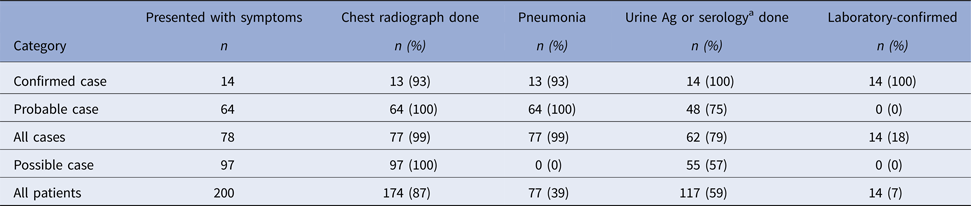
a One confirmed case with pneumonia had a negative urine Ag test but Legionella pneumophila serogroup 1 seroconversion.
Table 2. Underlying medical conditions among inmates with cases of confirmed or probable legionellosis compared with the general inmate population at California State Prison A, August 2015
We interviewed 59 inmates with probable or confirmed cases about exposures. During the 14 days prior to their illness onsets, all 59 ill inmates were either in-patient of the central clinical building or resided in one of ten housing units located throughout the prison grounds. Those inmates who resided in the clinical building were on a floor where an outside terrace door was commonly left open. The inmates with cases who resided in a housing unit either exercised in a nearby yard (n = 54; 92%) or walked close to the building (n = 38; 64%) on their way to medical and mental health appointments or to other activities. Nine (15%) inmates worked in the kitchen. All but one inmate showered in their housing unit. Within the housing units, the cells of the inmates were not clustered close to the showers.
We identified fifteen employees with symptoms clinically compatible with legionellosis. Among three who were hospitalised, one had probable Legionnaires’ disease, one had confirmed Legionnaires’ disease and one had lab-confirmed Pontiac fever. Based on self-report, the remaining 12 employees included one with confirmed Legionnaires’ disease, four with probable Legionnaires’ disease (including one with no urine Ag), four with negative urine Ag only, and three who were not evaluated for legionellosis.
Environmental investigation
The municipal water source had a chloramine concentration in the normal range and there were no coliforms. No records existed for maintenance of the cooling towers. The grates of the three cooling towers on the main central clinical building were coated with thick calcium carbonate scales and the fan of the southernmost tower had been inoperable for the preceding three months. After the water was drained from the cooling towers, an extensive amount of sludge remained in the cooling tower pans. The environmental consultant report, noting that all three of the cooling towers located on the top of the central clinical building showed sludge deposits and biofilm development, concluded that ‘maintenance activities associated with the safe operation of the cooling towers could have been better implemented.’
On 12 (63%) days of the calculated exposure period, recorded temperatures exceeded the historic average of 80 °F (27 °C). Near the midpoint of the exposure period (16 August 2015), the temperature rose to 101 °F (38 °C), the highest temperature ever recorded for that date for the city in which Prison A is located.
All three cooling towers for the central clinical building had L. pneumophila serogroup 1 in water, sludge or a swab specimen. The north cooling tower had a concentration of L. pneumophila serogroup 1 of 1200 colony forming units per millilitre (cfu/ml) in water, 420 000 cfu/gm in sludge, and the swab had 24 000 cfu/swab. The central cooling tower had 880 cfu/ml in the water, 400 000 cfu/gm in the sludge, and the swab had 16 800 cfu/swab. The south cooling tower had 96 000 cfu/ml in the sludge. In the potable water samples only one from inside a housing unit had detectable L. pneumophila serogroup 1 (at <1 cfu/ml); cultures of the kitchen cooling tower samples did not detect Legionella sp. The samples collected on 11 September 2015 from the cooling towers, after decontamination, were all negative for Legionella sp.
Discussion
In late August 2015, Prison A experienced a large outbreak of Legionnaires’ disease. The clinical presentations and laboratory test results are consistent with an outbreak due to L. pneumophila serogroup 1 infections. Sixty-four inmates had probable Legionnaires’ disease, 13 inmates had confirmed Legionnaires’ disease, and one inmate had confirmed legionnellosis (no chest radiograph was taken). Given that up to 5% of the general population and up to 14% of people in hospitals exposed to L. pneumophila develop Legionnaires’ disease [Reference Akbas and Yu9], at least 1560 inmates were likely exposed to L. pneumophila at Prison A. In addition to the confirmed and probable cases, there were 97 possible cases that were not included in our epidemiologic investigation, but likely were either legionellosis or other respiratory infections.
COPD, diabetes mellitus and older age are known risk factors for legionellosis [Reference Mandell, Benson and Dolin10]. Of note, is the association we found in this outbreak between confirmed or probable legionnellosis and chronic hepatitis C infection, and end-stage liver disease. These conditions result in impaired cell-mediated immunity [Reference Hodgson11, Reference Heim and Thimme12] which is the main defence mechanism against Legionella sp. infection [Reference Brown13]. The high prevalence of hepatitis C infection (13%) and end-stage liver disease (1%) in the general inmate population at the time of the outbreak may have allowed detection of associations with these conditions, which would be rare conditions among people exposed during outbreaks of Legionnaires’ disease in the community.
The low proportion of cases with laboratory confirmation in this outbreak is atypical. The urine Ag test has a sensitivity range of 70% to 90% [Reference Mercante and Winchell14] but was positive in only 21% of our tested cases. The most plausible explanations for the low proportion of positive tests are the low hospitalisation rate (morbidity), testing after initiating treatment and a less virulent strain of L. pneumophila [Reference Cunha, Burillo and Bouza15]. We found that case-patients hospitalised in this outbreak were over three times as likely to test positive compared with those not hospitalised, consistent with other reports that morbidity is associated with a higher confirmation rate with the urine Ag test [Reference Birtles16, Reference Yzerman17]. Although not statistically significant, we observed a trend of a lower positive rate among those who were tested after starting treatment. Finally, since the urine Ag test sensitivity varies by subgroup of L. pneumophila serogroup 1 organisms, this outbreak may have been due to a subgroup that is inherently less detectable. However, we could not assess this hypothesis because there were no clinical isolates.
Also unusual, is the lack of isolation of L. pneumophila from the case-patients despite submission of 48 sputum specimens for culture. Because L. pneumophila is a fastidious organism, a delay in placing specimens onto culture media permits growth of other competing organisms [Reference Jarraud18]. A two to 5-day delay in starting cultures (to allow for transport to the contracted laboratory) during which the specimens were refrigerated, rather than frozen to prohibit overgrowth, is the most plausible explanation for not obtaining any clinical isolates.
Outbreaks of Legionnaires’ disease require both: (1) conditions optimal for the proliferation of Legionella sp. in water; and (2) a mechanism to distribute contaminated water vapor to many people [Reference Fields, Benson and Besser1]. Large or complex water systems, such as water storage tanks and cooling/heating equipment typically found in institutional, multi-unit residential, industrial, and healthcare facilities, are common sources of community outbreaks of Legionnaires’ disease [Reference Garrison2]. Facilities that house or provide medical care for vulnerable populations (e.g. prisoners), by default, are considered to have complex water systems [Reference Garrison2]. Some common distribution mechanisms are aerosolisation from cooling towers, hot tubs, decorative fountains, shower heads, and respiratory therapy equipment [Reference van Heijnsbergen19].
When Legionella sp. proliferate in water in a cooling tower, the mist exhausted by fans from the tower will also be contaminated [8]. A review by the CDC found that a majority of Legionnaires’ disease outbreaks were associated with process failures (65%), e.g. an inadequate water management program, human errors (52%), equipment failures (35%), and/or an unmanaged external factor (35%) [Reference Garrison2]. Given nearly 90% of the reviewed outbreaks had at least one documented error or failure, CDC concluded that the most effective strategy for preventing outbreaks linked to cooling towers is to control the growth of Legionella sp. in complex water systems [Reference Garrison2].
Despite the unavailability of a clinical specimen, the environmental, laboratory and epidemiological evidence clearly implicated the cooling towers on the central clinical building as the source of the outbreak. The combination of dense biofilm within the towers and the high ambient temperatures in the weeks before the outbreak created an ideal environment for the proliferation of Legionella sp [Reference Garrison2, 20]. Water and sludge samples from those towers had high concentrations of L. pneumophila that were on average ten times the 100 cfu/ml concentration requiring prompt remediation [21]. One measurement of the concentration in the water from the cooling towers was 880 cfu/ml and the other was 1200 cfu/ml. Showers have been associated with legionellosis outbreaks in the past [Reference Cunha, Burillo and Bouza15, Reference Kutty22]. However, implicating the showers in this point-source outbreak would require the assumption of separate plumbing problems leading to conditions conducive to Legionella sp. proliferation (with biofilm formation) occurring simultaneously in each of ten housing units. The extensive testing of potable water which revealed L. pneumophila in only one specimen at a very low concentration (<1 cfu/ml) confirmed that the potable water was not responsible for the distribution of L. pneumophila at Prison A.
A major lesson learned, from the investigation of this outbreak, is that cooling towers that are not maintained pose a risk of Legionella sp. proliferation with resultant morbidity among inmates and staff. In this outbreak, we found deficiencies in three of the four categories identified by CDC [Reference Garrison2]: (1) there were no cooling tower maintenance records at Prison A (process failure); (2) a cooling tower fan had been inoperable for 3 months prior to the outbreak (equipment failure); and (3) above average or record warm weather during the exposure period (unmanaged external change). Of note, an extensive environmental assessment conducted by the state public health department in January 2015, did not include inspections or maintenance assessments of the cooling towers.
Based on our findings and experience investigating this outbreak, we have three general recommendations for prevention of Legionnaires’ disease in correctional settings. First, to prevent Legionella sp. proliferation, correctional facilities should have a local operating procedure (LOP) for maintaining cooling towers. As a result of this outbreak, Prison A developed a LOP for the maintenance of their cooling towers, which includes: (1) conducting bimonthly visual inspections; (2) using biocide and chlorine; (3) conducting microbiological analysis of cooling towers at least monthly; (4) cleaning and disinfecting cooling towers for HVAC, prior to start up (in April or May), 1 July, and prior to shut down (October or early November); and (5) cleaning the kitchen cooling tower every 90 days. In addition, facilities management directed all California state prisons to develop a LOP consistent with American Society of Heating, Refrigerating, and Air Conditioning Engineers (ASHRAE) guidelines for maintaining, testing and treating cooling towers [20]. Second, oversight of the maintenance of cooling towers should be a mainstay of environmental inspections and should be conducted at least yearly. In response to this outbreak, the state public health department, as part of their contracted inspections of state prison facilities, revised their environmental inspection protocol to include a review of the maintenance plan for cooling towers. Finally, clinicians should maintain vigilance for clusters of pneumonia accompanied by fever. If an increase in pneumonia is detected, clinicians should have a low threshold of testing for Legionella sp., using the urine Ag test. Testing for other causes of community-acquired pneumonia should also be done.
Acknowledgements
At California State Prison, San Quentin, we thank Warden Ron Davis, Chief Deputy Warden Kelly Mitchell, Dr Elena Tootell, Chief Medical Executive, and Dr Lisa Pratt for their timely and well-coordinated outbreak response and support of our investigations, Allyson Tabor, Public Health Nurse, for daily surveillance for legionellosis cases and collecting case-patient data, and Erin Walsh, Analyst, for designing and maintaining the clinical and laboratory databases. We thank Gregor Larabee, Construction and Maintenance Supervisor, from the California Department of Corrections and Rehabilitation, Facility Planning, Construction and Management, for collecting water samples and coordinating the efforts of contracted environmental consultants. We thank the Marin County Health and Human Services for assistance with the employee contact investigation. Finally, we thank Sharon Albers, Analyst in the California Correctional Health Care Services, Public Health Branch, for tracking confirmed and probable cases and generating epidemiological curves daily throughout the course of the outbreak.
Declaration of Interest
None.


