


1 Introduction
In inertial confinement fusion (ICF)[Reference Nuckolls, Wood, Thiessen and Zimmerman1] a target capsule containing a cryogenic deuterium–tritium (DT) ice layer and low-density DT gases is imploded directly by intense laser pulses[Reference McCrory, Meyerhofer, Betti, Craxton, Delettrez, Edgell, Glebov, Goncharov, Harding, Jacobs-Perkins, Knauer, Marshall, McKenty, Radha, Regan, Sangster, Seka, Short, Skupsky, Smalyuk, Soures, Stoeckl, Yaakobi, Shvarts, Frenje, Li, Petrasso and Séguin2] or indirectly by x-rays in a hohlraum[Reference Lindl3]. During a typical implosion, intense illumination of the target rapidly heats and ablates the outer capsule material. Conservation of momentum drives the remaining capsule material and fuel toward the center of the target sphere, where the initially gaseous fuel forms a ‘hot spot’ that ignites fusion reactions, which propagate radially outward through the main fuel layer[Reference Lindl3]. The ultimate goal of ICF is to ignite the imploding target capsule, producing net energy gain; however, during an implosion, hydrodynamic instabilities in the ablation front can reduce the energy yield by distorting the hot spot or dispersing the main fuel layer.
Currently, two main methods are being used to fill the ICF target capsule with DT fuel—fill-tube filling[Reference Kucheyev and Hamza4] and permeation filling[Reference Solomon and Henderson5]. In fill-tube filling, a small fill tube provides a connection between the empty target capsule and a reservoir of gaseous DT. A valve downstream of the supply is opened, and DT flows into the target capsule. Once the desired amount of DT is inside the target capsule, the supply is shut off.
Permeation filling has no fill-tube connection between the empty target capsule and a reservoir of gaseous DT. Instead, this method relies on the target capsule being permeable to DT at the filling temperature and nonpermeable at some lower temperature. A valve downstream of the supply is opened and, at a controlled pressure ramp rate, DT flows into a heated pressure vessel containing an empty target capsule. The buckling strength and permeability of the target capsule shell limit the rate of DT pressure rise[Reference Gram, Hobler, Lund and Harding6]. Once the desired amount of DT has entered the target capsule, corresponding to the maximum DT fill pressure, the supply valve is closed. The pressure vessel and target capsule are then cooled to a temperature at which the internal pressure will not cause the target capsule to rupture or leak extensively when DT in the chamber surrounding the target capsule is evacuated.
One common capsule material (i.e., ablator) used in permeation filling is made by using the glow-discharge polymerization (GDP) process[Reference Nikroo, Czechowicz, Castillo and Pontelandolfo7]. Alternate ablators such as beryllium, silicon, and high-density carbon (HDC) are of interest in ICF experiments that study hydrodynamic instabilities[Reference MacKinnon, Meezan, Ross, Le Pape, Berzak Hopkins, Divol, Ho, Milovich, Pak, Ralph, Döppner, Patel, Thomas, Tommasini, Haan, MacPhee, McNaney, Caggiano, Hatarik, Bionta, Ma, Spears, Rygg, Benedetti, Town, Bradley, Dewald, Fittinghoff, Jones, Robey, Moody, Khan, Callahan, Hamza, Biener, Celliers, Braun, Erskine, Prisbrey, Wallace, Kozioziemski, Dylla-Spears, Sater, Collins, Storm, Hsing, Landen, Atherton, Lindl, Edwards, Frenje, Gatu-Johnson, Li, Petrasso, Rinderknecht, Rosenberg, Séguin, Zylstra, Knauer, Grim, Guler, Merrill, Olson, Kyrala, Kilkenny, Nikroo, Moreno, Hoover, Wild and Werner8]. Unfortunately, target capsules made of these materials are not sufficiently permeable to DT to be used in permeation filling. A novel design combining the attributes of permeation and fill-tube filling, allowing the filling of these aforementioned targets, is described next.
2 Description of the permeation fill-tube design
The permeation fill-tube (PFT) target assembly is shown in Figure 1, while a more-detailed image of the upper portion of the assembly is shown in Figure 2. The gravity vector points down in these images. The geometry of the target support is driven by the requirement that the target capsule must be at the same elevation or lower than the permeation cell, and the support structure must not interfere with the laser beams.

Figure 1. PFT target assembly.

Figure 2. Detailed view of the upper portion of a PFT target assembly.
Figure 3 shows a typical PFT assembly. The permeation cell is connected to the target capsule by a fill tube with adhesive joints. The fill tube itself is made of two separate tubes that are also glued together. The larger-diameter tube is fused silica with an outer polymeric coating and has an outer diameter (OD) of 0.15 mm and inner diameter (ID) of 0.10 mm. The smaller-diameter tube is borosilicate glass and is tapered from an OD of 0.1 mm and ID of 0.080 mm to an OD of 0.030 mm and ID of 0.022 mm.

Figure 3. PFT assembly. (All dimensions are in millimeters.)
The PFT method combines attributes of fill-tube filling[Reference Kucheyev and Hamza4] and permeation filling[Reference Solomon and Henderson5]. Here the target capsule is nonpermeable to DT while the permeation cell is permeable to DT at the filling temperature and nonpermeable at some lower temperature. A valve downstream of the supply is opened and, at a controlled pressure ramp rate, DT flows into a heated pressure vessel containing an empty PFT target assembly (shown in Figure 1). The buckling strength and permeability of the target capsule shell limit the rate of DT pressure rise[Reference Gram, Hobler, Lund and Harding6]. DT flows through the permeation cell’s shell through the fill tube and into the target capsule. At a steady state the gas pressure is equal in both capsules. Once the desired amount of DT has entered the PFT assembly, corresponding to the maximum DT fill pressure, the supply valve is closed. The pressure vessel and the PFT target assembly are then cooled to a temperature at which the internal assembly’s pressure will not cause the target capsule or the permeation cell to rupture or leak appreciably when DT in the chamber surrounding the PFT assembly is finally evacuated.
The heater glued to the fill tube (shown in Figures 1 and 2) is a microchip resistor (ERJ-XGNF1–1Y) capable of delivering up to ${\sim}1$
mW. The heater creates a pressure delta to drive more fuel into the target capsule than the permeation cell during the layering process.
${\sim}1$
mW. The heater creates a pressure delta to drive more fuel into the target capsule than the permeation cell during the layering process.
The initial PFT assembly with an HDC target capsule, used for manufacturing studies, is shown in Figure 4(a). The PFT assembly used for layering studies had GDP capsules for both the permeation cell and the target capsule [see Figure 4(b)]. Both GDP capsules had an OD of 0.430 mm, with wall thicknesses of 0.022 and 0.008 mm for the permeation cell and the target capsule, respectively. Optical backlit shadowgraphic characterization, with submicron resolution, was used to measure cryogenic target ice layers[Reference Edgell, Seka, Craxton, Elasky, Harding, Keck, Pandina, Wittman and Warrick9]. Nonpermeable ablators, such as beryllium, silicon, and HDC, since, because of their opacity to visible light, have non-visible ice layers with shadowgraphic characterization. The target capsule was made from GDP so the ice layer would be visible for layering studies. Visualization allowed ice-layer quality of a target connected to two sources of DT to be studied, and if leak free DT containment at cryogenic temperatures could be achieved; both of which are key attributes of ICF targets. (Whether one or both of the capsules is permeable impacts the time required to fill. Fill time estimates are easily modeled[Reference Gram, Hobler, Lund and Harding6] and not of interest in this paper.)

Figure 4. (a) Image of a PFT target assembly with a GDP permeation cell and HDC nonpermeable target capsule; (b) image of a PFT assembly with a GDP permeation cell and GDP target capsule.
3 PFT layering process
The PFT assembly is located inside a copper layering sphere filled with helium (see Figure 5). Initially DT in the PFT assembly is rapidly cooled ( ${\sim}1~\text{K}~\text{s}^{-1}$
) to several degrees below its triple point. Next, the temperature of the copper layering sphere is gradually raised until all of the solid DT in the target capsule is gone and the solid DT in the fill-tube section nearest the target capsule begins to melt. At this point the temperature of the layering sphere is dropped
${\sim}1~\text{K}~\text{s}^{-1}$
) to several degrees below its triple point. Next, the temperature of the copper layering sphere is gradually raised until all of the solid DT in the target capsule is gone and the solid DT in the fill-tube section nearest the target capsule begins to melt. At this point the temperature of the layering sphere is dropped ${\sim}0.001$
mK every 15 min. This causes the DT to solidify and an ice crystal ‘seed’ to grow out of the fill tube into the target capsule. The initial growth of a single ring (shown in Figure 6) indicates that, as the temperature continues to drop, the final ice layer will contain a single hexagonal close-packed (hcp) crystal, as required for high-yield ICF implosions[Reference Sangster, Betti, Craxton, Delettrez, Edgell, Elasky, Glebov, Goncharov, Harding, Jacobs-Perkins, Janezic, Keck, Knauer, Loucks, Lund, Marshall, McCrory, McKenty, Meyerhofer, Radha, Regan, Seka, Shmayda, Skupsky, Smalyuk, Soures, Stoeckl, Yaakobi, Frenje, Li, Petrasso, Séguin, Moody, Atherton, MacGowan, Kilkenny, Bernat and Montgomery10].
${\sim}0.001$
mK every 15 min. This causes the DT to solidify and an ice crystal ‘seed’ to grow out of the fill tube into the target capsule. The initial growth of a single ring (shown in Figure 6) indicates that, as the temperature continues to drop, the final ice layer will contain a single hexagonal close-packed (hcp) crystal, as required for high-yield ICF implosions[Reference Sangster, Betti, Craxton, Delettrez, Edgell, Elasky, Glebov, Goncharov, Harding, Jacobs-Perkins, Janezic, Keck, Knauer, Loucks, Lund, Marshall, McCrory, McKenty, Meyerhofer, Radha, Regan, Seka, Shmayda, Skupsky, Smalyuk, Soures, Stoeckl, Yaakobi, Frenje, Li, Petrasso, Séguin, Moody, Atherton, MacGowan, Kilkenny, Bernat and Montgomery10].

Figure 5. PFT assembly located inside a copper layering sphere.

Figure 6. Image of single crystal seed that grows out of the fill tube. The initial growth of a single ring is indicative of a final ice layer that will be composed of a single hcp crystal, which is required for high-yield ICF implosions[Reference Sangster, Betti, Craxton, Delettrez, Edgell, Elasky, Glebov, Goncharov, Harding, Jacobs-Perkins, Janezic, Keck, Knauer, Loucks, Lund, Marshall, McCrory, McKenty, Meyerhofer, Radha, Regan, Seka, Shmayda, Skupsky, Smalyuk, Soures, Stoeckl, Yaakobi, Frenje, Li, Petrasso, Séguin, Moody, Atherton, MacGowan, Kilkenny, Bernat and Montgomery10].
Layering experiments were successful using the same layering protocol as existing stalk-mounted (non-fill-tube) targets. An image of the resulting single-hcp-crystal ice layer characterized by optical backlit shadowgraphy is shown in Figure 7(a). The inner ice surface roughness is 1- $\unicode[STIX]{x03BC}$
m rms (root mean square) and the average ice thickness is
$\unicode[STIX]{x03BC}$
m rms (root mean square) and the average ice thickness is $61~\unicode[STIX]{x03BC}\text{m}$
. Figure 7(b) shows the inner ice surface radius in red and outer ice surface radius in blue. The difference between the blue curve and the red curve is the ice thickness. (A smaller radius of the inner ice surface, shown in red, corresponds to a thicker ice layer.) The image is unwrapped with the zero position referring to the 3:00 position in Figure 7(a). The stalk position is
$61~\unicode[STIX]{x03BC}\text{m}$
. Figure 7(b) shows the inner ice surface radius in red and outer ice surface radius in blue. The difference between the blue curve and the red curve is the ice thickness. (A smaller radius of the inner ice surface, shown in red, corresponds to a thicker ice layer.) The image is unwrapped with the zero position referring to the 3:00 position in Figure 7(a). The stalk position is ${\sim}50^{\circ }$
, leading to thick ice near the fill tube (highlighted). The test ice layer is significantly thicker near the fill tube because of the higher (
${\sim}50^{\circ }$
, leading to thick ice near the fill tube (highlighted). The test ice layer is significantly thicker near the fill tube because of the higher ( ${\sim}6\times$
) thermal conductivity of borosilicate glass compared to helium. From Figure 7(b) it appears that the maximum variation in ice thickness near the fill tube is
${\sim}6\times$
) thermal conductivity of borosilicate glass compared to helium. From Figure 7(b) it appears that the maximum variation in ice thickness near the fill tube is ${\sim}7~\unicode[STIX]{x03BC}\text{m}$
, but it is actually larger because the fill tube obscures the shadowgraph data, causing the image analysis to fail in this area. From Figure 7(b), the effect of the fill tube is seen over
${\sim}7~\unicode[STIX]{x03BC}\text{m}$
, but it is actually larger because the fill tube obscures the shadowgraph data, causing the image analysis to fail in this area. From Figure 7(b), the effect of the fill tube is seen over ${\sim}\pm 23^{\circ }$
on either side of the fill tube. The thick spot will be discussed further in the next section.
${\sim}\pm 23^{\circ }$
on either side of the fill tube. The thick spot will be discussed further in the next section.

Figure 7. (a) An image of a final single-hcp-crystal ice layer characterized by optical backlit shadowgraphy; (b) the inner ice surface radius is shown in red and the outer ice surface radius in blue.
It is possible to control the relative pressure of DT in the two capsules by using the PFT heater located near the permeation cell shown in Figure 2. With the heater turned on and the layering-sphere temperature above the critical point of DT, ${\sim}40$
K, gas is preferentially driven toward the target capsule. Next, the DT in the layering sphere is rapidly cooled (
${\sim}40$
K, gas is preferentially driven toward the target capsule. Next, the DT in the layering sphere is rapidly cooled ( ${\sim}1~\text{K}~\text{s}^{-1}$
) several degrees below DT’s triple point, causing the DT in the target capsule and the fill tube’s end attached to the target capsule to freeze. At this point the PFT heater is turned off and the layering process described previously can begin. As long as the ice plug remains in the fill tube during the subsequent layering process, the amount of DT in the target capsule will remain constant. (The heater was not used in the layering studies reported on in this paper.)
${\sim}1~\text{K}~\text{s}^{-1}$
) several degrees below DT’s triple point, causing the DT in the target capsule and the fill tube’s end attached to the target capsule to freeze. At this point the PFT heater is turned off and the layering process described previously can begin. As long as the ice plug remains in the fill tube during the subsequent layering process, the amount of DT in the target capsule will remain constant. (The heater was not used in the layering studies reported on in this paper.)
4 Heat-transfer model
A heat-transfer model to predict ice layering uniformity for PFT ICF targets was developed. This model includes effects of the layering sphere, fill tube, glue spot, DT, and target capsule geometry and material properties on ice-layer-thickness uniformity at ${\sim}20$
K. This model uses similar modeling techniques that have been previously used to predict ice layering uniformity for permeation filled ICF stalk-mounted[Reference Alfonso, Anteby and Harding11] and fill-tube filled ICF hohlraum mounted targets[Reference Sanchez and Giedt12]. Unlike the previously referenced work, the PFT model includes the effect of the target fill tube on ice layering uniformity. In addition, numerical modeling data is compared to empirical ice layering thickness uniformity data.
${\sim}20$
K. This model uses similar modeling techniques that have been previously used to predict ice layering uniformity for permeation filled ICF stalk-mounted[Reference Alfonso, Anteby and Harding11] and fill-tube filled ICF hohlraum mounted targets[Reference Sanchez and Giedt12]. Unlike the previously referenced work, the PFT model includes the effect of the target fill tube on ice layering uniformity. In addition, numerical modeling data is compared to empirical ice layering thickness uniformity data.
The DT solid/gas phase boundary is represented by an isotherm at DT’s triple point of ${\sim}19.7$
K. The PFT temperature profile was modeled by a finite volume method (FVM) using ANSYS FLUENT v16. A two-dimensional axisymmetric model of the PFT target assembly inside a 1-in.-diam copper layering sphere filled with
${\sim}19.7$
K. The PFT temperature profile was modeled by a finite volume method (FVM) using ANSYS FLUENT v16. A two-dimensional axisymmetric model of the PFT target assembly inside a 1-in.-diam copper layering sphere filled with ${\sim}2$
Torr of helium was constructed. The model includes both capsules; the fill tube; the glue spot connecting the target capsule to the fill tube; DT decay heating; and sublimation/deposition of DT in the permeation cell, fill tube, and target capsule. The layering sphere was treated as a complete surface and is represented by a uniform-temperature boundary condition. Holes in the layering sphere were ignored, so a computationally efficient axisymmetric model can be used.
${\sim}2$
Torr of helium was constructed. The model includes both capsules; the fill tube; the glue spot connecting the target capsule to the fill tube; DT decay heating; and sublimation/deposition of DT in the permeation cell, fill tube, and target capsule. The layering sphere was treated as a complete surface and is represented by a uniform-temperature boundary condition. Holes in the layering sphere were ignored, so a computationally efficient axisymmetric model can be used.
Decay heating of DT causes the target to be hotter than its surroundings. Helium was used to conduct the heat generated by DT to the surrounding copper sphere. In the model, DT can exist in only one of two phases – solid or gaseous. The sublimation/deposition temperature used for DT was 19.7 K. Initial models used FLUENT’s two-phase routines. Since only steady-state results were of interest, a more-efficient solution procedure was developed. Using user-defined DT material properties (density and conductivity) that were a function of temperature yielded identical steady-state results as FLUENT’s two-phase routine and were more efficient to run. Both solution procedures model only heat transfer by conduction, and mass conservation is not automatically taken into account. In either modeling method, conservation of DT mass is controlled by a manual iterative process. Knowing the actual total mass of DT in the PFT assembly, the layering sphere’s fixed-temperature boundary condition can be adjusted until the desired mass of DT contained in the PFT assembly is obtained.
Figure 8 shows the model geometry. The outer portion of the DT physically touching the target capsule shell uses a cell size of $1~\unicode[STIX]{x03BC}\text{m}\times 1~\unicode[STIX]{x03BC}\text{m}$
to resolve the gas/ice phase boundary (shown in Figure 9). Other areas of the model use a coarser mesh for a more-efficient solution. Based on a mesh refinement study, the results presented are mesh independent. Thermal conductivities at
$1~\unicode[STIX]{x03BC}\text{m}\times 1~\unicode[STIX]{x03BC}\text{m}$
to resolve the gas/ice phase boundary (shown in Figure 9). Other areas of the model use a coarser mesh for a more-efficient solution. Based on a mesh refinement study, the results presented are mesh independent. Thermal conductivities at ${\sim}20$
K are 0.0255, 0.009, 0.35, 0.05, 0.333, 0.15, 0.15, and
${\sim}20$
K are 0.0255, 0.009, 0.35, 0.05, 0.333, 0.15, 0.15, and $59~\text{W}~\text{m}^{-1}~\text{K}^{-1}$
for He[Reference Vargaftik, Filippov, Tarzimanov and Totskii13], DT gas[Reference Souers14], DT solid[Reference Souers14], GDP plastic shell[15], Stycast 1266[Reference Laumann, Ikeda, Sassik, Prokofiev and Paschen16], fused silica[17], borosilicate glass[17], and beryllium[18], respectively. Densities are 0.0065, 0.7, 260, 1420, 1120, 2640, 2640, and
$59~\text{W}~\text{m}^{-1}~\text{K}^{-1}$
for He[Reference Vargaftik, Filippov, Tarzimanov and Totskii13], DT gas[Reference Souers14], DT solid[Reference Souers14], GDP plastic shell[15], Stycast 1266[Reference Laumann, Ikeda, Sassik, Prokofiev and Paschen16], fused silica[17], borosilicate glass[17], and beryllium[18], respectively. Densities are 0.0065, 0.7, 260, 1420, 1120, 2640, 2640, and $1851~\text{kg}~\text{m}^{-3}$
for He, DT gas, DT solid, GDP plastic shell, Stycast 1266, fused silica, borosilicate glass, and beryllium, respectively. A user-defined function (UDF) was used for the
$1851~\text{kg}~\text{m}^{-3}$
for He, DT gas, DT solid, GDP plastic shell, Stycast 1266, fused silica, borosilicate glass, and beryllium, respectively. A user-defined function (UDF) was used for the $200~\text{W}~\text{kg}^{-1}$
decay heat of DT[Reference Souers14]. (Note: Borosilicate glass conductivity was used for fused silica and polyimide conductivity was used for the GDP capsule because of the lack of cryogenic material property data.)
$200~\text{W}~\text{kg}^{-1}$
decay heat of DT[Reference Souers14]. (Note: Borosilicate glass conductivity was used for fused silica and polyimide conductivity was used for the GDP capsule because of the lack of cryogenic material property data.)

Figure 8. Model geometry near the target capsule.

Figure 9. Image of the fine mesh required to resolve the solid/gas phase boundary near the target capsule.
Figure 10 shows temperature contours predicted by the model. The temperature is hottest at the center of the target (radioactive decay) and coldest at the isothermal boundary condition representing the copper layering sphere. Figure 11 illustrates the resulting solid/gas phase boundary predicted by the model (DT ice is shown in red). Figure 12 is an unwrapped image of the model ice thickness overlaid on the measured ice thickness of the layer in the experimental PFT target; the fill tube is located at ${\sim}50^{\circ }$
. The model thickness profile is very similar to experimental results. One difference is that the actual ice layer shows a thick spot in the ice above the hole in the layering sphere (required to insert the target into the layering sphere). The hole cannot be modeled since the axis for the axisymmetric model is aligned with the fill tube. The thermal model estimates the peak thickness variation to be
${\sim}50^{\circ }$
. The model thickness profile is very similar to experimental results. One difference is that the actual ice layer shows a thick spot in the ice above the hole in the layering sphere (required to insert the target into the layering sphere). The hole cannot be modeled since the axis for the axisymmetric model is aligned with the fill tube. The thermal model estimates the peak thickness variation to be ${\sim}17~\unicode[STIX]{x03BC}\text{m}$
near the fill tube, and the effect of the fill tube is apparent
${\sim}17~\unicode[STIX]{x03BC}\text{m}$
near the fill tube, and the effect of the fill tube is apparent ${\sim}\pm 20^{\circ }$
on either side. The model accurately predicts the uniformity of the actual ice-layer thickness. This verifies that this modeling methodology can be used to provide estimates of ice uniformity for other ICF target designs.
${\sim}\pm 20^{\circ }$
on either side. The model accurately predicts the uniformity of the actual ice-layer thickness. This verifies that this modeling methodology can be used to provide estimates of ice uniformity for other ICF target designs.

Figure 10. Modeled temperature contours of the target and copper layering sphere.
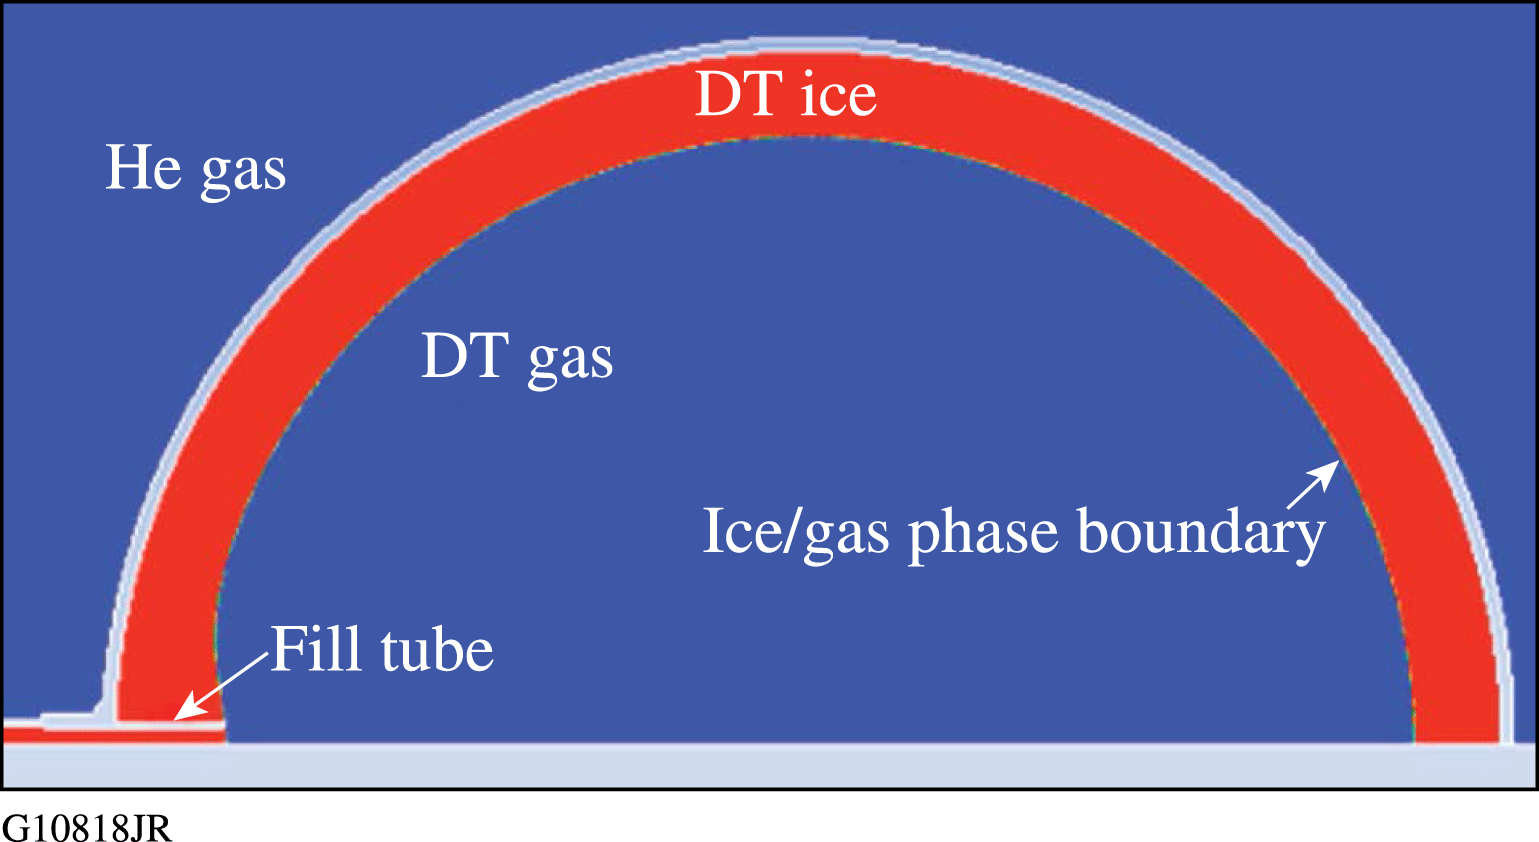
Figure 11. The ice/gas phase boundary predicted by the model (DT ice is shown in red).

Figure 12. Unwrapped image of the model prediction of ice thickness overlaid on actual ice thickness; the fill tube is located at ${\sim}50^{\circ }$
.
${\sim}50^{\circ }$
.

Figure 13. Unwrapped image of the model prediction of ice thickness for three different fill-tube cross-sections with a GDP shell having a thermal conductivity of $0.05~\text{W}~\text{m}^{-1}~\text{K}^{-1}$
.
$0.05~\text{W}~\text{m}^{-1}~\text{K}^{-1}$
.
Three critical design parameters affecting ice-layer uniformity are (1) the fill tube’s size, (2) the target shell’s thermal conductivity, and (3) the fill tube’s thermal conductivity. The decay heat from the target is conducted (radially) away from the target shell. Nonuniformities in this conduction path distort the isotherms, resulting in ice-thickness nonuniformity. If the isotherms were perfectly concentric about the target shell, the ice thickness would be uniform. The thermal conductivity of borosilicate glass is ${\sim}6\times$
higher than helium, causing a cold spot near the fill tube that results in locally thicker ice. Minimizing the borosilicate glass cross-sectional area or its thermal conductivity will minimize this effect. Less obvious is the effect of shell conductivity on ice-thickness uniformity. The fill tube causes temperature variations in the
${\sim}6\times$
higher than helium, causing a cold spot near the fill tube that results in locally thicker ice. Minimizing the borosilicate glass cross-sectional area or its thermal conductivity will minimize this effect. Less obvious is the effect of shell conductivity on ice-thickness uniformity. The fill tube causes temperature variations in the $\unicode[STIX]{x1D703}$
direction in the axisymmetric model, resulting in nonconcentric isotherms. When the shell has high thermal conductivity, it ‘short circuits’ the
$\unicode[STIX]{x1D703}$
direction in the axisymmetric model, resulting in nonconcentric isotherms. When the shell has high thermal conductivity, it ‘short circuits’ the $\unicode[STIX]{x1D703}$
temperature variations, resulting in more-concentric isotherms.
$\unicode[STIX]{x1D703}$
temperature variations, resulting in more-concentric isotherms.
Here we use the model to quantify the effect of alternate target designs on ice-layer nonuniformities near the fill tube. First we investigate the effect of a fill tube’s cross-sectional area on the ice-thickness uniformity near the fill tube. The effect of borosilicate fill-tube size on ice-thickness uniformity with a GDP (low thermal conductivity of $0.05~\text{W}~\text{m}^{-1}~\text{K}^{-1}$
) shell is shown in Figure 13. The fill-tube size has a significant effect on variations in ice-layer thickness near the fill tube. The variation decreases from
$0.05~\text{W}~\text{m}^{-1}~\text{K}^{-1}$
) shell is shown in Figure 13. The fill-tube size has a significant effect on variations in ice-layer thickness near the fill tube. The variation decreases from ${\sim}30\%$
for the 30-
${\sim}30\%$
for the 30- $\unicode[STIX]{x03BC}$
m-OD fill tube to
$\unicode[STIX]{x03BC}$
m-OD fill tube to ${\sim}10\%$
for the 10-
${\sim}10\%$
for the 10- $\unicode[STIX]{x03BC}$
m-OD fill tube.
$\unicode[STIX]{x03BC}$
m-OD fill tube.
The effect of the shell’s thermal conductivity for a 20- $\unicode[STIX]{x03BC}$
m-OD, 10-
$\unicode[STIX]{x03BC}$
m-OD, 10- $\unicode[STIX]{x03BC}$
m-ID borosilicate fill tube with
$\unicode[STIX]{x03BC}$
m-ID borosilicate fill tube with $20~\unicode[STIX]{x03BC}\text{m}$
of penetration into the shell is shown in Figure 14. The shell’s thermal conductivity has a significant effect on variations in ice-layer thickness near the fill tube. (Bulk beryllium at
$20~\unicode[STIX]{x03BC}\text{m}$
of penetration into the shell is shown in Figure 14. The shell’s thermal conductivity has a significant effect on variations in ice-layer thickness near the fill tube. (Bulk beryllium at ${\sim}20$
K has a thermal conductivity of
${\sim}20$
K has a thermal conductivity of ${\sim}59~\text{W}~\text{m}^{-1}~\text{K}^{-1}$
and was chosen as the upper limit.)
${\sim}59~\text{W}~\text{m}^{-1}~\text{K}^{-1}$
and was chosen as the upper limit.)

Figure 14. Unwrapped image of the model prediction of ice thickness for three different shell thermal conductivities with a 20- $\unicode[STIX]{x03BC}$
m-OD, 10-
$\unicode[STIX]{x03BC}$
m-OD, 10- $\unicode[STIX]{x03BC}$
m-ID borosilicate fill tube.
$\unicode[STIX]{x03BC}$
m-ID borosilicate fill tube.
Ice uniformity for PFT, fill-tube, and stalk-mounted ICF target designs can be predicted using thermal models. A two-dimensional, radiation hydrodynamics code like DRACO[Reference Hu, Goncharov, Radha, Marozas, Skupsky, Boehly, Sangster, Meyerhofer and McCrory19] can be used to predict the effect of ice layering uniformity on implosion yields. Use of these two models will allow alternate ICF target designs to be vetted numerically prior to running empirical ICF experiments.
5 Conclusions
An ICF target has been successfully filled and a leak free 1- $\unicode[STIX]{x03BC}$
m-rms DT ice layer has been developed using a novel fill design that combines attributes of permeation and fill-tube filling. The PFT target allows permeation filling to be used to fill permeable and nonpermeable target capsules with hollow fill tubes, and permeable target capsules with solid support stalks. Currently both fill-tube and permeation filling stations are required to fill the aforementioned target capsule and fill-tube combinations. Finally, a numerical model has been presented that accurately predicts empirical data of ice nonuniformities near the fill tube. Using this model, target designs with improved ice-thickness uniformity have been proposed.
$\unicode[STIX]{x03BC}$
m-rms DT ice layer has been developed using a novel fill design that combines attributes of permeation and fill-tube filling. The PFT target allows permeation filling to be used to fill permeable and nonpermeable target capsules with hollow fill tubes, and permeable target capsules with solid support stalks. Currently both fill-tube and permeation filling stations are required to fill the aforementioned target capsule and fill-tube combinations. Finally, a numerical model has been presented that accurately predicts empirical data of ice nonuniformities near the fill tube. Using this model, target designs with improved ice-thickness uniformity have been proposed.
Acknowledgements
This material is based upon work supported by the Department of Energy National Nuclear Security Administration under Award Number DE-NA0001944, the University of Rochester, and the New York State Energy Research and Development Authority. This report was prepared as an account of work sponsored by an agency of the US Government. Neither the US Government nor any agency thereof, nor any of their employees, makes any warranty, express or implied, or assumes any legal liability or responsibility for the accuracy, completeness, or usefulness of any information, apparatus, product, or process disclosed, or represents that its use would not infringe privately owned rights. Reference herein to any specific commercial product, process, or service by trade name, trademark, manufacturer, or otherwise does not necessarily constitute or imply its endorsement, recommendation, or favoring by the US Government or any agency thereof. The views and opinions of authors expressed herein do not necessarily state or reflect those of the US Government or any agency thereof.


 Open access