


Introduction
Stomata play an important role in life on Earth. They regulate the flow of gases and water vapor through a plant's epidermis in response to environmental stimuli and thus affect the health of the plant. Scientists study all aspects of the location, density, function, vulnerabilities, and susceptibilities of stomata. Some study stomata to provide clues to Earth's past and present environment in order to understand climate change. Others study them to understand how to maximize crop yields, reduce the opportunity for forest fires, maximize water use efficiency, and minimize the intrusion of pathogens into plants.
Leaves of terrestrial plants generally have more stomata on their undersides. Floating leaves of aquatic plants have stomata only on their upper surfaces, while some underwater plants have no stomata at all. In some flowering plants (monocots, such as grasses) stomata are generally oriented similarly to one-another. In other flowering plants (dicots, such as roses) stomata are randomly oriented.
A leaf contains several types of plant cells that serve various functions (Figure 1). One particular kind of cell is called a “guard cell.” Guard cells are specialized cells that form a pair of lips at the periphery of each stoma. Guard cells swell and shrink based on conditions within a plant. When guard cells swell, they open a stoma on the surface of a leaf, as shown in Figure 1a. Water vapor and gases can flow through an open stoma to and from the interior of a plant. When guard cells lose water and shrink, as shown in Figure 1b, they close the stoma and prevent the loss of water vapor and limit gas exchange. Processes that control the opening and closing of stomata are discussed in references [1–Reference Martins8].
Figure 1: Schematic representations of a leaf. Cross-sectional views (left) and plan views (right) of a single stoma (a) open and (b) closed on the underside of a leaf.
Most plants around the world have stomata that can be seen with a microscope. Locating leaf samples, preparing them, and observing them with light microscopy is a very effective and inexpensive way of introducing students to science and the study of global environmental and agricultural questions.
Reasons for Studying Stomata
Climate change
Scientists are studying and comparing stomatal densities (Figure 2) in recent leaves and fossil leaves in order to better understand the effects and implications of global warming [Reference McElwain and Chaloner2,Reference Brodribb and McAdam3].
Figure 2: Detection of stomata for density measurements on a leaf of the Blue Glow Agave plant. (a) Specimen prepared by leaf peeling, and (b) varnish replica of leaf surface showing stronger image contrast on a similar field of view. The leaf axis is vertical in these pictures.
Water use efficiency of plants
One group of scientists proposes manipulating stomatal function using combinations of physiological and molecular genetic methods in order to improve water use efficiency in plants. This is especially important regarding drought. In one paper the authors put it this way [Reference Lawson and Blatt4]: “Improving plant WUE [water use efficiency] and a plant's ability to cope with reduced water availability is high on the scientific agenda. Stomata ultimately control 95% of all gaseous fluxes between the leaf and the environment. It follows that stomata represent an attractive target for manipulations aimed at reducing water loss.”
Plant classification
Plant types are classified by the sizes, shapes, and arrangements of their stomata [Reference Van Cotthem5].
Uptake of nutrients and chemical treatments
Foliar fertilization is sometimes used in addition to ground fertilization. In foliar fertilization, nutrients and chemical treatments are applied to the leaves of a plant where they are absorbed through the leaf surface and through the stomata. Understanding of the role and behavior of stomata provides guidance that can lead to successful foliar fertilization [Reference Fernandez and Eichert6].
Plant diseases
Some pathogens can modulate stomatal behavior, causing the stomata to open so that the pathogens can enter the plant. For example, Salmonella enterica stimulate lettuce guard cells and penetrate through their stomata. Research directed toward understanding pathogen modulation of stomatal defenses could lead to new strategies for the prevention of plant diseases [Reference Gudesblat7].
Fires
Planting selected species of trees could help reduce wildfire risk. For example, the arrangement of stomata in the leaves of the Mediterranean cypress allows this tree to retain a high water content even in conditions of high heat and drought, possibly reducing fire risk [Reference Martins8].
This article shows how stomata can be studied in detail with inexpensive equipment found in many high school biology labs. Since stomata open and close in response to various stimuli, a number of experiments can be configured in class demonstrations or as science projects designed by individual students.
Materials and Methods
Microtopographic representations of leaves
Much of the light microscopy literature shows stomata in a two-dimensional format. Scanning electron microscopy (SEM) can show stomata in highly detailed images with great depth of field. Although SEM images are of high quality, the preparation required for electron microscopy limits the rate at which images can be produced.
The images in Figures 3–6 were taken using light microscopy with the addition of focus stacking software [9] to rapidly produce all-in-focus (high depth-of-field) images of planar and oblique views. Figures 4a and 4b are red-cyan stereo anaglyphs that show oblique representations of the surface. Heights of various features were measured above or below a local datum in a planar view using the light microscope without focus stacking (Figure 4b). Koehler illumination was used. Figures 3, 5, and 6 show stomata from three different plants that grow in and around San Francisco, California.
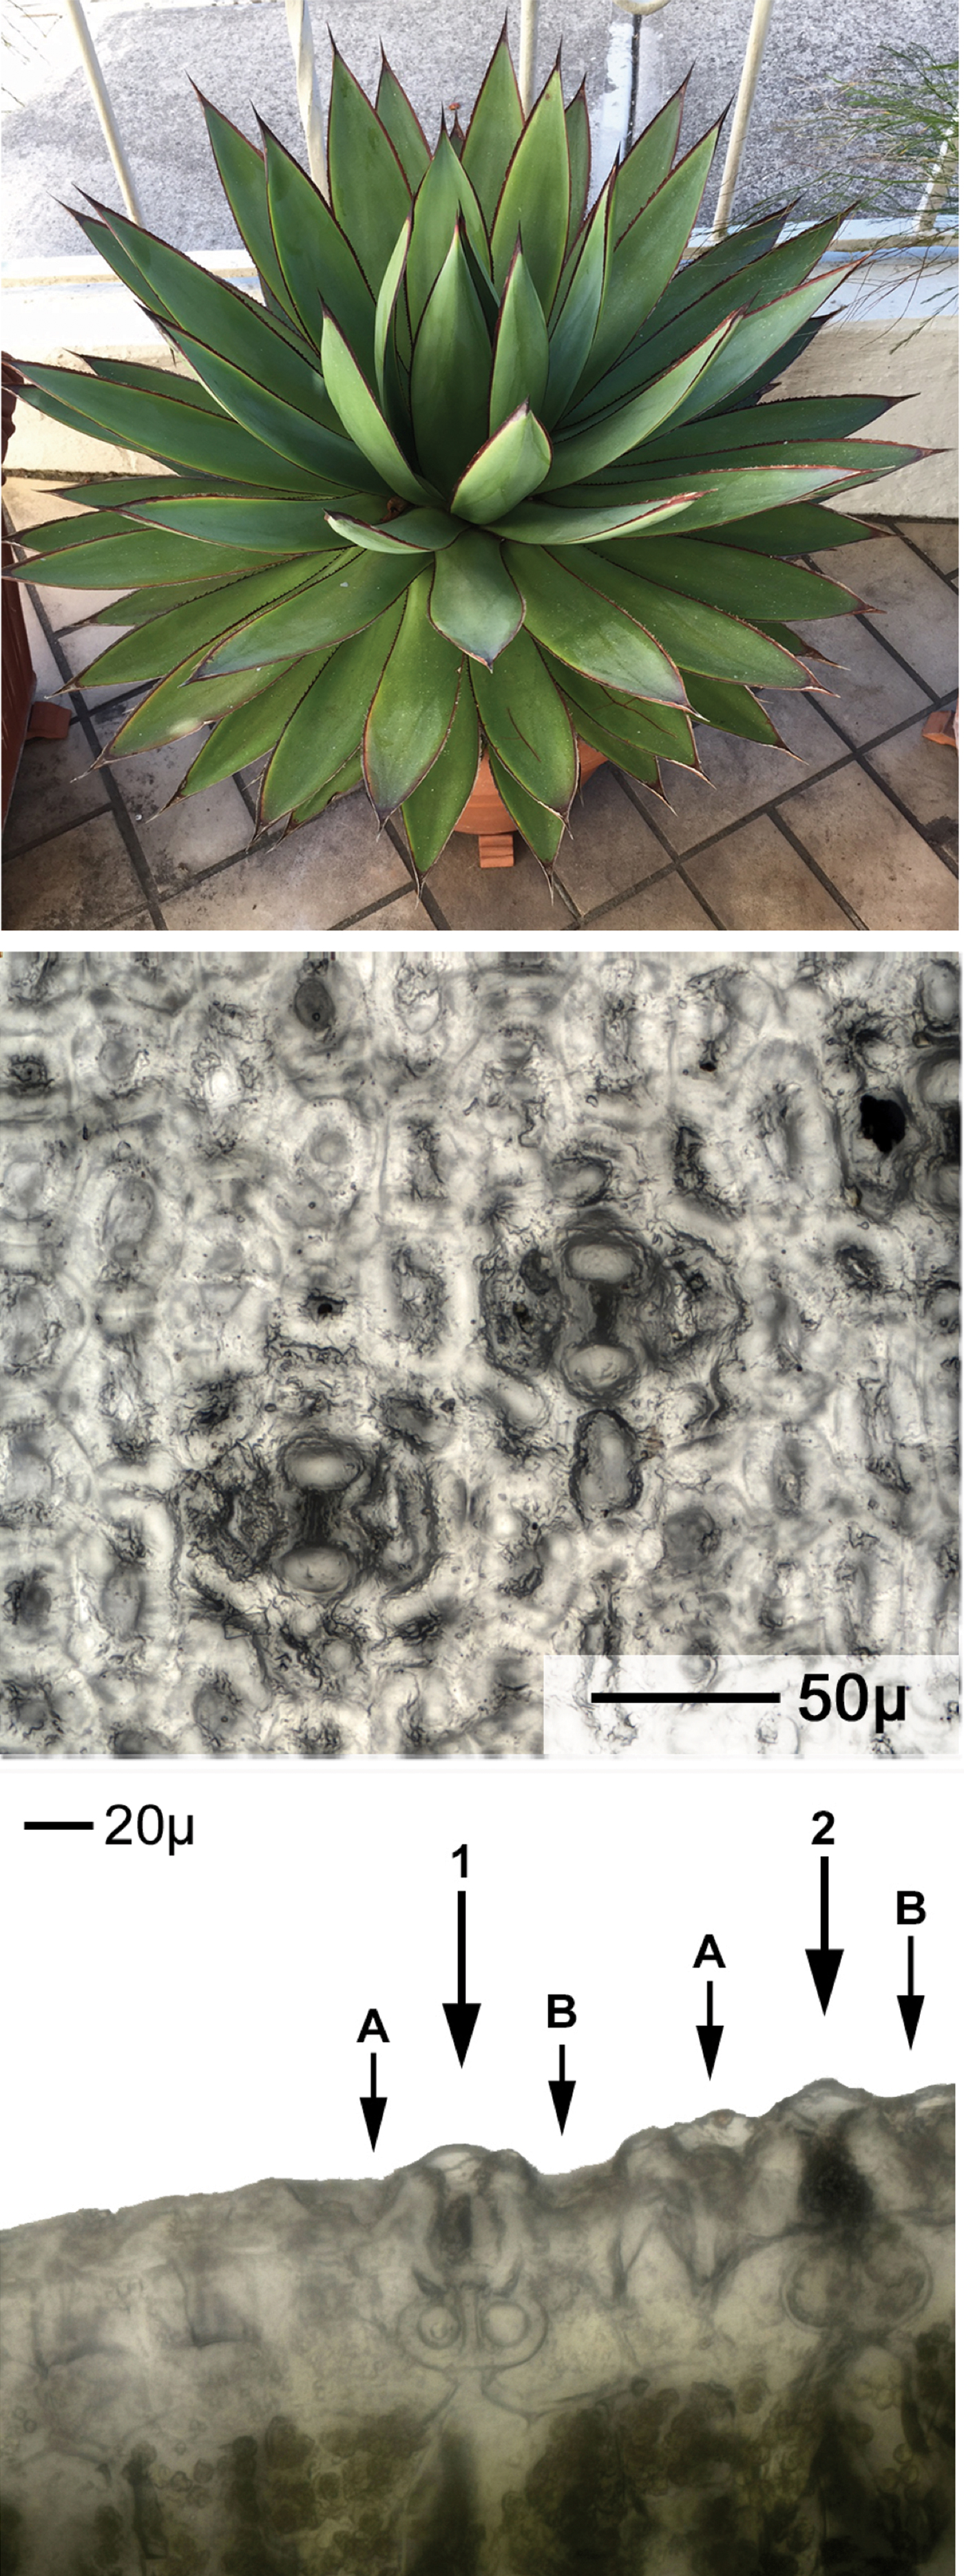
Figure 3: Agave “Blue Glow” hybrid monocot plant image (top) followed by planar and cross-sectional views. The bottom image shows a cross-sectional view of two stomata, indicated by arrows. The leaf axis is vertical in the center image and perpendicular to the page in the bottom image.
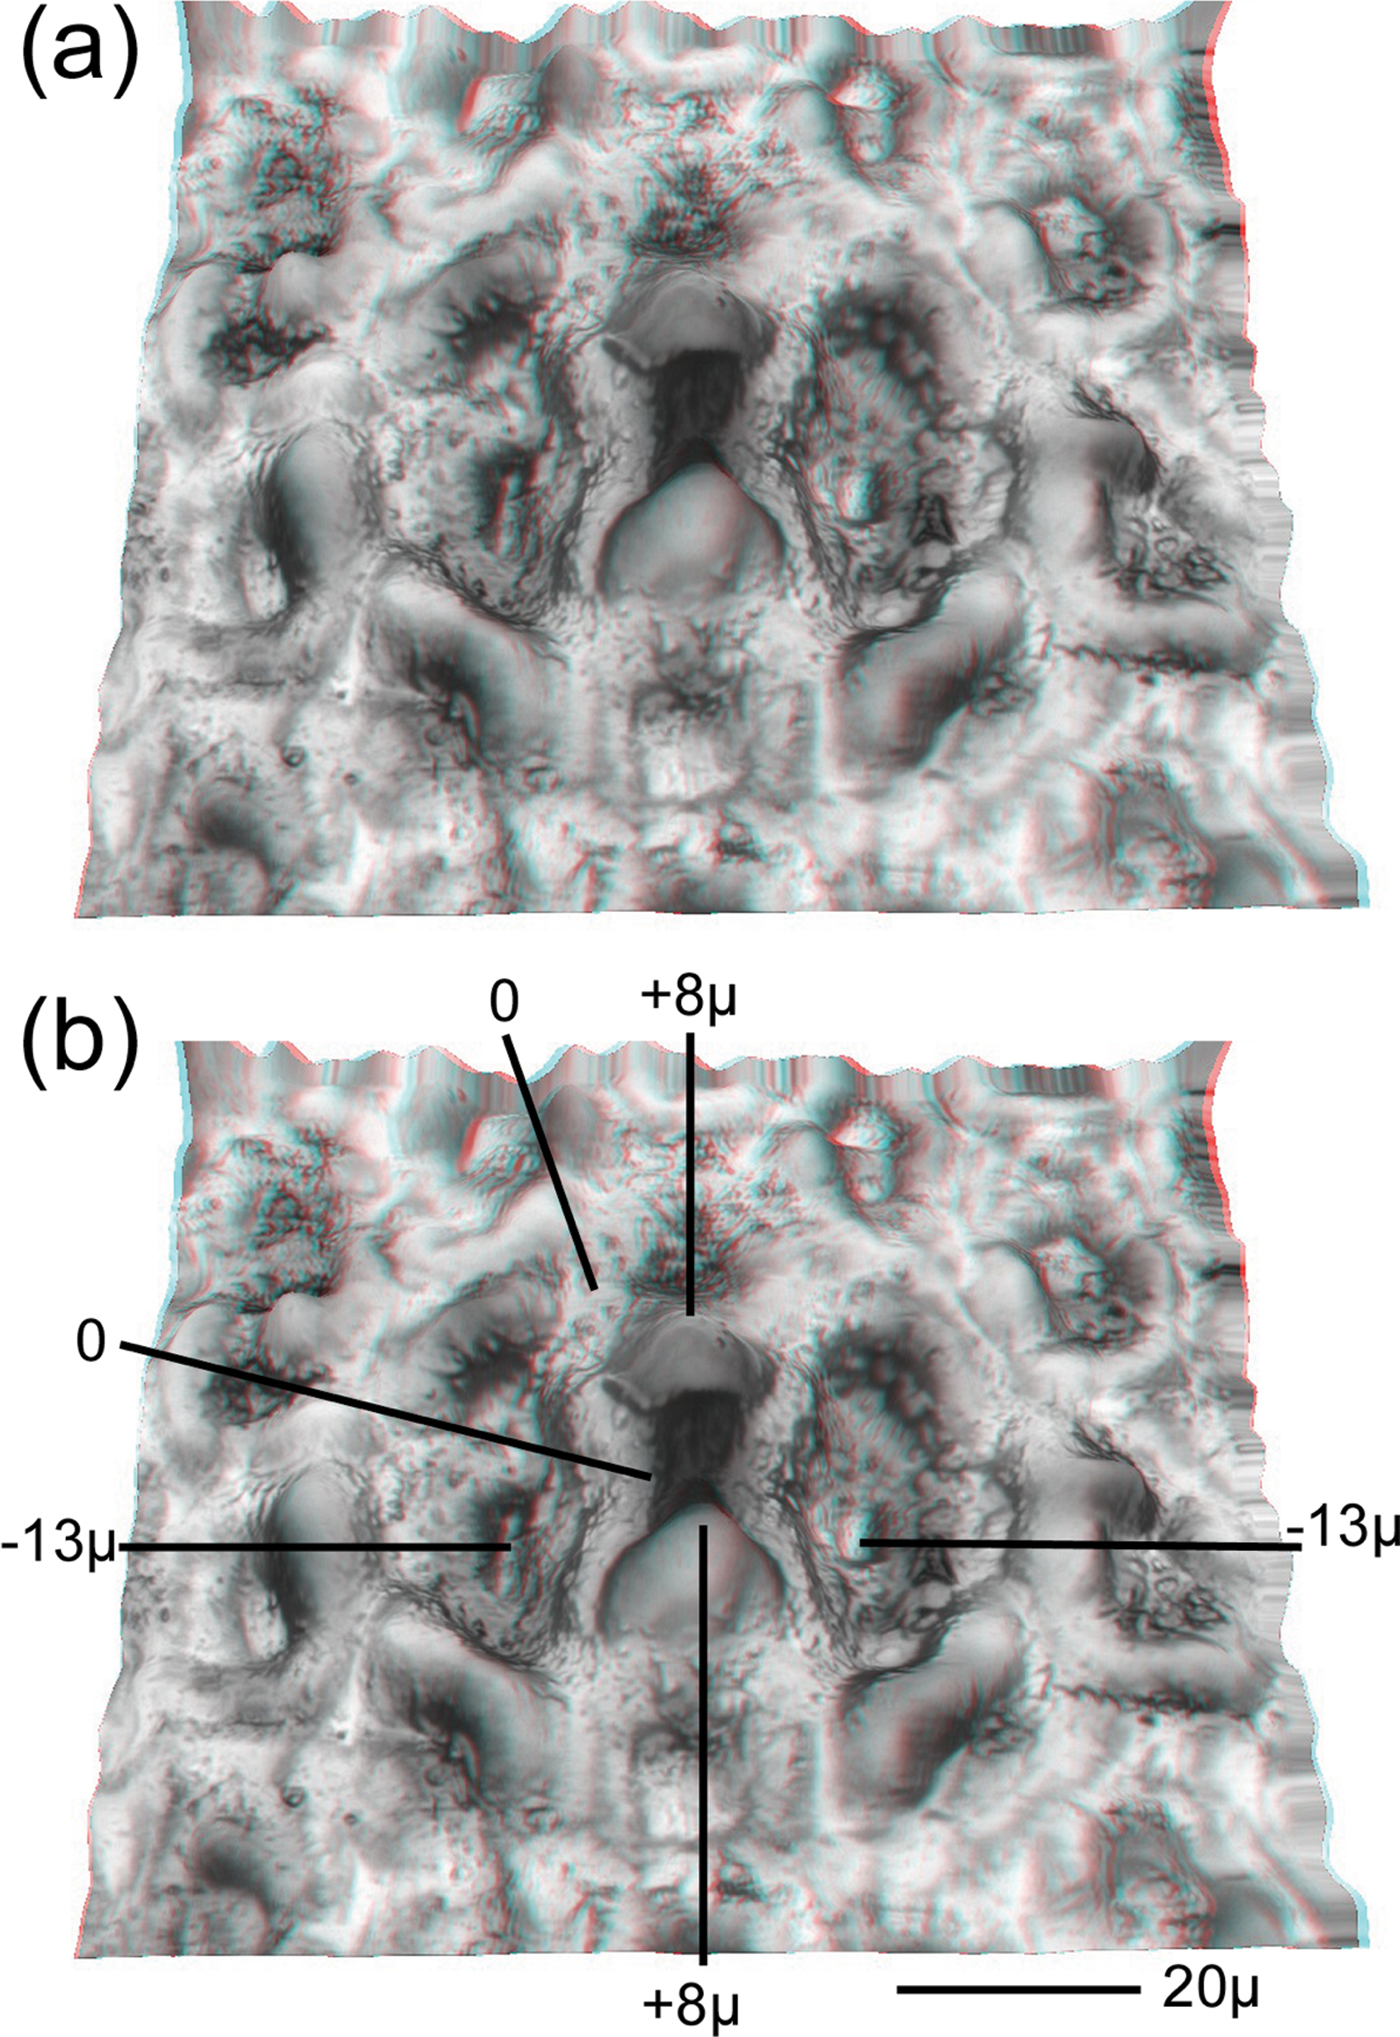
Figure 4: Agave “Blue Glow” leaf surface that has been peeled from a leaf. (a) Red (left eye)-cyan (right eye) anaglyph showing an oblique view of a stoma on the leaf underside. (b) Depth indications are shown in micrometers. Depth indications were obtained from a planar view using a microscope's stage z-axis micrometer

Figure 5: Masdevallia Highland Monarch “Golden Sunshine” monocot plant image followed by planar and cross-sectional views of a single stoma on the leaf underside. Arrow indicates a stoma in the cross-sectional view.
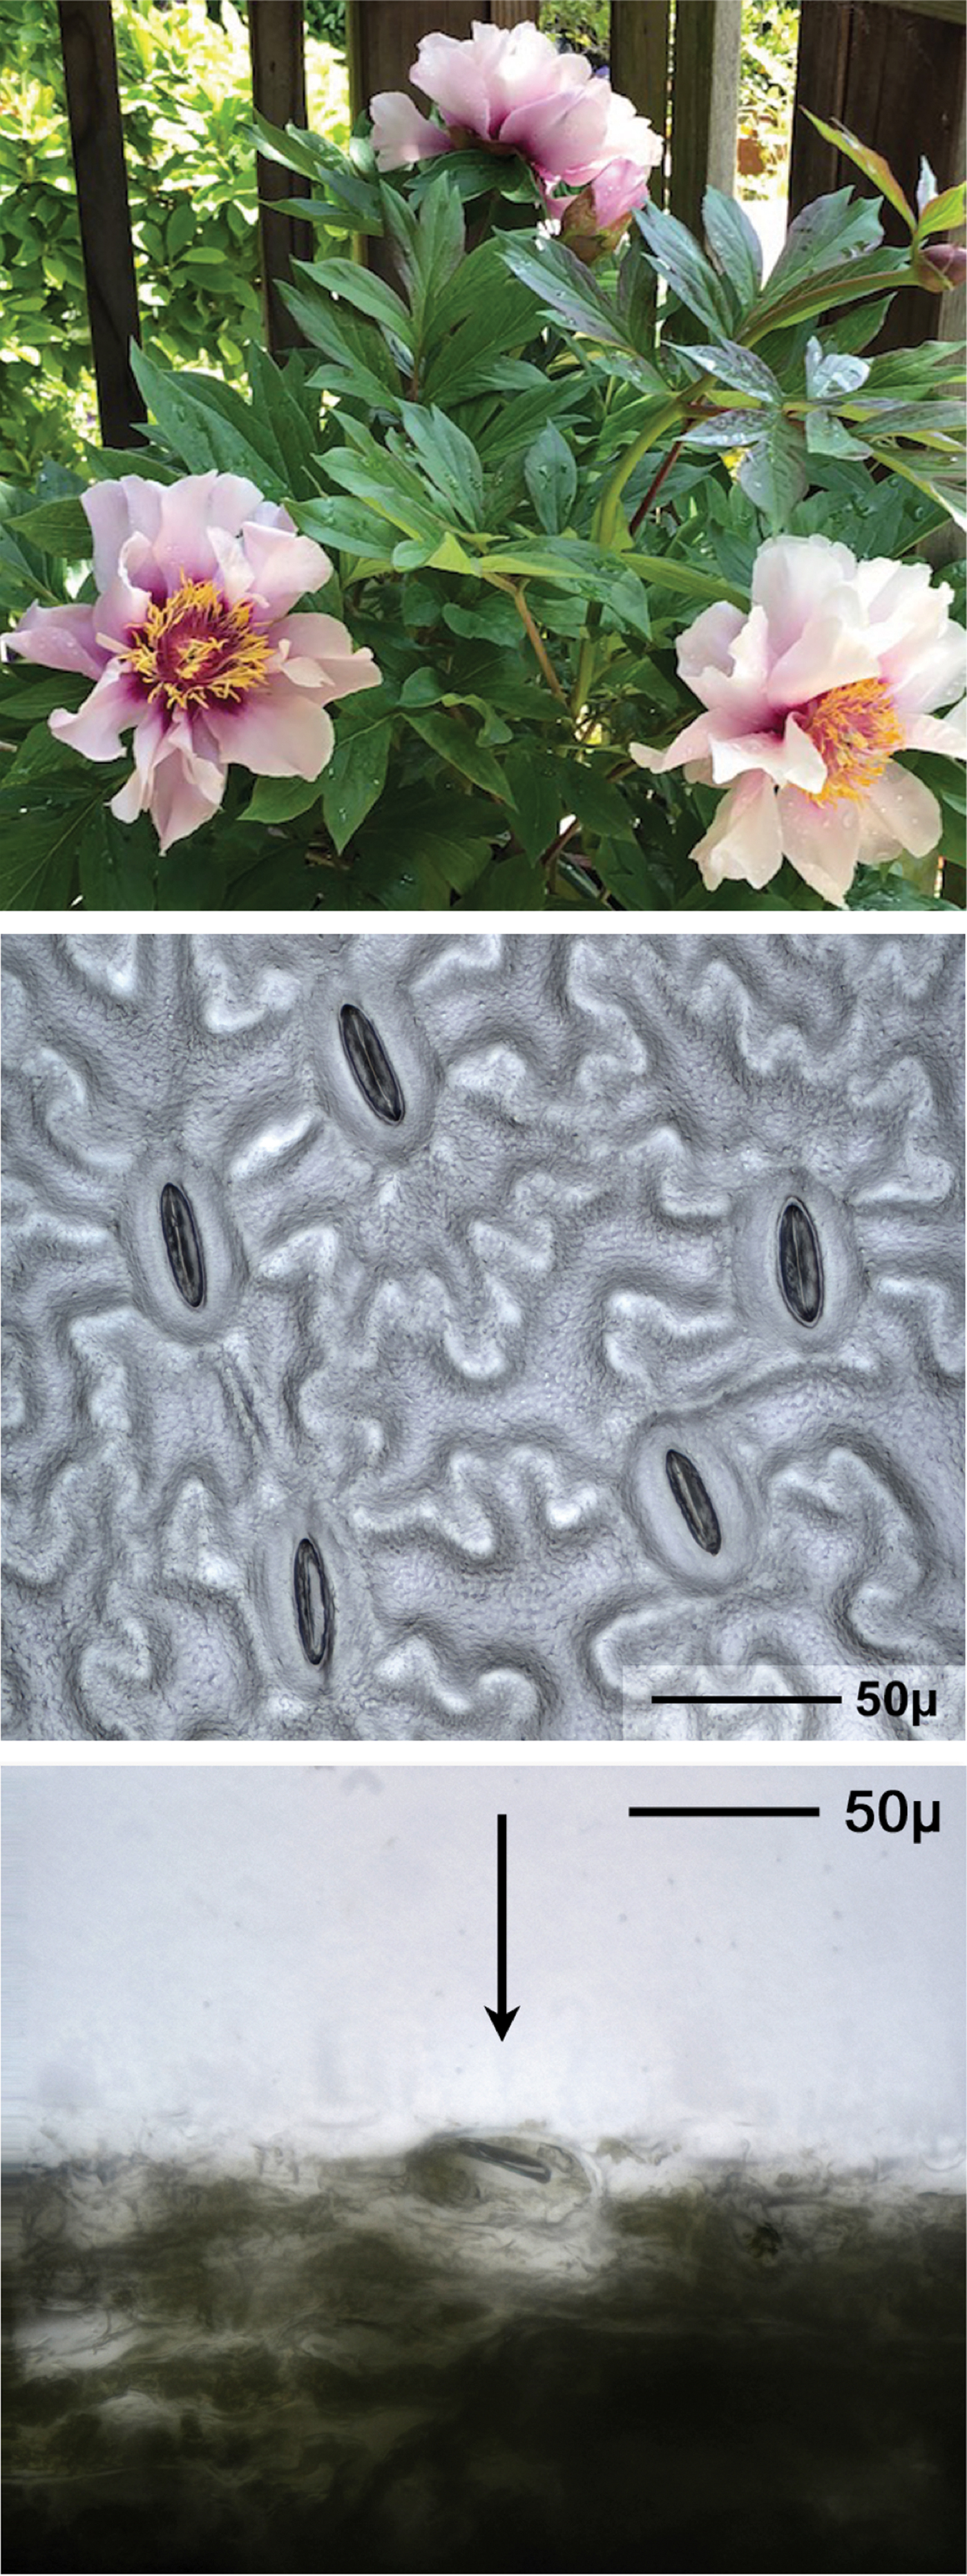
Figure 6: Peony hybrid “Louise Rowe” dicot plant image followed by planar and cross-sectional views of stomata on the leaf underside. Arrow indicates a stoma in the cross-sectional view.
Specimen preparation
To see stomata and measure the sizes of their openings, leaf surfaces may be examined by making varnish replicas or by examining the epidermis of the leaf after it has been peeled or shaved from the leaf (Figure 2). In some cases, stains and other chemical treatments are used [Reference Eisele10]. There are many videos and written instructions for these methods available on the Internet. The specimens shown below were all taken from the undersides of leaves.
In this work, leaf specimens were acquired and prepared during sunlight hours. Stomata open and close very slowly. No effort has been made to capture specimens with the stomata in any particular state; however, the study of stomata under various stimuli or environmental conditions could form the basis of school laboratory projects.
A homemade stage microtome was used to obtain single transverse cross sections of leaves. Cross-sectional views were taken by embedding leaf sections in paraffin and then cutting thin sections perpendicular to the plane of the leaf. The sections were approximately 125 µm thick. The sections were placed on a microscope slide and surveyed for stomata. See http://paedia.com/Ficus_vid.html for more information about the stage microtome.
Microscopy equipment
This study employed a Nikon Eclipse LV100 microscope with a trinocular port and a z-axis micrometer indicator. Nikon LU Plan Fluor objective lenses were used. A Point Grey Grasshopper camera was mounted on the trinocular port and controlled by a personal computer with the Windows 10 operating system. Images from the camera were stored on the computer's hard drive. Image originals were 2448 × 2048 pixels, 8 bits/pixel, except for Figure 4, which was 1224 × 1024 pixels, 8 bits/pixel.
Image acquisition
To perform focus stacking, a series of images (a stack) with overlapping focal depths is required. The images in the stack are then processed mathematically to produce an all-in-focus result. Most of the images in this work were taken through a 50 × objective with a depth of field of 1.2 µm. The following steps were used to acquire and process an image:
1. Prepare a slide with a cast, peeled, or shaved plant epidermis.
2. Locate a stoma of interest.
3. Focus on a point above the stoma and note a first reading (in μm) of the stage micrometer.
4. Focus on a point below the stoma and note a second reading of the stage micrometer.
5. Subtract the first and second readings and divide by 1.2 µm, the depth of field of the objective lens. The result is the number of depths of field between the first and second readings. Focus stacking requires that the depths of field of images overlap, so at least one image must be added to the result. I usually add more than one extra image. Extra images in a stack are processed, but their contributions are redundant and have no effect on the final image. For example, if the result of this calculation is 10 images, I will include 15 images in a stack in order to ensure overlap of depths of field.
6. With the stage micrometer at one extreme of focus, acquire a first image. Advance the stage to the next calculated position and take a second image. Continue doing this until all the images in a stack are collected and stored on the computer's hard drive.
7. Start the focus stacking software and import a stack of images into it.
8. Start the rendering process in the software. When rendering is complete, the software presents a final, all-in-focus image that can be saved. Additional processing creates orthogonal and stereo images.
Results
Stomatal density measurements
Figure 2b shows a low-magnification view of a varnish replica used to compute the density of stomata on the underside of a leaf of the Blue Glow Agave plant similar to that shown in Figure 3. Each of the 232 dark spots is a stoma. The leaf axis is vertical. The area shown is 2.54 mm × 2.13 mm = 5.4 mm2, thus the density of stomata is 232/5.4 = 43 per mm2. In practice, stomatal densities are determined using several varnish replicas on a leaf in order to obtain statistically valid results. Software for this purpose is described in the literature [Reference Fetter11].
Stereo images of the leaf surface
By combining the stack of images taken at different depths, focus stacking enables creation of stereo images. These images permit a detailed understanding of the morphology of the leaf surface (Figure 4a). Such oblique stereo views show the structure of stomata more clearly than would be seen by looking straight down onto them.
Measuring Individual Stomata
The area of a stoma opening is given by its width and length. The width and length of the Agave stoma shown at the lower left of Figure 3 (middle image), and also in the center of Figure 4, were 56 µm and 47 µm, respectively. The leaf axis is vertical in this view. The depth and height of a stoma relative to a leaf surface was determined using the limited depth of field of a standard light microscope in conjunction with the microscope's stage micrometer. In Figure 4b, the two zeroes at the top and left of the Agave oblique view are at the leaf surface. The points marked -13μ lie 13 µm below the surface. The points marked 8μ lie 8 µm above the leaf surface. The cross-sectional view at the bottom of Figure 3 shows sections of two stomata, marked 1 and 2. The A and B designations mark the locations of the depressions on either side of the center that are -13 µm deep in Figure 4.
Figures 5 and 6 show plant images, planar views, and cross-sectional views of stomata for a Masdevallia orchid and a Peony, respectively. The cross-sectional views in Figures 3, 5, and 6 show that some stomata extend above the leaf surface, while others lie at or below the leaf surface.
Table 1 shows a comparison of stomatal density and size for the plants discussed here. The numbers given in the table reflect measurements made on individual leaf areas and representative stomata. These numbers show significant variations in size and density of stomata from plants of different types. In the field, more measurements and statistical analyses are used to refine these numbers.

Discussion
There is significant variability in size among stomata on different types of plants, and even on individual plants of a particular species. Some stomata are simple, like those on the leaves of a Peony, while others are complex, like those on the leaves of an Agave. Some useful information about the morphology of stomata was obtained from single specimens, whereas information about a plant's interaction with its environment would be best obtained from statistical analyses of many stomata.
A web page with additional images and links to references is available on the internet at www.paedia.com/Stomata.html. Photos of specimen preparation are also shown.
Conclusion
Microscopic examination of stomata is one way we can look for clues to help optimize the environment in which we live. In fact, these plant features make suitable subjects for classroom projects whereby students design experiments to determine the response of stomata to various environmental stimuli. Various specimen preparations and observational methods are used in studying stomata with light microscopy. In this article, focus stacks were used to obtain high depth-of-field images of leaf surfaces and their stomata. The small depth of field typical of light microscopy without focus stacking was used to obtain measurements of stomata depth relative to the leaf surface. The high-quality images of stomata shown in this article can be achieved by anyone with a monocular microscope, a digital camera, a personal computer, and focus-stacking software.
Acknowledgment
Special thanks are due to Brian Brown who built the stage microtome used in preparing cross sections of leaves.


