Undernutrition is a condition in which food and nutrient intakes are not adequate to meet physiological needs and to maintain good health. In children, undernutrition inhibits optimal development causing impairment in weight and length attainment, namely underweight and stunting. Child undernutrition is currently a major public health threat in low- and middle-income countries where it was reported that underweight and stunting affect about 99 million and 160 million children under the age of 59 months, respectively. Undernutrition is also one of the main determinants of child mortality. It was estimated that 14·4 and 14·7 % of deaths are attributable to underweight and stunting, respectively(Reference Black, Victora and Walker1). In Africa, underweight and stunting affect about 28 million and 56 million children under the age of 59 months(Reference Black, Victora and Walker1). The dire long-term effects of child undernutrition are well documented and include, but are not limited to, compromised cognitive development which leads to reduced adult productivity and reduced economic income, perpetuating an intergenerational cycle of poverty(2, Reference Walker, Wachs and Grantham-McGregor3). Inasmuch as the consequences of undernutrition are known(Reference Bain, Awah and Geraldine4), more knowledge about undernutrition determinants is desirable. It was earlier acknowledged that poverty is the main determinant of undernutrition(Reference Akombi, Agho and Hall5). According to the UNICEF conceptual framework of undernutrition, childhood undernutrition is rooted in poverty. There are at least three main mechanisms by which poverty contributes to undernutrition(Reference Smith and Haddad6). First, poverty contributes to the lack of resources for food security. Second, poverty reduces health-care resources for the mother and the child. Third, poverty gives rise to a lack of resources for health in terms of environmental safety and adequate sanitation. These mechanisms were widely linked to malnutrition in local studies(Reference Bloss, Wainaina and Bailey7–Reference Vollmer, Harttgen and Subramanyam10). Lack of food security along with reduced resources for maternal and child care leads to a reduced dietary intake by the child. In addition, child health status is affected by reduced resources for maternal and child care and lack of resources for health. Finally, a reduced dietary intake together with a compromised health status leads to undernutrition(Reference Egata, Berhane and Worku11–Reference Smith and Haddad14). It is widely acknowledged that these factors are related to undernutrition, but less is known about the specific contribution of each of those determinants. To address this aim, in the present study data from the World Bank database were used to evaluate the contribution of each of those factors determining undernutrition in children aged 0–59 months in sub-Saharan Africa. Specific country-level contribution of diarrhoea, HIV and malaria prevalence, water accessibility, number of medical doctors, exclusive breast-feeding prevalence, health expenditure, education expenditure, per capita income and gross domestic product were evaluated using meta-regression models.
Methods
Measures of undernutrition and characteristics of the World Bank database
Underweight and stunting prevalence was defined as the percentage of children whose weight-for-age and height-for-age was more than two standard deviations below the median weight-for-age and height-for-age, respectively, of the international reference population aged 0–59 months (i.e. weight-for-age Z-score <–2 and height-for-age Z-score <–2, respectively)(Reference De Onis and Blossner15, 16). In the present work the prevalences of underweight and stunting in children under the age of 59 months in sub-Saharan Africa were extracted from the World Bank database(17). The World Bank database is a free access database that reports time series on a variety of topics collected at country level. Briefly, data from over 250 countries have been collected since the 1960s regarding general topics such as health and nutrition, education, economic development, inequalities and poverty, and basic demographic statistics. The World Bank database project is based on a robust methodology and data are systematically updated(18). Notably, the period 2000–2015 was chosen according to the introduction of the Millennium Development Goals from UNICEF(19).
Explanatory factors associated with undernutrition
Factors possibly related to undernutrition were selected according to the WHO framework of undernutrition, widely associated determinants of undernutrition reported in the current scientific literature and availability of the information in the World Bank database(Reference Walker, Wachs and Grantham-McGregor3, Reference Bain, Awah and Geraldine4, Reference Smith and Haddad6, Reference Vollmer, Harttgen and Subramanyam10, Reference Black, Cousens and Johnson20, Reference Van de Poel, Hosseinpoor and Speybroeck21). First, general determinants of child health and undernutrition were grouped as: water accessibility, number of physicians, exclusive breast-feeding, malaria prevalence, HIV prevalence and availability of diarrhoea treatment. Second, economic determinants of child health and undernutrition considered were: per capita income, health expenditure and education expenditure. Then, general determinants of child health and economic determinants of child health and undernutrition were included in nested models having stunting and underweight prevalence as outcomes.
Statistical methods
Data were collected and analysed at country level estimating the mean prevalence and the variation of the prevalence during the period 2000–2015. To this end, prevalence data were first transformed with the arcsine function to reduce data skewness, improving normality distribution of regression residuals. Afterwards, random-intercept models having arcsine of underweight and stunting prevalence as response variable and country, year and the interaction of country × year as covariates were used to estimate country-specific least-square means of arcsine prevalence and their 95 % CI. In parallel, an ordinary regression model having arcsine of prevalence as response variable and year as predictor was used to estimate country-specific underweight and stunting arcsine prevalence variation over the period 2000–2015. Arcsine prevalence and arcsine prevalence reductions were meta-analysed using a fixed-effect model having the total number of children under the age of 59 months as weight variable. This method was chosen over the more common random-effect model with the aim of reporting a more realistic estimate by region using the population dimension (number of children under the age of 59 months) as weight so that more populous countries had also a bigger weight in determining the estimated prevalence. The I 2 statistic was used to report heterogeneity among countries(Reference Deeks, Altman and Bradburn22). Meta-analytic estimates were performed by regions defined as Western Africa, Eastern Africa, Central Africa and Southern Africa. Meta-analytic estimates were calculated for the whole of sub-Saharan Africa as well. Finally, a sequential meta-regression analysis of the arcsine of undernutrition prevalence was conducted producing estimates that could be interpreted, with certain given restrictions, as potential impact fractions.
For these analyses the panel of covariates was chosen to represent commonly accepted determinants of undernutrition according to the most commonly accepted framework of undernutrition(Reference Smith and Haddad6). Specifically, these analyses were conducted considering a first model having area as covariate, a second model supplementary adjusted for health determinants of undernutrition (tertiles of de-trended means of water access percentage, number of physicians per 1000 people, exclusive breast-feeding percentage, malaria, HIV and diarrhoea prevalence by country over the period 2000–2015) and a third model supplementary adjusted for economic determinants of undernutrition (tertiles of de-trended means of gross domestic product per capita, mean health expenditure and mean education expenditure by country over the period 2000–2015) were performed to evaluate possible determinants of the outcomes. In this evaluation model R 2 and residual heterogeneity were used to evaluate improved fitting given by the covariates(Reference Knapp and Hartung23, Reference Thompson and Higgins24). Finally, a fourth model aiming to estimate the association between undernutrition prevalence and those same determinants expressed as continuous variables was interpolated. This final model estimated undernutrition prevalence change for a given variation of the determinant as reported in Table 1. All results from the above analyses were reported after back-transformation using the sine function.
Table 1 (a–c) Prevalence of underweight and stunting among 0–59-month-old children in different African regions and evaluation of underweight and stunting determinants. Analysis based on de-trended least-square means according to mixed-model analysis applied to World Bank data during the period 2000–2015

UW PRV (%), underweight prevalence estimate during the period 2000–2015; UWtrend × year, underweight prevalence reduction per year; UWP-trend, P value for underweight prevalence trend over the period 2000–2015; ST PRV (%), stunting prevalence estimate during the period 2000–2015; STtrend × year, stunting prevalence reduction per year; STP-trend, P value for stunting prevalence trend over the period 2000–2015; PIF-like, potential impact fraction-like; Model1, random-effect meta-regression model having region as covariate; Model2, Model1 with supplementary adjustments for general health determinants (malaria, HIV and diarrhoea treatment, water accessibility (access.), number of physicians (MD), exclusive breast-feeding (BF)); Model3, Model2 with supplementary adjustments for economic determinants of health (health expenditure (HE) and education expenditure (EE) as a percentage of gross domestic product (GDP), per capita income and GDP); −ΔUW PRV (%), expected underweight prevalence reduction in relation to determinants; −ΔST PRV (%), expected stunting prevalence reduction in relation to determinants.
More details on metrics used are reported in the ‘Statistical methods’ section. Significant results are indicated in bold font.
Underweight defined as percentage of children aged 0–59 months with weight-for-age Z-score <–2.
Stunting defined as percentage of children aged 0–59 months with height-for-age Z-score <–2.
Type I error was set to 5 % (α = 0·05) and all statistical tests were two-tailed. The statistical software package SAS version 9.3 was used to manage data. The MIXED procedure of the SAS software was used to perform-mixed model analyses and to perform medians of undernutrition prevalence over the observed period by country. Maps, forest plots, meta-analytical estimates and meta-regression modelling were performed by the SPMAP, METAN and METAREG functions of the statistical software package Stata version 15.
Results
Undernutrition prevalence estimates and undernutrition prevalence reduction during the period 2000–2015
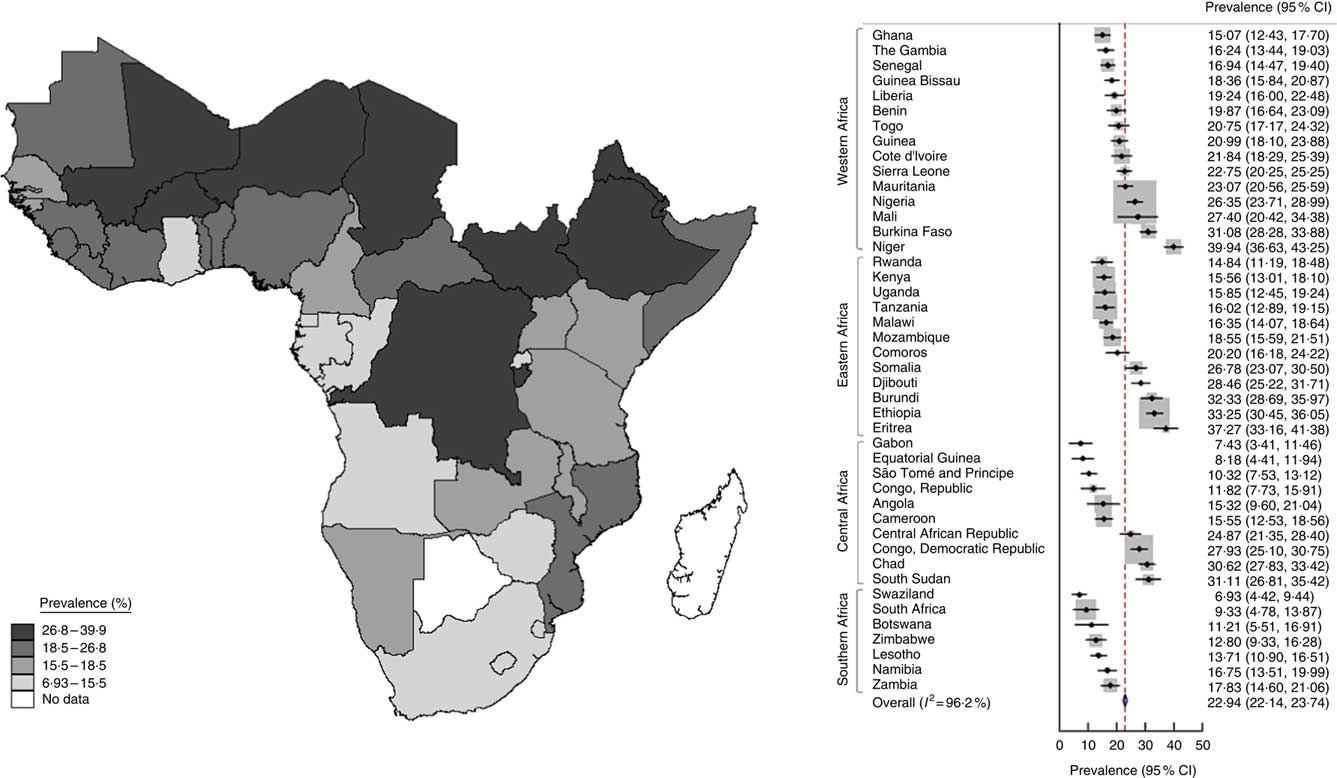
Underweight prevalence estimated during 2000–2015 ranged between 7 and 40 % with a heterogeneous distribution in different sub-Saharan regions of Africa, being higher in the northern part of western sub-Saharan Africa and particularly in Mali, Burkina Faso and Niger. In the eastern part of sub-Saharan Africa, underweight prevalence was higher in Eritrea and Ethiopia. In the central part of sub-Saharan Africa, underweight prevalence was higher in the Democratic Republic of the Congo (Fig. 1).

Fig. 1 (colour online) Map (left) and forest plot (right) of prevalence of underweight (weight-for-age Z-score <–2) among 0–59-month-old children in sub-Saharan Africa during 2000–2015 estimated from World Bank data. In the forest plot, the country-specific prevalence and 95 % CI are represented by the black diamond and the horizontal line, respectively; the area of the grey square is proportional to the country-specific weight in the overall meta-analysis. The centre of the blue open diamond and the red dashed line represent the pooled prevalence; and the width of the blue open diamond represents the pooled 95 % CI
The mean stunting prevalence during 2000–2015 ranged between 20 and 60 % in sub-Saharan Africa. Highest prevalence of stunting was observed in Niger when considering the western part of sub-Saharan Africa. In the eastern sub-Saharan Africa region, stunting prevalence was higher in Ethiopia and Eritrea. Stunting was particularly high in the central-east area of sub-Saharan Africa affecting a cluster of countries composed by the Democratic Republic of the Congo, Rwanda, Burundi, Mozambique and Madagascar (Fig. 2). Notably, during the period 2000–2015 underweight and stunting prevalence decreased consistently by 0·6 and 0·9 % per year, respectively, when considering sub-Saharan Africa as a whole. This reduction was not statistically significant for all countries. In western sub-Saharan Africa a statistically significant decrease of underweight prevalence was observed in Guinea-Bissau, Guinea, Sierra Leone, Liberia, Ghana, Togo, Burkina Faso and Niger. Furthermore, in the eastern sub-Saharan Africa region a statistically significant reduction of underweight prevalence was observed in Ethiopia, Kenya, Uganda and Mozambique. In central sub-Saharan Africa a statistically significant reduction of underweight prevalence was observed in the Democratic Republic of Congo, Rwanda, Burundi and Equatorial Guinea. Finally, a statistically significant reduction of underweight prevalence was observed in Namibia, Lesotho and Swaziland in southern sub-Saharan Africa. In western sub-Saharan Africa stunting prevalence over the period 2000–2015 reduced significantly in Mauritania, Guinea, Liberia, Cote d’Ivoire, Ghana and Nigeria. In the eastern sub-Saharan Africa region, a significant reduction of stunting prevalence was observed in Ethiopia, Kenya, Uganda, Malawi, Zambia and Mozambique. In central sub-Saharan Africa, a statistically significant reduction of stunting prevalence was observed in Equatorial Guinea and Congo. In southern sub-Saharan Africa, a statistically significant reduction of stunting prevalence was observed in Zimbabwe and Lesotho.
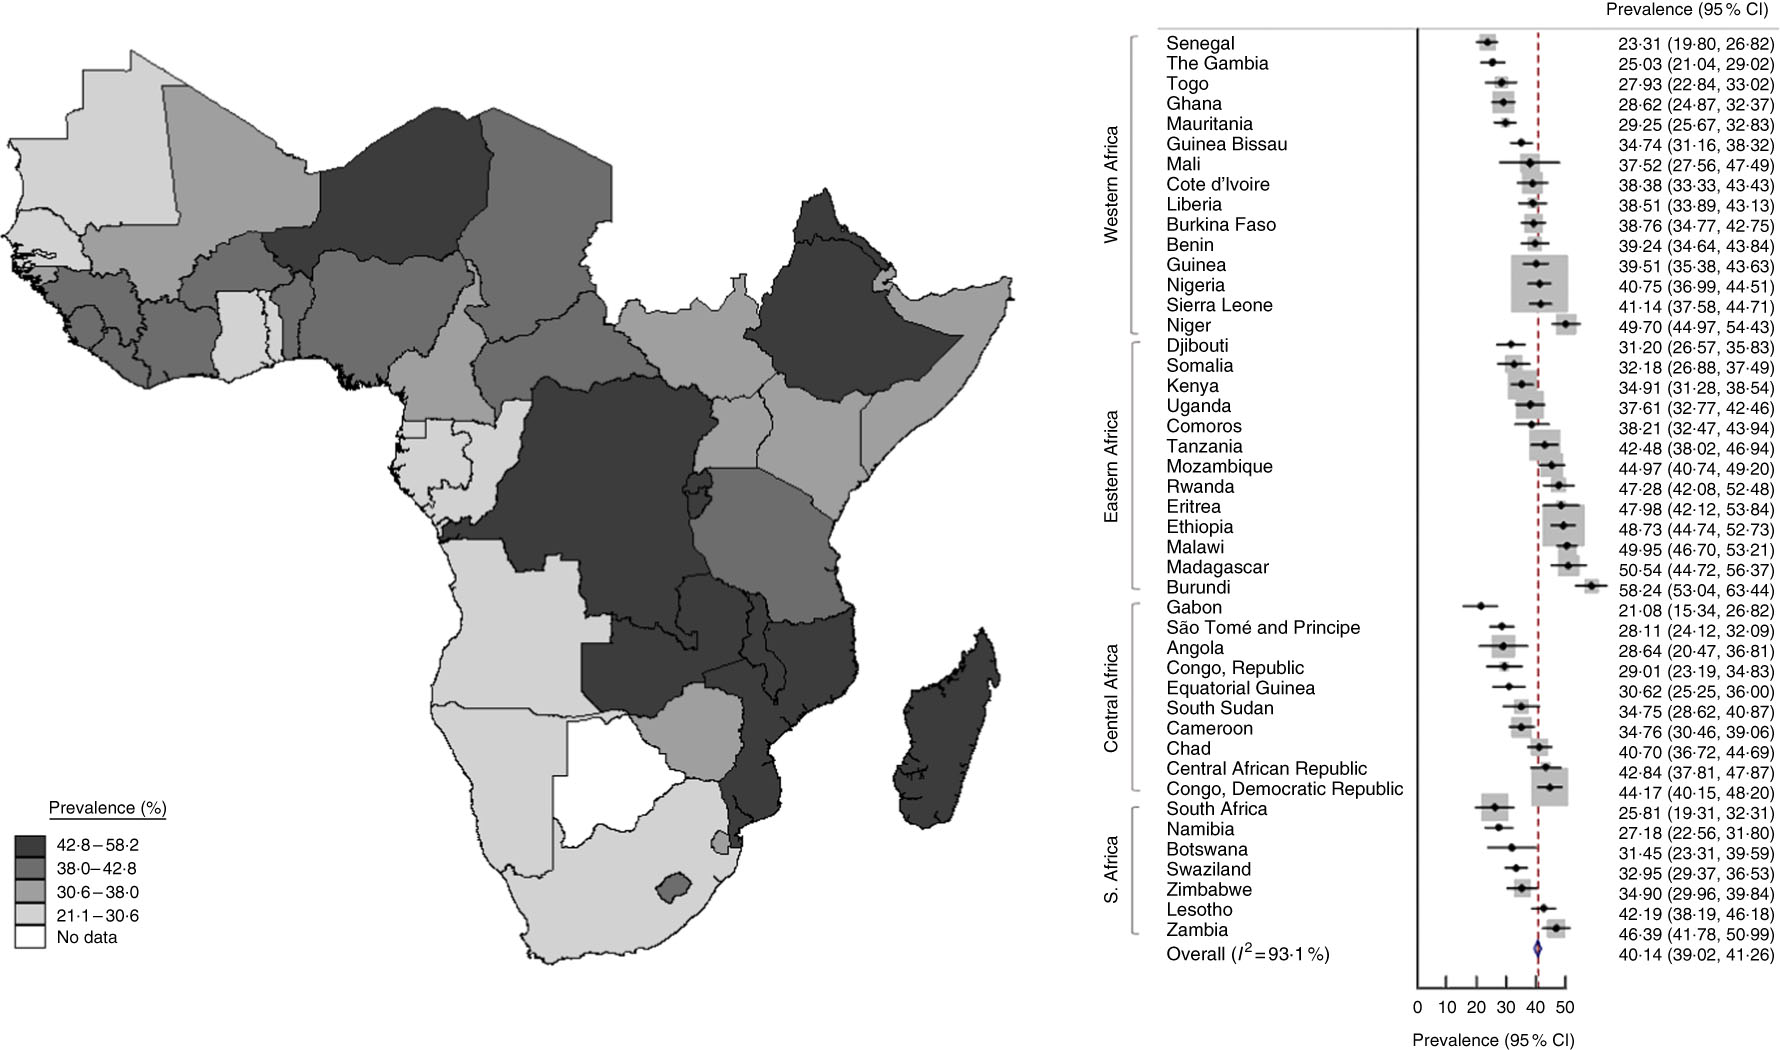
Fig. 2 (colour online) Map (left) and forest plot (right) of prevalence of stunting (height-for-age Z-score <–2) among 0–59-month-old children in sub-Saharan Africa during 2000–2015 estimated from World Bank data. In the forest plot, the country-specific prevalence and 95 % CI are represented by the black diamond and the horizontal line, respectively; the area of the grey square is proportional to the country-specific weight in the overall meta-analysis. The centre of the blue open diamond and the red dashed line represent the pooled prevalence; and the width of the blue open diamond represents the pooled 95 % CI
Determinants of undernutrition prevalence
Estimated underweight and stunting prevalence was 22·9 (22·1, 23·7) % and 40·1 (39·0, 41·3) %, respectively, in sub-Saharan Africa considered as a whole. When looking at models considering single region as an explanatory factor, a significant model fit was observed (P = 0·021 and P = 0·012 for underweight and stunting prevalence). This was due to differences between southern and the rest of sub-Saharan Africa. When looking at undernutrition prevalence, it was observed that the southern region had lower underweight and stunting prevalence compared with the rest of sub-Saharan Africa (12·2 and 32·7 % for underweight and stunting prevalence, respectively, compared with 22·9 and 40·1 % for underweight and stunting prevalence, respectively, in the whole of sub-Saharan Africa). Sequential meta-regression modelling revealed that water accessibility, number of physicians, exclusive breast-feeding, malaria, HIV and diarrhoea prevalence further increased model fit. Models considering these factors and regions explained up to 46 and 39 % of the observed variability of the prevalence of underweight and stunting, respectively. Notably, when supplementary factors defining economic and cultural determinants of undernutrition such as gross domestic product, per capita income, health expenditure and education expenditure were considered, a further improvement in model fit was observed. Full models considering region, health status and socio-economic determinants of health explained up to 63·5 % of the underweight prevalence variance. Notably, model fit improvements resulted in a parallel reduction of residual heterogeneity up to 20 %. No relevant improvement in model fit (about 1·5 % increase) was observed for stunting prevalence when considering socio-economic determinants of health. The models mentioned above applied to underweight and stunting prevalence reduction did not result in any relevant fitting improvements (data not reported). According to meta-regression analysis it was estimated that a 1 % decrease in HIV prevalence results in approximately a 1·5 % decrease in underweight prevalence, while if water accessibility increases by 10 %, a decrease of about 1·9 and 1·7 % is expected for underweight and stunting prevalence, respectively. It was also estimated that an increase of one medical doctor per 1000 people may result in a reduction of stunting prevalence of about 2·6 %. Finally, a $US 1000 increase of income per capita may result in a reduction of underweight and stunting prevalence of 0·8 and 0·6 %, respectively.
Discussion
Undernutrition, in the form of underweight and stunting, is a major public health problem in sub-Saharan Africa where it still affects a large proportion of the children between the ages of 0 and 59 months. In the present work, it was found that undernutrition and stunting prevalence in sub-Saharan African children was consistent during the period 2000–2015, being 23 % and 40 %, respectively. Relevant heterogeneity among countries was also observed, emphasizing the importance of local determinants of undernutrition. This heterogeneity is likely due to the complexity and specificity of local and micro situations that the present work just partially grasps.
Although malnutrition remains high, there was a generalized underweight and stunting reduction observed between 2000 and 2015. Unfortunately, this reduction was not consistent in all sub-Saharan countries. Moreover, the 1 % underweight or stunting reduction per year is still unsatisfactory, indicating the importance of new or additional sustainable approaches from governments, non-government organizations and other organizations. This further emphasizes the importance of the Sustainable Development Goals. In the present paper, it was shown that countries with the highest prevalence of either underweight or stunting were not the countries where the most reduction was seen. This indicates that although undernutrition prevalence is high in these countries, public health interventions aimed to decrease it were not efficient or not successfully implemented by the respective governments and other organizations. Notably, underweight prevalence was particularly high in the northern part of western sub-Saharan Africa while stunting was higher in the central region, showing geographical asymmetries in the distribution of undernutrition. Underweight is usually more indicative of acute undernutrition and can be due to food scarcity during specific times of the year. On the other hand, stunting is more indicative of chronic undernutrition and thus a more constant lack of food supply.
A deeper understanding of the determinants of child undernutrition in sub-Saharan Africa is required since undernutrition is a threat affecting millions of children.
Determinants of undernutrition in sub-Saharan Africa
In the present analysis, health accessibility, general determinants of health, hygiene and socio-economic factors were investigated. More specifically, HIV prevalence, water accessibility, number of medical doctors and per capita income emerged as main determinants of child undernutrition prevalence. These results confirm what has already been described by other studies where health status, hygienic conditions and poverty were consistently associated with undernutrition in sub-Saharan Africa(Reference Akombi, Agho and Hall5, Reference Van de Poel, Hosseinpoor and Speybroeck21, Reference Fotso25–Reference Zere and McIntyre27). Among others, the present work confirmed the existence of a significant association between undernutrition and HIV prevalence, that in turn is related to child mortality(Reference Fergusson and Tomkins28–Reference Saloojee, De Maayer and Garenne30). According to our regression analyses, we estimated that reduction in HIV prevalence of 1 % may result in a relevant (1·5 %) decline in underweight prevalence. It is widely acknowledged that water accessibility is a typical problem in sub-Saharan Africa and low- and middle-income countries as well(Reference Sorenson, Morssink and Campos31). In the present work it was confirmed that water scarcity is related to undernutrition(Reference Reutlinger and Selowsky32). Nevertheless, we estimated that an increase of 10 % in water accessibility may result in a significant reduction of undernutrition, specifically 1·7 and 1·9 % for underweight and stunting prevalence, respectively. In the present work we confirmed early theories that poverty affects undernutrition by showing that an income increase of $US 1000 per capita reduces underweight and stunting prevalence by 0·6 and 0·8 %, respectively. Finally, we showed a significant association between undernutrition, legislation and the policies aimed to improve health-care resources(Reference Reutlinger and Selowsky32). In fact, we estimated that a robust strengthening of the number of physicians (an increase of one medical doctor per 1000 people) may result in a relevant reduction of stunting prevalence (2·6 %). Lastly, the present results indicated that all the above-mentioned determinants had a high heterogeneity between the different countries and regions, indicating that additional determinants such as environmental features, climate change and political stability may also influence underweight and stunting prevalences. This may suggest that local characteristics should be taken into account to address efficient interventions and policies against undernutrition in sub-Saharan Africa.
Public health perspectives
The results reported here support and strengthen public health policies already in use. In the past, national and international policies resulted in an insufficient decline of undernutrition prevalence. At the turn of the millennium, the number of underweight and stunted children in low- and middle-income countries was 124 million and 197 million, respectively(33). Consequently, the UN General Assembly adopted a strategy based on eight goals to reduce undernutrition by 2015 (the UN Millennium Development Goals). Those goals were: (i) to eradicate extreme poverty and hunger; (ii) to achieve universal primary education; (iii) to promote gender equality and empower women; (iv) to reduce child mortality; (v) to improve maternal health; (vi) to combat HIV/AIDS, malaria and other diseases; (vii) to ensure environmental sustainability; and (viii) to develop a global partnership for development(19). We acknowledge that the present analysis is not adequate to evaluate the effects of introducing the Millennium Development Goals on the undernutrition prevalence in sub-Saharan Africa. Nevertheless, we furnished elements suggesting that those points are quantitatively related to undernutrition prevalence in sub-Saharan Africa and so are still topical and relevant after the Millennium Development Goals proposal.
Among others, the results from the present work suggest the need to account for specific local aspects possibly related to undernutrition variability among sub-Saharan Africa countries. Last, but by no means less important, it is necessary to keep working to determine and identify undernutrition determinants and the probable underlying mechanisms by which they act in sub-Saharan Africa.
Strengths and limitations
The present work has remarkable strengths. First, it is based on a reliable and validated set of data collected by the World Bank at country level between 2000 and 2015. Second, it is based on robust statistical methods accounting for variability at country level and weighting single countries using the number of children aged 0–59 months. Third, it is the first time that undernutrition determinants have been evaluated in quantitative terms, giving an estimate of underweight and stunting prevalence reduction for a given change in the associated determinant. The present work has also certain limitations. Among others, the proposed results are based on a study design that does not take account of data collected at the individual level, thus resulting in a generalization at country level that may lead to ecological fallacy. Nevertheless, with such databases it is technically impossible to produce proper potential impact fraction estimates for the determinants of undernutrition prevalence and the present potential impact fraction-like estimates should be interpreted with caution. Moreover, another possible limitation is given by the lack of information contained in the database used. In particular, a certain amount of missing data (<5 %) may have reduced the impact of the proposed results, increasing the rate of false negative results.
Finally, it should be highlighted that macro data obviously fail to capture specific micro situations and more studies based on specific local settings are required to better understand the complex nature of undernutrition in sub-Saharan Africa.
Acknowledgements
Financial support: This research received no specific grant from any funding agency in the public, commercial or not-for-profit sectors. Conflict of interest: The authors have no conflict of interest to declare. Authorship: C.R., H.A., J.C., R.C.D. and M.L. contributed equally to this work. C.R. conceived the work, analysed the data and drafted the first version of the manuscript. H.A. and J.C. participated in data management, statistical analysis and to drafting the first version of the manuscript. C.C., R.C.D. and M.L. provided critical inputs in defining the aim of the work and the analytical strategies. All co-authors actively participated in revising and approved the current version of the manuscript. Ethics of human subject participation: Not applicable.