


A 16-year-old boy with learning disability presented with nocturnal pharmaco-resistant focal seizures consisting of right arm/axilla pain, sometimes followed by tonic-clonic movements of right arm/leg since 8 years of age. He was on valproate and levetiracetam and had failed multiple drugs in the past. Family history and examination were unremarkable.
MRI of the brain showed bottom of sulcus dysplasia in the left superior frontal region, immediately anterior to the pre-central gyrus.
Ictal scalp EEG showed hypermotor behavior, right-limb tonic posturing followed by periodic epileptic spasms after arousal during sleep associated with spike and slow-wave discharges over the bilateral fronto-central region with left hemisphere predominance. Forty-seven-hour-video EEG captured eight nocturnal seizures. Scalp EEG also showed 14 Hz ctenoids-morphology activity over bilateral posterior temporal regions (Figure 1).
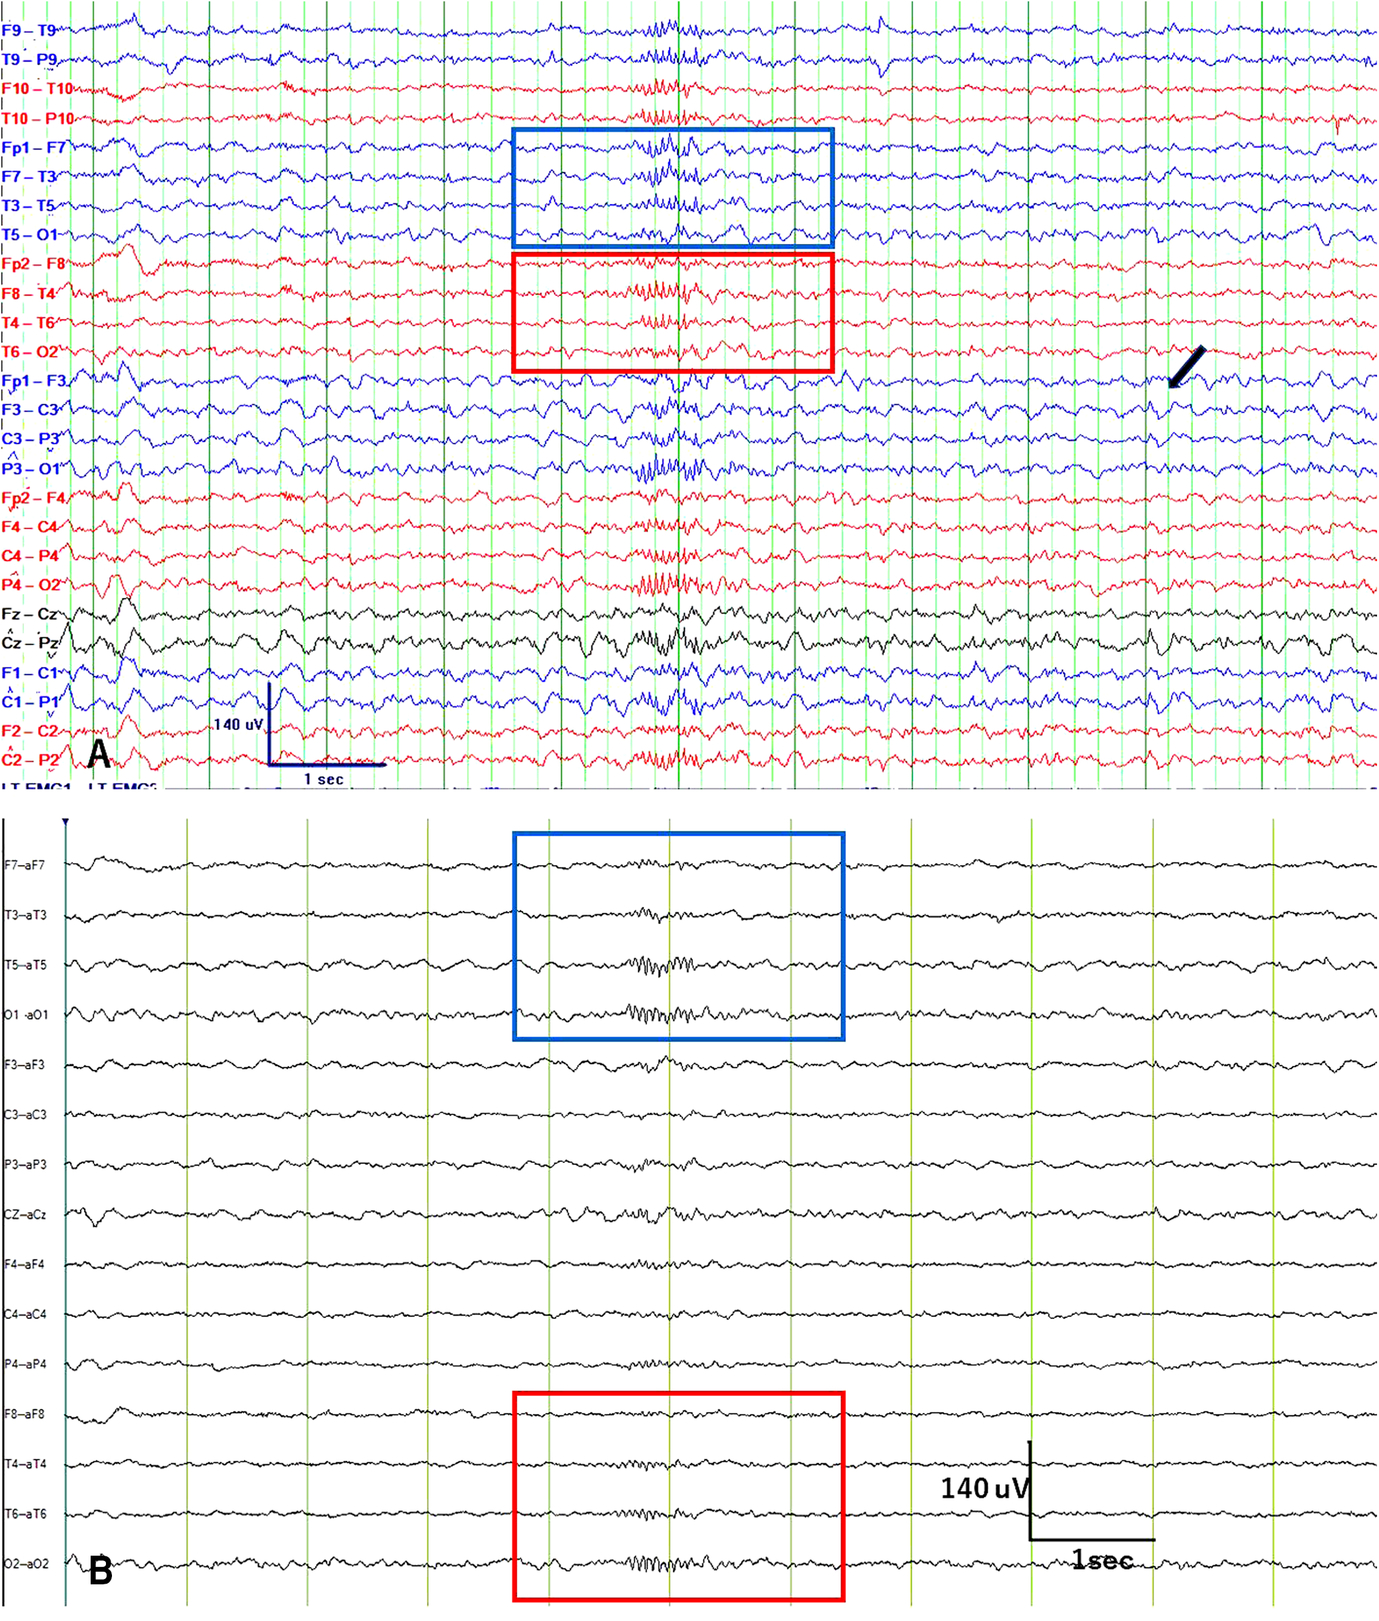
Figure 1: Scalp EEG in longitudinal bipolar with 31 channels (A) and Laplacian montage with 17 channels (B). There is a 14 Hz ctenoid-morphology activity with maximum positive amplitude over bilateral posterior head regions (left temporal in the blue box; right temporal in the red box). Black arrow points to the habitual epileptiform sharp wave at F3.
On simultaneous MEG and EEG (30-minute recording), there were occasional low-amplitude 14 Hz ctenoids-morphology beta activity over the bilateral temporal regions and posterior quadrants with left hemispheric predominance on MEG and EEG (Figure 2A, B) during sleep. Single moving dipole analysis (with cursor at 14 and 6 Hz positive burst) localized the dipole source in the hippocampus with a high-amplitude (300–450 nAm) moment (Figure 2C–E) with dipole topography shown on Figure 2F. These were suggestive of 14- and 6-Hz positive bursts. Medium-amplitude spike and slow waves were seen over the left fronto-central region at F3 and Cz on EEG, correlating with his lesion. Magnetic source imaging showed extensive distribution of spike dipoles (total 60 dipoles) along the left Rolandic lesion (47 dipoles), bilateral mesial temporal regions (7 dipoles), left mesial parietal (2 dipoles), and right Rolandic region (4 dipoles). The cluster of 47 spike dipoles was located around the lesion (Figure 2G).
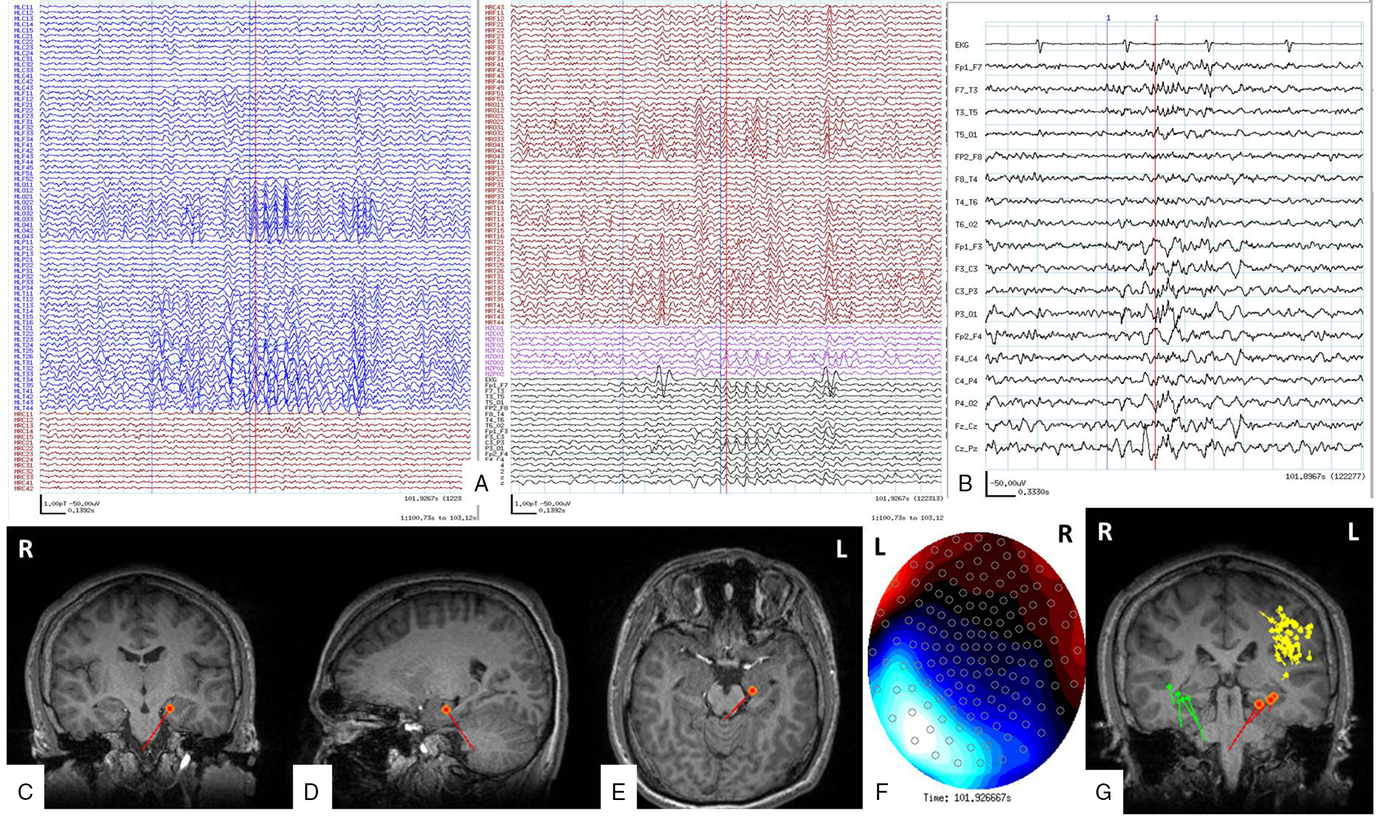
Figure 2: Magnetic source imaging of the reported patient. A shows MEG, EEG, and EKG (blue, left MEG channels; red, right MEG channels; pink, midline MEG channels; black, EEG). Red cursor is at the onset of 14 Hz discharges. Sensitivity is 1 pT/cm, timebase is 0.1392 second per time unit, band pass filter for MEG 10–70 Hz, sampling rate 1200 Hz. B shows simultaneous EEG in common averaged and bipolar longitudinal montage (sensitivity is 50 μV/cm, timebase is 0.1392 second per time unit). It shows 14 and 6 Hz discharges over the left hemisphere. C–E show the dipole source in the left hippocampus in coronal (C), sagittal (D), and axial (E) sections (single moving dipole analysis: 9.3% error and dipole moment 445 nAm). F is the topographical map which shows the source (blue) and sink (red) for the dipole shown in C–E. The residual error was 9%, implying a high signal-to-noise ratio. G shows the distribution of the selected spike dipoles in the MEG study: 47 spike dipoles (yellow) clustered in the left pre-motor gyrus, bottom of sulcus dysplasia sulcus through the Rolandic region to parietal and temporal operculum; 3 in left temporal region (red) with vertical orientation (14 and 6 Hz temporal discharges on EEG); and 4 spike dipoles (parrot green) in right temporal with vertical/horizontal orientation (14 and 6 temporal discharges).
Fourteen hertz and 6 Hz positive bursts are benign EEG variants commonly seen in adolescents with peak expression between 13 and 15 years of age.Reference Gibbs and Gibbs1,Reference Lombroso, Schwartz, Clark, Muench, Barry and Barry2 Their typical distribution is in the posterior temporal and parietal regions. McLachlan et al.Reference McLachlan and Luba3 recorded high-voltage 14 and 6 Hz bursts from the posterior mesial temporal strip electrodes in four patients. We had demonstrated their hippocampal origin in simultaneous stereo-EEG and scalp recordings.Reference Jain, Shafi and Ochi4 This association was further consistently demonstrated in four adult patients with non-temporal lobe epilepsy.Reference Kokkinos, Zaher and Antony5
In our case, magnetic source imaging of 14 and 6 Hz positive bursts showed that the corresponding dipoles localized in the hippocampus. Deep localization was probably obtained because of a high dipole moment (300–400 nAm). This localization is consistent with the previous reports of mesial temporal localization for 14 and 6 Hz positive bursts.Reference McLachlan and Luba3,Reference Jain, Shafi and Ochi4 A high dipole moment also is consistent with the very high-amplitude (>700 µV) spike waves noted intracranially in the hippocampus with 14 and 6 Hz positive bursts.Reference Jain, Shafi and Ochi4 The mechanism for this high-amplitude neuronal activity is unknown, but may be related to more synchronized hippocampal neuronal firing. We also speculate the “physiological” hippocampal activity projects posteriorly as compared to the anterior temporal spread of pathological hippocampal discharges.
The deep-seated source generator and the filtering effects of the skull lead to a lower-amplitude morphology of 14 and 6 Hz positive bursts on scalp EEG. However, the posterior temporal field on scalp EEG from a hippocampal source generator is interesting and may be related to the source orientation.
Conflicts of Interests
The authors have no conflicts of interest to declare.
Statement of Authorship
PJ provided clinical care to the patient. RS helped with the acquisition of neurophysiological data. HO, AO, and PJ analyzed the neurophysiological studies. PJ wrote the first draft, which was then read and approved by all the authors.
Ethics
Informed written consent for the publication of this report was obtained from the parents of patients as per the hospital guidelines.


