


Fe-deficiency anaemia (IDA) is a public health problem throughout the world, particularly in developing countries. Fe deficiency is especially prevalent among infants, children, pregnant women and women of childbearing age. The transition from normal levels to the development of IDA involves two sequential processes: Fe store depletion and Fe-deficiency erythropoiesis (IDE). There are no additional physiological phenomena associated with the development of Fe store depletion and IDE, so both are classified as subclinical Fe deficiencyReference Cook1. After exhaustion of the stored Fe compartment, a subsequent depletion in the functional Fe compartment, IDE and IDA, beginsReference Breymann2. Although the assessment of Fe status is notoriously difficult because of the lack of a sensitive index for screening specifically for Fe deficiency, insufficient Fe intake from food and poor Fe bioavailability are normally held responsible for IDAReference Iannotti, Tielsch, Black and Black3. The most widely used benchmarks to study IDA in the general population are the use of measurements of Hb and serum ferritin (SF), but this practice has been criticised. Therefore, it is critical to find a sensitive, specific and applicable biochemical marker to determine the magnitude of early-stage Fe deficiency. Currently, the concentration of serum transferrin receptors (sTfR) has been reported useful in the diagnosis of Fe deficiency. It is superior to the traditional laboratory methods for identifying Fe status because the sTfR levels do not appear to be influenced by inflammation and infection and sTfR levels have been reported to have low biological variabilityReference Piéroni, Mekhloufi, Thiolières, Hainque, Herson and Jardel4–Reference Khalid, McGrowder, Kemp and Johnson6.
However, sTfR studies mainly concentrate on its efficacy in the diagnosis of Fe deficiency. Little is known about the change trends and characteristics of sTfR levels during Fe supplementation. In the present study, we examine the responses of sTfR to Fe supplementation, discuss the dynamic changes characteristic of each stage, and provide evidence to show that sTfR can be used as a reliable indicator for assessing the efficacy of Fe supplementation.
Subjects and methods
Subjects
The study population originally consisted of 942 women, ranging in age from 18 to 45 years. They were recruited using advertisements and lectures in the suburban areas of Beijing and the Langfang City of Hebei Province and were taken from the lower or middle socio-economic stratum. Their levels of education and income, marital status and occupation were recorded at the time of their recruitment. A detailed clinical and anthropometric examination was conducted on all participants. Women with a history of smoking, alcohol use, haematological diseases, asthma, diseases of the musculoskeletal system or recent infections or recent pregnancy (within the last year) and women taking Fe supplements by mouth were excluded from the study. The medical ethics committee of Peking University approved the protocol. All participants provided signed consent forms after the nature of the study was provided to them.
Study design
The Fe status of all subjects was assessed at the onset of the present study by determining SF, Zn protoporphyrin (ZPP) and Hb levels in venous blood samples. According to the current standard of evaluating levels of Fe, the subjects were divided into four groups: normal, Fe store depletion, IDE and IDAReference Wang7. The evaluation standards for Fe-deficiency are: Fe store depletion, Hb > 120 g/l, ZPP < 1·4 μg/g, SF < 20 μg/l; IDE, Hb>120 g/l, ZPP>1·4 μg/g, SF < 20 μg/l; IDA, Hb < 120 g/l, ZPP>1·4 μg/g, SF < 20 μg/l8.
A total of 131 women were randomly selected from those with normal (n 55), IDE (n 31) and IDA (n 45) levels to determine sTfR. Among them, women with various stages of Fe deficiency (n 76) were included in the 12-week intervention study. Because low Fe storage does not equal Fe deficiency, and there are no additional physiological phenomena in the Fe store depletion stage, the women with Fe store depletion were excluded from the intervention study.
Laboratory analysis
After fasting overnight, blood specimens (4·0 ml) were obtained from the subjects by certified laboratory technicians to determine the parameters associated with Fe status. Blood specimens were processed at a local examination centre and sent to a laboratory in Beijing. Whole-blood specimens (0·02 ml) were added to light-avoided sterile heparin-anticoagulant tubes to determine ZPP levels using an accurate, well-calibrated ZPP haematofluorometer (microfluorescence method, ZPP haematofluorometer model 3800; Guangzhou Kangda Industry Co. Ltd, Guangzhou, Guangdong, China).
Whole-blood specimens (0·02 ml) were added to methaemoglobin cyanide dilution and Hb concentration was determined (methaemoglobin cyanide method, spectrophotometer model 724; Shanghai no. 3 Analysis Instrument Factory, Shanghai, China, and table-top multi-application oven-controlled oscillator model HZ-881K; Taicang Scientific Experimental Instrument Factory, Taicang, Jiangsu, China). The remaining blood was centrifuged (Freeze Centrifuge model DDL-5; Shanghai An Ting Scientific Instrument Factory, Shanghai, China) to isolate serum that was stored at − 70°C for determination of the SF and sTfR. The SF was determined by the radioimmunological method (intelligent γ RIA measurement instrument, model SN-695B; RuiHuan Instrument Factory of Shanghai Nuclear Research Institute, Shanghai, China) using a [125I]serum ferritin kit (The Atomic Energy Institute, Beijing, China). The sTfR was determined using a double antibody sandwich ELISA kit (R&D Systems, Minneapolis, MN, USA, and enzyme calibration enzyme-linked apparatus model 450; Bio-Rad Co., Hercules, CA, USA).
All members of the study team successfully completed a training programme on the aims of the study and the specific methods used. The biological measurements were standardised among laboratories according to the criteria of Peking University.
Iron supplementation
In the study, the women in the IDE and IDA groups were given different doses of Fe supplements for 12 weeks (14 mg/d for IDE; 28 mg/d for IDA) with ferrous l-threonate capsules that were provided by Beijing Juneng New Technique Co. Ltd (Beijing, China).
The Food and Drug Administration of China certified that the capsules contained 7 mg Fe and 30 mg vitamin C. The women were instructed to take the capsules between meals, with no change in their diets, and were asked to keep a record, on cards, of when the capsules had been taken. After taking Fe supplements, the parameters reflecting Fe status and sTfR levels were determined at weeks 0, 3, 6, 9 and 12.
Statistical analyses
The t test and variance analysis were used to compare the differences in all of the parameters among the three groups. Univariate correlation and multiple linear regression were used to analyse the relationship among the variables. Trends in sTfR and sTfR:SF over time were analysed using the χ2 test for trends. SF and sTfR showed skewness in distribution, so a log transformation was performed first to acquire normal distribution, and statistical analysis was then carried out. All the analyses were conducted with SPSS 10.0 for Windows (SPSS Inc., Chicago, IL, USA).
Results
Iron status and serum transferrin receptors levels in subjects
The results of sTfR and Fe-related biochemical indices before Fe supplementation are summarised in Table 1. Compared with the group of women with normal Fe levels, the sTfR, sTfR:SF, Hb, ZPP and SF levels differed significantly in Fe-deficient women (P < 0·05). Furthermore, the sTfR, sTfR:SF, Hb and ZPP levels in the IDA group differed significantly from the IDE group (P < 0·05). The sTfR and sTfR:SF levels were 2·28 and 3·91 times higher than those of normal controls, respectively.
Table 1 Values of serum transferrin receptor (sTfR) and iron-related biochemical indices in iron-deficient and normal subjects before iron supplementation
(Mean values and standard deviations)
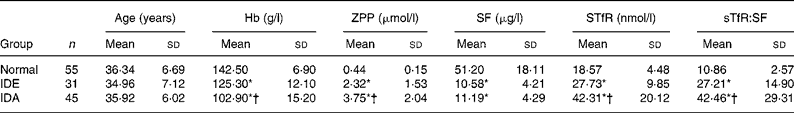
ZPP, Zn protoporphyrin; SF, serum ferritin; IDE, Fe-deficiency erythropoiesis; IDA, Fe-deficiency anaemia.
* Mean value was significantly different from that for normal women (P < 0·05).
† Mean value was significantly different from that for the IDE group (P < 0·05).
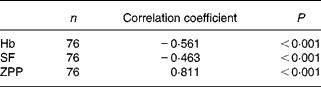
Correlation between serum transferrin receptors and iron-related biochemical indices
To determine if there might be an independent association between sTfR concentration and Fe-related biochemical indices, we examined the relationship of sTfR with concentrations of Hb, SF and ZPP. Among seventy-six subjects, there were significant negative correlations of STfR with Hb and SF and a significant positive correlation with ZPP. The correlation with ZPP was the most significant (Table 2). If sTfR was taken as a dependent variable and Hb, ZPP and SF were taken as independent variables to construct a multiple regression model, the multiple correlation coefficient was 0·821. ZPP was a significant variable and the correlation coefficient was 0·713. When the insignificant variable SF was eliminated and another regression model was constructed, the correlation coefficients of sTfR with ZPP and Hb were 0·722 and − 0·181, respectively.
Table 2 Relationships between serum transferrin receptor and iron-related biochemical indices haemoglobin, serum ferritin (SF) and zinc protoporphyrin (ZPP) in subjects with iron-deficiency erythropoiesis and iron-deficiency anaemia
Dynamic changes of serum transferrin receptors in various stages during iron supplementation
Fe supplementation was given to the IDE and IDA groups. Table 3 shows a significant treatment effect in Fe-deficient women over time. After the 12 weeks of Fe supplementation, sTfR levels were significantly changed. The χ2 test for trend showed statistically significant differences in sTfR levels at weeks 0, 3, 6,9 and 12 (P < 0·001 by χ2 test for trend). In the IDE stage, the sTfR level did not show significant change in the first 3 weeks. It decreased gradually after 3 weeks. sTfR concentration at week 6 was significantly lower than that at week 3 (P < 0·01), but there was no significant change from week 6 to week 12 and the sTfR level reached the normal range by the end of the study. In the IDA stage, the sTfR level decreased rapidly in the first 3 weeks. At weeks 3, 6 and 9, sTfR concentrations showed greatly significant changes and tended to reach normal levels at week 12 when Fe supplementation was complete. The details of these results are shown in Table 3 and Fig. 1.
Table 3 Dynamic changes of serum transferrin receptor (sTfR) in subjects with iron-deficiency erythropoiesis and iron-deficiency anaemia during iron supplementation
(Mean values and standard deviations)
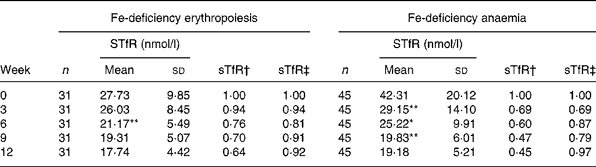
Mean value was significantly different from that for the previous week: *P < 0·05, **P < 0·01.
† Ratio of values of sTfR index in groups to those at week 0 (relative ratio with fixed base).
‡ Ratio of values of sTfR index in groups to those of the previous week (link-relative ratio).
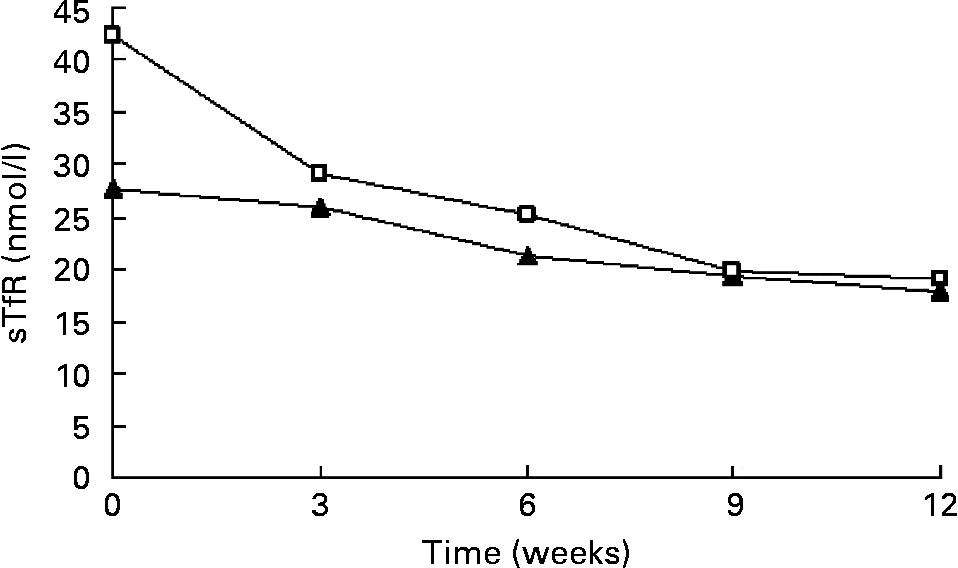
Fig. 1 Values of serum transferrin receptor (sTfR) in subjects with Fe-deficiency erythropoiesis (▲; n 31) and Fe-deficiency anaemia (□; n 45) during Fe supplementation. Values are means.
Dynamic changes of serum transferrin receptor:serum ferritin ratio during iron supplementation
The change trend of sTfR:SF values was basically consistent with sTfR (P < 0·001 by χ2 test for trend). In the IDA stage, sTfR:SF values had a significantly greater decrease at weeks 3, 6 and 12. However, sTfR concentration at that stage showed no significant changes at weeks 3 and 12 (Table 3). The details of these results are shown in Table 4 and Fig. 2.
Table 4 Dynamic changes of serum transferrin receptor (sTfR):serum ferritin (SF) ratio in subjects with iron-deficiency erythropoiesis and iron-deficiency anaemia during iron supplementation
(Mean values and standard deviations)
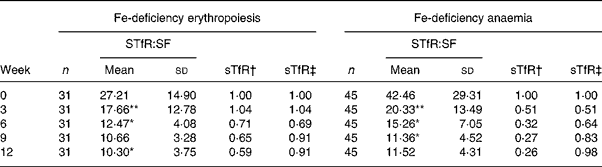
Mean value was significantly different from that for the previous week: *P < 0·05, **P < 0·01.
† Ratio of values of sTfR index in groups to those at week 0 (relative ratio with fixed base).
‡ Ratio of values of sTfR index in groups to those of the previous week (link-relative ratio).
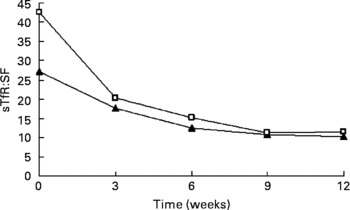
Fig. 2 Values of serum transferrin receptor (sTfR):serum ferritin (SF) ratio in subjects with Fe-deficiency erythropoiesis (▲; n 31) and Fe-deficiency anaemia (□; n 45) during Fe supplementation. Values are means.
Discussion
Transferrin receptor is a type of transmembrane glycoprotein expressed on virtually all cells. It can bind to Fe-carrying transferrin in plasma specifically, and transfers Fe into cells through receptor-induced endocytosisReference Ho, You, Chau, Hsu, Gau, Chen and Yu9. Its classic function is to regulate the uptake of Fe into the cells from circulating transferrin. sTfR present in serum is a truncated fragment of the membrane transferrin receptor and the concentration reflects tissue expressionReference Basora, Deulofeu, Salazar, Quinto and Gomar10, so sTfR expression is regulated by body Fe status. Fe deficiency is associated with increased sTfR levels and elevated Fe storage is associated with reduced sTfR concentration. Recently, sTfR has been proposed as a reliable parameter for assessing Fe status and erythropoietic activityReference Flesland, Eskelund, Flesland, Falch, Solheim and Seghatchian5, Reference Kasvosve, Gomo, Nathoo, Matibe, Mudenge, Loyevsky, Nekhai and Gordeuk11. In the present study, compared with subjects with normal levels of Fe, sTfR levels in women with IDE and IDA were significantly increased. With progressive Fe deficiency, the concomitant changes of sTfR appeared to be consistent with earlier studiesReference Kasvosve, Gomo, Nathoo, Matibe, Mudenge, Loyevsky, Nekhai and Gordeuk11 with their values greatly different from those with normal levels. In the present study, we found that sTfR was significantly increased with progressive Fe deficiency and the sTfR levels in the IDE and IDA groups were 1·49 and 2·28 times as high as those in the normal group, which suggests that sTfR is a sensitive parameter to detect Fe deficiency, even for subclinical Fe deficiency. However, the sTfR increment range in the present study was smaller than some other studies. For example, Kogho et al. studied forty-one IDA patients, and their sTfR levels were 2·8 times higher than the normal valueReference Kohgo, Nishisato, Kondo, Tsushima, Niitsu and Urushizaki12. Similarly, Flowers et al. conducted a study involving nineteen IDA patients, and the sTfR levels were 3·2 times higher than those in the normal groupReference Flowers, Skikne, Covell and Cook13. Such differences might be due to the different body Fe-deficiency levels among the subjects in the present study and theirs. The subjects in Kogho's and Flowers' study were hospital patients with very severe anaemia, while our subjects were selected from a ‘normal’ population and most had mild anaemia. In experiments with animals, the sTfR levels in rats with severe IDA were several times higher than those in the normal control groupReference Beguin, Huebers, Josephson and Finch14.
Through statistical analysis, highly significant direct associations were observed between sTfR concentration and these indices. sTfR had a negative correlation with Hb and SF and a positive correlation with ZPP. Its correlation with ZPP was the most significant. We further examined this relationship in multivariate linear regression models of sTfR by including Hb, ZPP and SF. In these models, ZPP was the best indicator of sTfR, possibly because both sTfR and ZPP reflect functional Fe status and erythropoietic activity, in contrast with Hb and SF. Hb reflects severe Fe deficiency and SF reflects Fe storage. Both of them show low sensitivity and specificity. This might explain the apparently significant association that we observed between sTfR with ZPP. Collectively, sTfR is highly correlated with functional Fe-deficiency biochemical indices. It can be used as an index to evaluate functional Fe status. It can also take the place of traditional Fe-related biochemical indices that are used by laboratories to detect Fe deficiency and to evaluate the efficacy of Fe supplementation because it is convenient, simple and practical.
Currently, there are few studies investigating sTfR characteristics during Fe supplementation and whether sTfR levels can be used as a reliable indicator for assessing the efficacy of Fe supplementation. In the present study, we implemented a 12-week oral Fe supplementation using Fe-deficient women. We compared the values of laboratory parameters reflecting Fe status before and after supplementation. There were no dietary restrictions during the supplementation and there were no dietary changes in the women during the study. After Fe supplementation, we found the levels of sTfR significantly decreased in women of childbearing age with IDE and IDA, while the levels of SF significantly increased. In the first 3 weeks, sTfR levels changed little in the IDE group but decreased rapidly in the IDA group. This was probably due to the fact that the Fe deficiency of the IDE group was less severe than that of the IDA group. Furthermore, compared with the change of sTfR levels in the IDA group, its response to Fe supplementation in the IDE group was slower. After 3 weeks, the sTfR levels in both groups decreased progressively and tended to remain steady at week 9, and reach normal levels at week 12. This indicated that sTfR levels began to return to normal when the body Fe was gradually supplemented. At week 6, the sTfR levels were close to the normal control group (18·57 (sd 4·48) nmol/l. This means that the body Fe-deficiency status was basically recovered after 6 weeks of Fe supplementation in both the IDE and IDA groups. In the following several weeks of Fe supplementation, the sTfR level still decreased gradually. This was probably due to the increase of Fe-storage compartments that occurred after that of the functional Fe compartments. Brutsaert et al. considered whether sTfR concentrations were related to erythropoietic activity and intracellular Fe requirementsReference Brutsaert, Hernandez-Cordero, Rivera, Viola, Hughes and Haas15; they were sensitive to Fe supplementation, during the improvement of Fe status. A study was performed in IDA patients for 16 weeks. It showed that the changes of sTfR occurred later than those of SF during Fe supplementation. When these two indices were combined, and sTfR:SF was used, its decrease accelerated along with the administration of Fe. After Fe supplementation, sTfR levels were significantly lower than that before Fe supplementationReference Brutsaert, Hernandez-Cordero, Rivera, Viola, Hughes and Haas15. Ward et al. considered that SF was the index for evaluating body Fe storage status, sTfR was the index for evaluating functional Fe status, and the ratio of sTfR:SF could be used to evaluate body Fe status comprehensivelyReference Ward, Kushner and Kaplan16. Skikne et al. found that the value of sTfR:SF was less than 100 when storage Fe was abundant, while this value was significantly increased with progressive Fe deficiency, reaching as high as 200 when there was severe deficiency of functional FeReference Skikne, Flowers and Cook17. In the present study, there was no significant difference in SF levels between the IDA stage and the IDE stage. When the sTfR:SF was taken as an observed index, its changing curve was basically parallel with sTfR. This ratio decreased significantly after Fe supplementation in both groups. In the IDE stage, it decreased from 27·21 (sd 14·90) before Fe supplementation to 10·30 (sd 3·75) after Fe supplementation, while it decreased from 42·46 (sd 29·31) to 11·52 (sd 4·31) in the IDA stage. Compared with the change of sTfR in IDA, the decrease of sTfR:SF was more significant during Fe supplementation. It shows that sTfR:SF is also a sensitive index for evaluating the efficacy of Fe supplementation. Because the determination of sTfR levels requires very small (ml) blood samples and requires a very simple analysis, it is more practical in evaluating the efficacy of the intervention.
The present study observed the trend of dynamic changes of sTfR and sTfR:SF during Fe supplementation. It indicates that both can be used as specific indices for determining the efficacy of Fe supplementation. It provides important evidence for using sTfR as a sensitive index for screening Fe deficiency and assessing the efficacy of Fe supplementation to alleviate Fe deficiency.
Acknowledgements
The present study was conducted at the Department of Nutrition and Food Hygiene, School of Public Health, Peking University, with funding from the Danone Nutrition Institute (38 Xueyuan Road, Beijing, 100083, China).


