


The incidence of type 2 diabetes in Western countries is increasing, also in correlation with the rise in obesity, which is now becoming a pandemic(Reference Nolan, Damm and Prentki1). This phenomenon is the result of drastic changes in lifestyle with a chronic disequilibrium between food consumption and energy expenditure(Reference Colagiuri2). Diet is the most important modifiable risk factor and the starting point in the treatment of obesity and type 2 diabetes: the primary line of treatment is based on a balanced diet with a proper distribution of nutrients aimed at lowering dietary consumption of saturated fats and refined carbohydrates (CHO) in favour of whole grains, fruits, vegetables and legumes(Reference O'Keef, Gheewala and O'Keefe3). Plant food, with a lower energy density, a lower glycaemic index, and a higher fibre and water content, induces a smaller glucose excursion after a meal. Furthermore, vegetable bioactive compounds show healthy properties when consumed by humans. Several compounds that have the ability to modulate the digestion and absorption of dietary CHO and fats in the digestive system have been identified and used in combination with low-saturated fat and low-glycaemic index diets. Among the above-mentioned compounds, α-amylase inhibitors, such as the synthetic drug ‘acarbose’, prevent the action of pancreatic α-amylase, which breaks down CHO into oligosaccharides, avoiding the passage through the brush border, and have been used to control the postprandial blood glucose response in type 2 diabetes(Reference Yamagishi, Matsui and Ueda4). Protein fractions of many legumes, in addition to soyabeans, are sources of natural inhibitors of hydrolases, such as proteases, amylases, lipases, glycosidases and phosphatases(Reference Duranti5–Reference Ishimoto, Suzuki and Iwanaga7). Phaseolus vulgaris seeds have been reported to contain 2–4 g/kg of non-fibre products that slow CHO absorption in the small intestine through enzyme inhibition. The administration of P. vulgaris extract (PVE) has been reported to have dose-dependent pharmacological effects in both obese and lean rats with a reduction in food intake, a consequent decrement in weight gain and an improvement in postprandial plasma glucose(Reference Menezes and Lajolo8). This starch blocker activity is attributed to the typical bean lectins α-amylase inhibitors (α-AI), phytohaemagglutinin and arcelins, which are synthesised as a defence mechanism against insects by plants. α-AI1 is the most widely distributed isoform in the common bean (9–11 % of the total seed protein)(Reference Lee, Gepts and Whitaker9), and has been shown to provide α-amylase inhibitory activity in humans(Reference Chokshi10, Reference Carai, Fantini and Loi11). A dose-dependent decrease in duodenal amylase activity and a delay in gastric emptying after ingestion of P. vulgaris α-AI1 extract, when supplemented in powder or tablet form with starch meals, have been reported(Reference Lajolo and Genovese12). A follow-up study on subjects with diabetes mellitus has demonstrated decreased postprandial glucose and insulin responses(Reference Radberg, Biernat and Linderoth13, Reference Preuss14). A dietary supplementation (1500–3000 mg/d) of a water extract of P. vulgaris (Phase 2®) has been demonstrated to promote weight loss and to reduce postprandial spikes in blood sugar(Reference Wu, Xu and Shen15, Reference Barrett and Udani16).
More recently, another PVE, Beanblock® (Indena S.p.A.), has been developed and employed in studies performed on animal models where a suppression of postprandial glycaemia and an anorexic effect were observed(Reference Carai, Fantini and Loi17). This PVE takes advantage of the synergic action of α-amylase inhibitory activity, with beneficial effects on carbohydrate metabolism, and of phytohaemagglutinin, with modulating effects on gut hormone secretion(Reference Fantini, Cabras and Lobina18). Particularly, phytohaemagglutinin binds the brush-border membrane of the intestine, stimulating cholecystokinin and glucagon-like peptide release and hormones with an anorexic effect and playing a relevant role in satiety control(Reference Baintner, Kiss and Pfuller19). However, satiety may be mediated by other physiological effects and specifically through postprandial ghrelin secretion. Ghrelin is a stomach-secreted orexigenic peptide that acts as a hunger signal; intravenous infusion of ghrelin increases food intake and enhances appetite(Reference Wren, Seal and Cohen20); in addition, plasma ghrelin concentrations rise gradually before a meal and decrease immediately after eating(Reference Cummings, Purnell and Frayo21, Reference Tschöp, Wawarta and Riepl22). No study, to our knowledge, investigated the ghrelin postprandial response to PVE, neither in animal models, nor in human subjects.
Therefore, the present study performed in healthy human subjects tested the acute administration of PVE as a supplement in a mixed balanced meal with two aims: (1) to evaluate the effects on glucose postprandial response, measuring glucose, insulin and C-peptide concentrations; (2) to investigate the effects on appetite control, assessing plasma ghrelin in association with satiety sensation ratings evaluated by the visual analogue scale.
Subjects and methods
Subjects
The present study was performed at the International Center for the Assessment of Nutritional Status (ICANS), University of Milan (Italy). A total of twelve healthy subjects (six females and six males), 20–26 years of age, with a normal weight (BMI 19·7–23·5 kg/m2, body fat 11·5–31·5 %) were recruited on a voluntary basis among students of the University of Milan. Exclusion criteria were as follows: overweight or obesity; presence of any disease causing significant impairment of nutritional status (i.e. Crohn's disease, neoplasia, end-stage renal failure, cirrhosis, congestive heart failure and chronic infection); presence of endocrine diseases (i.e. hyper–hypothyroidism and diabetes mellitus); consumption of medications affecting endocrine function within the previous 2 months; recent ( < 1 month) occurrence of acute illness or injury; elite athletism. The present study was conducted according to the guidelines laid down in the Declaration of Helsinki. Approval was obtained by the Institutional Ethical Committee and an informed consent was signed by all subjects.
Experimental protocol
The experimental design is described in Fig. 1. In a double-blind, randomised, cross-over study with a washout period of 7 d, the subjects fasted for at least 12 h, and received on two different days a mixed standardised meal (MixStMeal), consisting of a sandwich of white bread, ham, oil and tomato plus a 100 mg tablet of PVE or a 100 mg tablet of placebo ingested immediately before the meal. The MixStMeal satisfied 40 % of an individual's total energy requirement, estimated by multiplying resting energy expenditure (using the Harris–Benedict equation)(Reference Harris and Benedict23) by the corresponding physical activity level(24). Of the energy provided by the MixStMeal, 60 % was derived from carbohydrates, 25 % from lipids and 15 % from protein; the content of dietary fibre was 10 g.

Fig. 1 Experimental design (n 12). In each experiment, plasma glucose, insulin, C-peptide, ghrelin and subjective satiety sensation ratings (visual analogue scale) were assessed at fasting and after test meal consumption for 3 h. MixStMeal, mixed standardised meal; PVE, Phaseolus vulgaris extract.
The evening before each experiment, we asked subjects to consume a standardised dinner without legumes and consisting of rice or pasta dressed with oil and/or parmesan cheese and/or tomato sauce, meat or fish, vegetables seasoned with olive oil, bread and fresh fruit. The only drink recommended was water.
On the day of the test, the subjects arrived at the laboratory at 08.30 hours: they were seated in a comfortable room and after application of intravenous catheters into an antecubital vein, completed a short questionnaire assessing general well-being and fasting levels of satiety sensations (satiety and desire to eat, evaluated by the following questions: ‘How satiated do you feel?’ and ‘How great is your desire to eat?’, respectively). Scores were rated on a 100 mm visual analogue scale and anchored at either end with opposite statements (‘not all’ and ‘very much’)(Reference Hetherington, Rolls, Toates and Rowland25). The subjects were rescheduled if they had, for example, headache and/or had expressed high ratings for nausea and fullness. Satiety-related sensations were reassessed immediately after test meal consumption and every 30 min for 3 h. Venous blood samples were obtained at baseline and at 10, 20, 30, 45, 60, 90, 120 and 180 min after test meal consumption in order to assess plasma glucose, insulin, C-peptide and ghrelin. Blood samples were immediately centrifuged and plasma stored at − 80°C until laboratory analyses. Finally, we asked all subjects to fill in a Checklist of Medication Side Effects within 24 h after the experiments, in order to detect eventual adverse effects of PVE.
PVE used in the present study (Beanblock®; Indena S.p.A.) is a standardised dry extract containing an α-amylase inhibitor and phytohaemagglutinin. In particular, the extract is characterised by a standardised composition of a ≥ 6 % (w/w) tested α-amylase inhibitor, with inhibiting activity ≥ 1100 U/mg, and phytohaemagglutinin (haemagglutinating activity ≤ 30 haemagglutinating units/mg). The manufacturing process is described in detail in Fantini et al. (Reference Fantini, Cabras and Lobina18).
Laboratory analyses
We measured circulating levels of glucose and insulin at baseline and every 10 min in the first half hour and every 30 min thereafter; C-peptide at baseline and every 30 min, ghrelin at baseline and every 60 min. All parameters were assayed by a commercial kit (Roche Diagnostics) with Cobas Integra 400 Plus and Cobas 411 (Roche Diagnostic), except ghrelin which was assayed by a commercial ELISA kit (Millipore).
Statistical analysis
Statistical analysis was carried out using the SPSS program version 17. All data are presented as means with their standard errors. Tests for normality confirmed that all dependent variables were normally distributed. Repeated-measures ANOVA followed by the least significant difference test was used to assess the effects of time, treatment and the treatment × time interaction. Integrated AUC were calculated using the trapezoidal rule. The Student's paired t test was employed to evaluate the difference between AUC values and mean percentage changes. A P value below 0·05 was considered as statistically significant.
Results
Daily energy intake ranged from 8627 to 12 171 kJ (2062 to 2909 kcal), therefore energy consumption by the standardised meal provided from 3443 to 4941 kJ (823 to 1181 kcal).
Repeated-measures ANOVA showed a significant effect of time on glucose (F time(8,99) = 34·7, P= 0·002), insulin (F time(8,99) = 29·8, P= 0·003) and C-peptide (F time(5,66) = 107·2, P= 0·001), while no effect of treatment and no treatment × time interaction were observed (glucose: F treatment(1,22) = 1·50, P= 0·25; F interaction(8,99) = 0·48, P= 0·82; insulin: F treatment(1,22) = 2·41, P= 0·15; F interaction(8,99) = 1·24, P= 0·44; C-peptide: F treatment(1,22) = 3·62, P= 0·08; F interaction(5,66) = 0·89, P= 0·53).
Fig. 2(a) shows the kinetics of glucose, insulin and C-peptide after PVE or placebo supplemented to the MixStMeal. Fasting plasma glucose, insulin and C-peptide did not differ between the test meal studies.
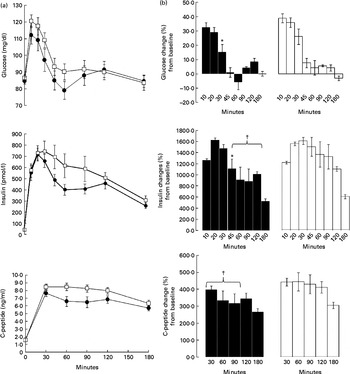
Fig. 2 (a) Fasting and postprandial glucose, insulin and C-peptide responses to the mixed standardised meal (MixStMeal) associated with Phaseolus vulgaris extract (PVE) (●) and placebo (□). Values are means, with their standard errors represented by vertical bars. There was a significant time effect (P< 0·05; repeated-measures ANOVA) for glucose, insulin and C-peptide. (b) Glucose, insulin and C-peptide changes (%) with respect to baseline after the MixStMeal associated with PVE (■) and placebo (□). * Mean value was significantly different from that of placebo, as percentage increment from basal (P< 0·05). † Mean value was significantly different from that of placebo, as percentage mean increment from basal during 45–120 min (P< 0·05).
Postprandial blood glucose concentrations peaked at 10 min after both tests without significant differences. Plasma glucose concentrations were significantly higher (P< 0·05) than baseline until 30 min after the MixStMeal with placebo, while until 20 min after the MixStMeal with PVE. In addition, at 30 min, we observed for PVE a significant lower percentage of blood glucose increment from basal with respect to placebo (+15·4 (sem 5·4) v. +26·1 (sem 7·3) %, P= 0·04; Fig. 2(b)). The 0–180 min AUC of glucose response did not differ between the PVE and placebo (P= 0·6).
Postprandial insulin concentrations peaked at 20 min for PVE and at 30 min for placebo without significant differences. At time periods between 45 and 120 min, insulin increased in percentage less after PVE supplementation than after placebo (+981 (sem 115) v. 1325 (sem 240) %, P= 0·04; Fig. 2(b)). The 0–180 min AUC of insulin response tended to be lower after PVE supplementation (P= 0·1).
Postprandial C-peptide concentrations peaked at 30 min after both tests without significant differences. At time periods between 30 and 90 min, C-peptide increased in percentage less after PVE supplementation than after placebo (+350 (sem 27) v. 439 (sem 30) %, P= 0·04; Fig. 2(b)). The 0–180 min AUC of C-peptide response was lower after PVE supplementation (P= 0·02).
Repeated-measures ANOVA of ghrelin showed a significant effect of time (F time(3,44) = 14·5, P= 0·01) and the treatment × time interaction (F interaction(3,44) = 51·7, P= 0·01) but no significant effect of treatment (F treatment(1,22) = 0·29, P= 0·61). Fig. 3(a) shows the kinetics of ghrelin after PVE or placebo supplemented to the MixStMeal. Fasting plasma ghrelin concentrations were not different between the two test meals. In the first 2 h, plasma ghrelin decreased similarly in both groups ( − 21 (sem 3·8) % PVE v. − 28 (sem 4·5) % placebo, P= NS); however, in the third hour, ghrelin rebounded with placebo, whereas it remained suppressed with PVE (+7·7 (sem 3·5) v. − 1·4 (sem 4·1) % during the interval from 120 to 180 min, P= 0·04; Fig. 3(b)).

Fig. 3 (a) Fasting and postprandial plasma levels of ghrelin after the mixed standardised meal (MixStMeal) associated with Phaseolus vulgaris extract (PVE) (●) and placebo (□). Values are means, with their standard errors represented by vertical bars. There was a significant interaction between treatment and time for plasma ghrelin (P= 0·001; repeated-measures ANOVA). (b) Ghrelin change (%) between 120 and 180 min after the MixStMeal associated with PVE (■) and placebo (□). Values are means, with their standard errors represented by vertical bars. * Mean value was significantly different from that of placebo (P= 0·04). (c) Sensations after the MixStMeal associated with PVE (●) and placebo (□). Satiety (![]() ) and desire to eat (
) and desire to eat (![]() ) over time (subtracted from baseline) registered by the visual analogue scale. Values are means, with their standard errors represented by vertical bars. * Mean value was significantly different from the peak value immediately after the meal (P< 0·05). There was a significant time effect for satiety (P= 0·001; repeated-measures ANOVA) and desire to eat (P= 0·002; repeated-measures ANOVA).
) over time (subtracted from baseline) registered by the visual analogue scale. Values are means, with their standard errors represented by vertical bars. * Mean value was significantly different from the peak value immediately after the meal (P< 0·05). There was a significant time effect for satiety (P= 0·001; repeated-measures ANOVA) and desire to eat (P= 0·002; repeated-measures ANOVA).
Fig. 3(c) shows the effect of PVE or placebo supplemented to the MixStMeal on satiety and desire to eat expressed as sensation ratings. Repeated-measures ANOVA of satiety and desire to eat showed no significant treatment × time interaction and no effect of treatment. However, a significant effect of time on satiety (P= 0·001) and desire to eat (P= 0·002) was observed.
Baseline visual analogue scale scores ( − 5 min before meal consumption) for the measured variables from the appetite questionnaires were not significantly different between the experiments (data not shown).
Satiety sensations similarly peaked immediately after consumption of both test meals without significant differences, remaining significantly higher than baseline until 180 min (P< 0·05). Despite the similar profiles, satiety significantly reduced from peak later with PVE (after 180 min) than with placebo (after 120 min).
The desire to eat decreased immediately after both tests, more profoundly with PVE than placebo ( − 7·4 (sem 0·6) v. − 6·3 (sem 0·6) cm, P= 0·06), remaining significantly lower than baseline until 180 min (P< 0·05). The 3 h AUC scores showed that PVE induced lower desire to eat than placebo (PVE: − 128 (sem 38) cm2/180 min v. placebo: − 109 (sem 32·4) cm2/180 min, P= 0·02).
Checklist of medication side effects
No significant adverse effects occurred, as no subjects reported any feelings of discomfort within 24 h after consuming PVE and placebo.
Discussion
A growing number of studies have indicated that the protein fraction of legumes has beneficial effects on health, improving the postprandial glycaemic response and reducing food intake and weight gain(Reference Udani, Singh and Barrett26, Reference Tormo, Gil-Exojo and De-Tejada27). The present study is the first to investigate the potential advantages of a new, standardised and purified dry extract of P. vulgaris on postprandial glucose metabolism and satiety in human subjects. In a double-blind, randomised, placebo-controlled trial, we administrated to healthy subjects a balanced mixed meal, representing 40 % of their total energy daily requirement, with or without 100 mg PVE. The amount of the PVE supplement was defined according to recommended safety levels in humans. Chokshi(Reference Chokshi28) reported that the no observed adverse effect level (NOAEL) in rats for Phase 2, a standardised extract derived from P. vulgaris, is 2500 mg/kg per d, allowing an acceptable daily intake of 6·0 g/d in humans. The PVE employed in the present study showed a NOAEL in rats of 1500 mg/kg per d (G Daniela, unpublished results, Università Cattolica del Sacro Cuore, Rome, Italy), allowing an acceptable daily intake of 3·75 g/d in humans, assuming a safety factor of 30 as suggested by Chokshi(Reference Chokshi28). Therefore, 100 mg, administered in concomitance with meals to test glycometabolic and appetite control, was a dose providing a broad safety margin because it was widely below the calculated acceptable daily intake.
We showed that PVE supplementation reduced the glucose response to the meal, in association with lower insulin and C-peptide excursions. The present results are consistent with those obtained by Fantini et al. (Reference Fantini, Cabras and Lobina18), who demonstrated reduced postprandial glycaemia in Wistar rats treated by intragastric administration of PVE and given unlimited access to a starch-enriched diet and water. In particular, the present study contributes to the mechanistic explanation of this effect because the concomitant reduction in insulin secretion supports the hypothesis that PVE slowed glucose absorption via α-amylase inhibition and consequently reducing β-cell stimulation. This is particularly interesting in the light of recent studies supposing that excessive β-cell secretory responses lead to hyperinsulinaemia and contribute to obesity, type 2 diabetes and insulin resistance(Reference Corkey29). Moreover, it has been reported that postprandial hyperglycaemia and hyperinsulinaemia are associated with the incidence of coronary artery diseases(Reference Cavalot, Petrelli and Traversa30, Reference Baltali, Korkmaz and Kiziltan31). Thus, the present results suggest that PVE supplementation could be useful and beneficial in diabetic and glucose-intolerant subjects, both with insulin resistance and insulin secretory defect, in order to modulate their postprandial CHO metabolism and to prevent health complications. These data encourage exploration of this hypothesis in glucose-intolerant subjects.
The second aim of the present study was to investigate the effects of PVE on appetite control, assessing plasma ghrelin levels in association with satiety sensation ratings. We measured ghrelin plasma concentrations before and after mixed meal consumption, and we invited the subjects to register on a visual analogue scale for rating satiety and desire-to-eat sensations. As expected, ghrelin decreased immediately after eating; thereafter it remained suppressed with PVE supplementation while it rebounded with placebo. Moreover, a concomitant reduction in satiety sensation ratings was observed in placebo, but not in PVE. These results led us to hypothesise that PVE could have slowed gastric emptying via inhibition of CHO hydrolysis, affecting ghrelin secretion and feelings of satiety. Therefore, the modulation of ghrelin secretion could operate through another mechanism, beyond that mediated by cholecystokinin and glucagon-like peptide release(Reference Carai, Fantini and Loi11), contributing to explain the effect of PVE on satiety and control appetite.
In addition, we showed that PVE significantly reduced the desire to eat. Maccioni et al. (Reference Maccioni, Colombo and Riva32) showed a reducing effect of a PVE on operant self-administration of a chocolate-flavoured beverage in rats: since the content of starch and complex sugars in the chocolate-flavoured beverage was negligible, they excluded a significant role of α-amylase inhibitory activity of PVE in the effect observed and hypothesised that additional mechanisms, probably involved in the central regulation of appetite, could be responsible for the satiating effect observed. Since the desire to eat expresses a motivation to eat not solely dependent on a gut-based sensation(Reference Stubbs, Hughes and Johnstone33), it is not possible to exclude the intervention of central mechanisms too. Further studies are warranted to better define the mechanisms on the basis of the efficacy of PVE in the control of appetite, with a particular focus on central mechanisms. These findings could be of therapeutic relevance if we consider that often in our clinical practice, obesity and overweight conditions are linked to abnormal craving of very palatable foods.
In conclusion, acute administration of PVE supplemented to healthy subjects reduced postprandial glucose, insulin and C-peptide excursions, suppressed ghrelin secretion and affected satiety sensations, inducing a lower desire to eat. Although these findings are preliminary and limited by the small experimental sample, they encourage further studies to test the effects of PVE supplemented in acute and chronic administration to obese, glucose-intolerant and diabetic subjects in order to evaluate the applicability and potential advantages of this product in these kinds of patients.
Acknowledgements
The present study was funded by Indena S.p.A. and ICANS (International Center for the Assessment of Nutritional Status), Milan, Italy. The authors thank Massimiliano Ruscica for his technical assistance in ghrelin analysis. The contributions of each author are as follows: S. R., A. B., A. R., P. Morazzoni and S. B. designed the research; A. S., S. R. and P. Magni conducted the research; A. R. and P. Morazzoni provided the PVE; A. S. analysed the data; A. S., S. R., A. B. and S. B. wrote the paper. The authors declare that there are no conflicts of interest.


