


Obesity is a leading public health problem in the developed countries of the world. In 2009–10, it was estimated that 35·9 % of US adults were obese( Reference Flegal, Carroll and Kit 1 ). Identification of factors that reduce the risk of obesity may aid in the development of dietary or behavioural strategies for body-weight management( Reference Swinburn, Caterson and Seidell 2 , Reference Zhu and Hollis 3 ). Accumulating evidence suggests that soup consumption is associated with a lower body weight or a reduced risk of obesity( Reference Bessa, Valente and Cordeiro 4 – Reference Moreira and Padrao 8 ). In addition, intervention studies( Reference Jordan, Levitz and Utgoff 9 , Reference Foreyt, Reeves and Darnell 10 ) have also reported that soup consumption as a component of a weight-loss programme results in a better outcome, compared with a traditional programme. However, it is not clear why soup consumption is beneficial for body-weight management.
Recent laboratory studies( Reference Mattes 11 – Reference Clegg, Ranawana and Shafat 13 ) have shown that soup is a food with a strong satiating property that can suppress short-term appetite or food intake. This raises the possibility that the beneficial effects of soup consumption on body weight could be due to an effect on energy intake. As these laboratory studies( Reference Mattes 11 – Reference Clegg, Ranawana and Shafat 13 ) are short-term interventions that only followed participants for a few hours after soup consumption, it is possible that the reduced appetite or food intake might have been compensated for by increased food intake at subsequent meals. Studies that investigate the association between soup consumption and daily energy intake in free-living conditions may help answer this question.
It has been shown that reducing the energy density (ED) of foods can reduce energy intake and body weight( Reference Bell, Castellanos and Pelkman 14 – Reference Ello-Martin, Ledikwe and Rolls 16 ). Moreover, epidemiological studies( Reference Vernarelli, Mitchell and Hartman 17 , Reference Kant and Graubard 18 ) have demonstrated a positive relationship between ED and body weight. In addition, a prospective study has found that participants who increased their dietary ED exhibited a greater weight gain over 8 years than those who decreased their dietary ED( Reference Bes-Rastrollo, van Dam and Martinez-Gonzalez 19 ). A key characteristic of soup is its high water content, and including it in the diet may lower the ED of the diet. As the human diet consists of various foods and beverages, the association between soup consumption and overall dietary ED warrants further investigation.
In addition to an effect on body weight, soup consumption may also improve the diet quality. An epidemiological study( Reference Galan, Renault and Aissa 20 ) of French adults has found that soup consumption is related to a higher dietary intake of vitamins including folate, β-carotene and vitamin C. To our knowledge, similar studies have not been conducted in the US population. Considering the higher prevalence of obesity in the USA( Reference Low, Chin and Deurenberg-Yap 21 ) and different dietary habits in different countries, a study using samples representing the general US population would fill the gap.
The objective of the present study was to determine the associations between soup consumption and daily energy intake, dietary ED and nutrient intake using the first dietary recall data collected in the National Health and Nutrition Examination Survey (NHANES). Another objective was to investigate whether soup consumption was associated with Healthy Eating Index (HEI)-2005, a parameter developed by the National Cancer Institute and United States Department of Agriculture (USDA) as a measurement of diet quality( Reference Guenther, Reedy and Krebs-Smith 22 , Reference Guenther, Reedy and Krebs-Smith 23 ). Based on previous findings, it was hypothesised that soup consumption is associated with a diet that is lower in ED with an increased HEI-2005 score.
Methods
Data source and study population
The NHANES( 24 ) is a survey administered by the National Center for Health Statistics to assess the health and nutritional status of non-institutionalised residents of the USA; it consists of an interview with demographic, socio-economic, dietary and health-related questions and physical examinations, as well as laboratory tests for subpopulations. The NHANES dietary interview component was What We Eat in America( 25 ). Since 2001, two 24 h dietary recalls have been collected. The participants were asked to provide the first 24 h dietary recall at a mobile examination centre. The second dietary recall was obtained by telephone 3–10 d later. There were several changes in What We Eat in America across the different survey cycles( 25 ). For example, in the NHANES 2003–4, total choline intake data were not available, and water consumption data were not collected during the 24 h dietary recall. Since 2005, total choline intake data have been added and water consumption data have been collected during the 24 h dietary recall. Complete details related to sampling methodology, survey instruments, data processing, quality controls and assurance of NHANES data are available on its website( 24 ). The NHANES were conducted according to the guidelines laid down in the Declaration of Helsinki, and all procedures involving human subjects were approved by the National Center for Health Statistics Research Ethics Review Board. Written consent was obtained from each adult participant and guardian of each child participant.
The NHANES data from the 2003–4, 2005–6 and 2007–8 survey cycles were combined to maximise the statistical power of the present study. These data are publicly available on the NHANES website( 24 ). Participants whose first dietary recall was reliable and met the minimum criteria as determined by the NHANES were initially included (n 27 181). Among these participants, 16 583 participants were further excluded as they met either of the following criteria: pregnant or lactating women (n 797) and age below 19 years or above 64 years (n 15 868). Children (age ≤ 18 years) and the elderly (age ≥ 65 years) were excluded because of their reduced energy intake and different dietary patterns( Reference Wurtman, Lieberman and Tsay 26 , Reference Briefel and Johnson 27 ). The final sample included 10 598 eligible participants.
Exposure and outcome variables
The USDA Food and Nutrient Database for Dietary Studies was used for dietary recall data processing in the NHANES, to assign each individual food to an eight-digit USDA food code, and to calculate portion sizes and nutrient intakes; in addition, a combination food type was assigned by the NHANES if different foods were eaten together (such as cereal with milk)( 24 ). Because of the different sample weight in the two dietary recalls, only data from the first dietary recall were used in the present study.
Soup reported in the first dietary recall was identified by the USDA food code. Detailed information on the USDA food coding scheme is available online( 28 ). The description of each USDA food code was initially screened using the keyword ‘soup’. All the identified soup items were manually examined to ensure the accuracy of classification. The final code for soup included all the USDA food codes with the first three digits of 147, 283, 323, 416, 584, 718, 723, 735, 746, 756 and 775, as well as another forty-two unique USDA food codes (e.g. 27114000 for ‘beef with soup’). A participant was classified as a soup consumer if he/she reported at least one soup item or had a combination food type of soup in the first 24 h dietary recall.
Body weight and height were measured by trained NHANES interviewers using standardised procedures with calibrated equipment. BMI was calculated by dividing body weight in kg by the square of height in m (kg/m2). Waist circumference was measured by a soft tape placed horizontally just above the iliac crest.
Dietary ED was estimated as the ratio of total energy content:weight of dietary items consumed (kJ/g). There are several methods to calculate ED depending on whether beverages or water is included in calculations( Reference Vernarelli, Mitchell and Hartman 17 , Reference Kant and Graubard 18 , Reference Vernarelli, Mitchell and Rolls 29 ). In the present study, ED was calculated in three ways: (1) ED1, using only foods; (2) ED2, using foods and beverages excluding water; (3) ED3, using foods and beverages including water. USDA food code was used to classify foods, beverages and water. Milk and milk drinks, fruit juice, vegetable juice, alcoholic beverages and non-alcoholic beverages (coffee, tea, soft drinks, etc.) were considered as beverages in the present analysis.
The HEI-2005 was used to assess diet quality( Reference Guenther, Reedy and Krebs-Smith 22 , Reference Guenther, Reedy and Krebs-Smith 23 ). In the present study, it was calculated based on a sample SAS code provided by the USDA Center for Nutrition Policy and Promotion( 30 ). The sample code used information from the MyPyramid Equivalents Database to convert food intake from the NHANES dietary data to MyPyramid serving sizes and computed the total HEI-2005 score and its component scores. The sample code and data files for the MyPyramid Equivalents Database are available online( 30 ).
Covariates
Demographic variables, including age, sex, race/ethnicity and ratio of family income:poverty, were used as covariates( Reference Wang and Beydoun 31 , Reference Papanikolaou and Fulgoni 32 ). In addition, total energy intake from foods and beverages or BMI was adjusted for each specific analysis where appropriate( Reference Papanikolaou and Fulgoni 32 , Reference O'Neil, Keast and Nicklas 33 ). For race/ethnicity, the participants were recoded into four ethnic groups: Hispanic; non-Hispanic White; non-Hispanic Black; other. The variable ‘ratio of family income:poverty’ was categorised into three groups: high ( ≥ 3·50); medium (1·86–3·49); low ( ≤ 1·85)( Reference Brauchla, Juan and Story 34 ).
Statistical analyses
Data were analysed using the Statistical Analysis Systems statistical software package version 9.3 (SAS Institute, Inc.). In all the analyses, 6-year sample weight and specific Statistical Analysis Systems survey procedures were used to account for the complex multi-stage design of the NHANES. The χ2 test (Proc SurveyFreq) was applied as a bivariate analysis for a comparison of demographic characteristics between non-consumers and soup consumers. Multivariate regression (Proc SurveyReg) was used to compare the covariate-adjusted BMI and waist circumference between non-consumers and soup consumers. It was also used to assess the associations between soup consumption and total energy intake, dietary ED, daily nutrient intake and HEI-2005 component scores. Observations with missing values were excluded from modelling. Data are presented as weighted percentages with their standard errors or adjusted least-square means with their standard errors where appropriate. Significance was considered as P< 0·05.
Because water consumption data were not reported during the 24 h dietary recall in the NHANES 2003–4, a sensitivity analysis for the ED data was carried out using dietary data from the NHANES 2005–8 with a 4-year sample weight.
Results
Characteristics of the participants
There were 1291 participants who reported soup consumption in their first dietary recall and 9307 participants who did not report any soup item in their first dietary recall. The weighted percentage was 11·9 (se 0·5) % for soup consumers and 88·1 (se 0·5) % for non-consumers, respectively. The demographic characteristics of the participants are summarised in Table 1. Compared with non-consumers, a higher percentage of soup consumers were females (P= 0·023) and a lower percentage were non-Hispanic White and non-Hispanic Black (P< 0·001). However, there was no association between soup consumption and the ratio of family income:poverty (P= 0·200).
Table 1 Characteristics of participants aged 19–64 years by soup consumption status: National Health and Nutrition Examination Survey 2003–8 (Weighted percentages with their standard errors)
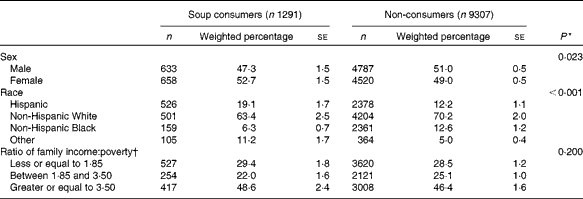
* χ2 P value was obtained from the bivariate analysis for the comparison between two groups.
† Total n was less than 10 598 due to missing values.
BMI and waist circumference
Covariate-adjusted BMI and waist circumference were significantly lower in soup consumers (P= 0·002 and 0·001, respectively). Adjusting for age, sex, race, ratio of family income:poverty and energy intake, the least-square mean of BMI was found to be 27·7 (se 0·3) kg/m2 in soup consumers. It was 28·7 (se 0·1) kg/m2 in non-consumers. Soup consumers had a mean waist circumference of 95·0 (se 0·7) cm; the waist circumference was 97·5 (se 0·3) cm in non-consumers.
Energy intake and dietary energy density
The least-square mean of total energy intake, adjusting for demographic covariates and BMI, was 9311 (se 164) kJ in soup consumers. It was 9599 (se 76) kJ in non-consumers with a trend towards a significant difference between the two groups (P= 0·087). Table 2 summarises the covariate-adjusted dietary ED for soup consumers and non-consumers. Soup consumption was found to be associated with a lower dietary ED, which was independent of the method used to calculate ED (P< 0·001 for all). The sensitivity analysis using dietary data from the NHANES 2005–8 yielded a similar result for dietary ED (data not shown).
Table 2 Dietary energy density (ED) of participants aged 19–64 years by soup consumption status: National Health and Nutrition Examination Survey 2003–8 (Least-square mean (LSM) values with their standard errors)
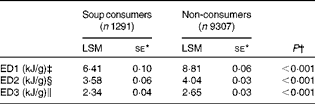
* Data were adjusted for age, sex, race, ratio of family income:poverty and BMI.
† P value for the comparison between soup consumers and non-consumers.
‡ ED estimated as energy from all food items divided by weight of all food items.
§ ED estimated as energy from all foods and beverages excluding water divided by weight of all foods and beverages excluding water.
∥ ED estimated as energy from all foods and beverages including water divided by weight of all foods and beverages including water.
Nutrient intake
Table 3 summarises the covariate-adjusted nutrient intake by the status of soup consumption. Soup consumption was found to be associated with a reduced intake of total fat (P< 0·001) and an increased intake of protein (P= 0·036), carbohydrate (P= 0·003), dietary fibre (P< 0·001), vitamin A (P< 0·001) and vitamin C (P= 0·002). In addition, the intake of minerals such as P, Mg, Fe, Cu and K was higher (P< 0·01 for all). Nonetheless, the intake of Na was also higher in soup consumers (P< 0·001).
Table 3 Nutrient intake of participants aged 19–64 years by soup consumption status: National Health and Nutrition Examination Survey 2003–8 (Least-square means (LSM) values with their standard errors)
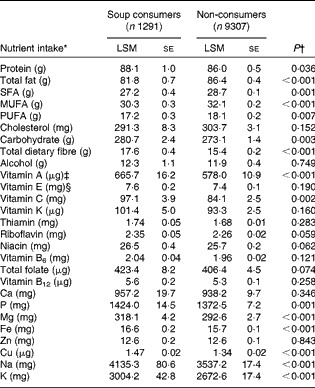
* Data were adjusted for age, sex, race, ratio of family income:poverty and energy intake.
† P value for the comparison between soup consumers and non-consumers.
‡ Vitamin A as retinol activity equivalents.
§ Vitamin E as α-tocopherol.
Diet quality
The total HEI-2005 score and each component score are summarised in Table 4. Soup consumers had a better diet quality, revealed by a higher total HEI-2005 score (P= 0·008). Compared with non-consumers, soup consumers had significantly higher intakes of most MyPyramid food groups including total fruits (P< 0·001), whole fruits (P= 0·004), total vegetables (P< 0·001), dark green/orange vegetables/legumes (P< 0·001) and total grains (P= 0·005). A lower score was observed for oil (P= 0·027). In addition, soup consumers had a better score for saturated fat (P< 0·001), as well as solid fats/alcohol/added sugars (P= 0·002). In agreement with the nutrient data indicating that soup consumption is associated with a higher intake of Na, a lower score was observed for Na in soup consumers (P< 0·001).
Table 4 Healthy Eating Index (HEI)-2005 total score and component score of participants aged 19–64 years by soup consumption status: National Health and Nutrition Examination Survey 2003–8 (Least-square mean (LSM) values with their standard errors)
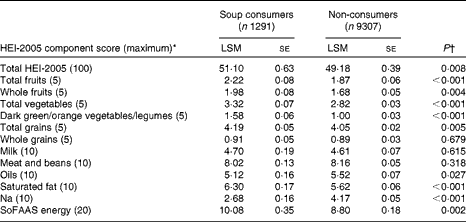
SoFAAS, solid fats/alcohol/added sugars.
* Data were adjusted for age, sex, race, ratio of family income:poverty and BMI.
† P value for the comparison between soup consumers and non-consumers.
Discussion
In agreement with previous studies( Reference Bessa, Valente and Cordeiro 4 – Reference Moreira and Padrao 8 ) that have investigated the associations between soup consumption and body weight, the results of the present study using nationally representative data demonstrated that soup consumption was inversely related to body weight and waist circumference. Daily energy intake tended to be lower in soup consumers. In addition, soup consumption was associated with a lower dietary ED and a higher total HEI-2005 score.
The satiating properties of soup have been studied by Mattes( Reference Mattes 11 ), who compared the difference in appetite and energy intake in response to an isoenergetic preload of apple juice, apple soup or apple. Apple soup was found to result in a lower rating for postprandial hunger and the median 24 h energy intake was the lowest when apple soup was consumed( Reference Mattes 11 ). Flood & Rolls( Reference Flood and Rolls 12 ) found that total energy intake from a soup preload and an ad libitum meal served 15 min later was significantly lower than energy intake from an ad libitum meal without a soup preload. A recent study carried out by Clegg et al. ( Reference Clegg, Ranawana and Shafat 13 ) has revealed that the appetite-suppressing effect of soup is due to a delayed gastric-emptying rate and an increased glycaemic response. By contrast, results obtained for energy intake in the present study revealed only a marginally significant difference. The smaller percentage of identified soup consumers (11·9 %) in the present study may have resulted in an insufficient statistical power for the comparison between soup consumers and non-consumers. The difference between the results of the present study and those of previous laboratory studies( Reference Mattes 11 , Reference Flood and Rolls 12 ) could possibly be due to dietary habits or the possibility that food choices may differ between laboratory and free-living conditions. Indeed, the study carried out by Mattes( Reference Mattes 11 ) revealed that apple soup received the lowest hedonic ratings among the test foods. Under free-living conditions, people may choose other foods if available, instead of eating a food that is less pleasant or palatable. Another possibility is that if soup was consumed as the last meal on the dietary recall day, the effect on postprandial appetite, if any, would not play an important role in the contribution to total energy intake as no further food is consumed subsequently on that day. In addition, some studies have shown that reduced appetite during a postprandial period may be short-lived and does not result in changed food intake at subsequent meals( Reference Zhu, Hsu and Hollis 35 , Reference Zhu, Hsu and Hollis 36 ). It remains unknown how long the appetite-suppressing effect of soup can last.
Previous studies using NHANES data had shown that dietary ED was positively related to body weight in both children( Reference Vernarelli, Mitchell and Hartman 17 ) and adults( Reference Kant and Graubard 18 ), although such associations disappeared when beverages were included in the calculation of ED( Reference Vernarelli, Mitchell and Hartman 17 , Reference Kant and Graubard 18 ). Because of the positive relationship between ED and body weight, BMI was included as another covariate in the analysis of ED data. The results indicated that when soup was consumed, covariate-adjusted dietary ED was significantly lower, even if water or beverages were included in the calculation of ED. These data suggest that a lower dietary ED could be a possible explanation for the beneficial effect of soup on body weight observed in weight-loss programmes( Reference Jordan, Levitz and Utgoff 9 , Reference Foreyt, Reeves and Darnell 10 ).
In the present study, soup consumption was found to be associated with a better diet quality as revealed by a higher total score of HEI-2005. A number of dietary factors, such as fruit or fruit juice consumption, are associated with a better diet quality( Reference O'Neil, Nicklas and Zanovec 37 , Reference Keast, O'Neil and Jones 38 ). The results of the present study indicated that the HEI-2005 component scores for both total fruits and whole fruits were higher when soup was included in the diet. In addition, scores for total vegetables as well as dark green or orange vegetables and legumes were also higher in soup consumers. The inclusion of fruits or vegetables in the diet may further reduce ED due to their higher water content. A higher intake of fruits or vegetables is associated with a reduced risk of weight gain( Reference Vioque, Weinbrenner and Castello 39 , Reference Buijsse, Feskens and Schulze 40 ), which may partly explain the beneficial effect of soup consumption on body weight. Another reason could be that soup consumption is related to a better score for solid fats/alcohol/added sugars, suggesting that energy from solid fats, alcohol and added sugars in the diet is lower in soup consumers. Moreover, the lower scores for oil in soup consumers, together with nutrient data indicating reduced fat intake when soup is consumed, indicate that low energy intake from dietary fat may have contributed to a lower body weight observed in this population.
In the present study, it was found that soup consumption was related to increased dietary fibre intake. Dietary fibre exerts beneficial effects on appetite( Reference Zhu and Hollis 41 ), glycaemic control( Reference Panahi, Ezatagha and Temelli 42 ) and gastrointestinal heath( Reference Tantamango, Knutsen and Beeson 43 ) due to its rheological properties and its fermentability( Reference Anderson, Baird and Davis 44 ). The effect of dietary fibre on body weight was reviewed by Pereira & Ludwig( Reference Pereira and Ludwig 45 ). It was suggested that dietary fibre may aid in body-weight regulation as reduction in insulin secretion or energy intake when dietary fibre was ingested would contribute to increased fat oxidation and reduced fat storage( Reference Pereira and Ludwig 45 ). Therefore, increased dietary fibre intake associated with soup consumption may provide an additional explanation for those studies that have shown that soup consumption has beneficial effects on body weight( Reference Jordan, Levitz and Utgoff 9 , Reference Foreyt, Reeves and Darnell 10 ).
In the present study, it was also found that soup consumption was associated with a higher intake of vitamins A and C, as well as several minerals. Similar results have been reported from a cross-sectional survey in a French population( Reference Galan, Renault and Aissa 20 ). Moreover, randomised controlled trials have also shown that soup consumption over several weeks results in a better bioavailability of carotenoids( Reference Martinez-Tomas, Larque and Gonzalez-Silvera 46 ) or vitamin C( Reference Sanchez-Moreno, Cano and de Ancos 47 ). Although the results of the present study support these findings, it was observed that soup consumption was also related to a higher intake of Na, with a corresponding result of a lower score for the Na component of HEI-2005. At this stage, it remains unclear whether the excessive Na intake was from soup itself or other dietary sources. Considering the negative impact of high Na intake on cardiovascular health( Reference He, Ogden and Vupputuri 48 ) and mortality( Reference Alderman, Cohen and Madhavan 49 ), it is recommended that low-Na soup products be chosen and the amount of table salt used in food processing and preparation be reduced.
The study has some limitations. First, although the NHANES used a number of approaches to help participants provide a more accurate dietary recall, such as provision of tools for the estimation of food portion size, it may still be subject to a self-report bias. Second, although intervention studies have shown that soup consumption has a beneficial effect on body weight( Reference Jordan, Levitz and Utgoff 9 , Reference Foreyt, Reeves and Darnell 10 ), the association between soup consumption and body weight observed in the present study does not indicate any causal relationship as it was a cross-sectional survey. Third, soup consumers were identified using a 24 h dietary recall; therefore, the non-consumer group in the present study may consist of people who consumed soup regularly but did not consume soup on the dietary recall day. In addition, it was observed that the participants frequently consumed soup with other foods at the same time; as a result, the type of soup consumed was not investigated due to the complexity of soup components. Future studies are required to determine whether the type of soup consumed has different effects. Despite these limitations, the present study is the first to show that when soup is included in the diet in free-living conditions, it is associated with a better diet quality and a reduced dietary ED. This may provide mechanistic explanations for intervention studies showing a beneficial effect of soup consumption on body weight. Nonetheless, as high Na intake is also associated with soup consumption, consumers should be aware of this and choose products low in Na for a healthier diet.
Acknowledgements
The authors thank the participants and researchers of the NHANES who made the data available. The present study received no specific grant from any funding agency or commercial or not-for-profit sectors. Y. Z. and J. H. H. designed the present study. Y. Z. carried out the data analysis. Y. Z. and J. H. H. prepared the manuscript. The authors declare no conflicts of interest.


