


Whole-grain intake appears to play an important role in the prevention of major lifestyle diseases such as type 2 diabetes, CVD and some types of cancers( Reference Lillioja, Neal and Tapsell 1 , Reference Borneo and Leon 2 ). In 2011, the World Cancer Research Fund/American Institute for Cancer Research upgraded the evidence for an inverse association between dietary fibre intake and colorectal cancer risk from ‘probable’ to ‘convincing’( 3 ). The association between dietary fibre intake and colorectal cancer risk seems in particular to be strong for cereal fibre and whole grains( Reference Aune, Chan and Lau 4 ). Evidence for an association between whole-grain intake and some cancers, e.g. colorectal cancer, is less strong than that for dietary fibre intake, because few studies have provided accurate information on whole-grain intake( 3 – 5 ).
The measurement of dietary intake in general is challenging( Reference Freedman, Schatzkin and Midthune 6 ), but that of whole-grain intake might be particularly prone to measurement errors because there is a large variation in whole-grain content in different products and consumers may have difficulty in recognising whole-grain products among other products( Reference van Dam and Hu 7 ). These together with the lack of a common definition of whole-grain products make comparison of whole-grain intake between studies and countries difficult( Reference Frolich and Aman 8 ).
Alkylresorcinols (AR) have been evaluated as valid concentration biomarkers of whole-grain wheat and rye intake( Reference Landberg, Kamal-Eldin and Andersson 9 ). AR are phenolic lipids found in the bran fraction of rye, wheat and barley. However, the amount of AR found in barley is very small, and barley is not consumed in high amounts in Europe. Therefore, AR are almost exclusively present in whole-grain wheat and rye products or in products with added wheat or rye bran, and only traces or low quantities are found in refined products( Reference Ross and Kochhar 10 ). AR are generally not affected by food processing, are absorbed in the small intestine( Reference Ross, Kamal-Eldin and Lundin 11 ) and can be measured in blood plasma. Intervention studies have shown that plasma AR concentrations are significantly affected by the dietary intake of whole-grain wheat and rye( Reference Landberg, Kamal-Eldin and Andersson 12 ). In observational studies, a moderate correlation (r 0·25–0·54) has been found between plasma concentrations of AR and intake of whole-grain foods estimated from FFQ( Reference Landberg, Kamal-Eldin and Aman 13 , Reference Ross, Pineau and Kochhar 14 ). Despite a relatively short elimination half-life of approximately 5 h( Reference Landberg, Linko and Kamal-Eldin 15 ), AR concentrations in a single fasting sample reflect the long-term concentrations (1 month to 4 years) relatively well in populations with a frequent and stable intake( Reference Montonen, Landberg and Kamal-Eldin 16 , Reference Landberg, Aman and Hallmans 17 ). There are five AR homologues in wheat and rye: C17 : 0; C19 : 0; C21 : 0; C23 : 0; C25 : 0. The ratio between two of the homologues (C17 : 0/C21 : 0) can be used to determine whether the whole-grain diet is mainly dominated by wheat or rye( Reference Chen, Ross and Aman 18 ). Ratios lower than 0·2 in plasma indicate an intake dominated by wheat and higher ratios indicate that whole-grain rye is also consumed( Reference Landberg, Kamal-Eldin and Andersson 9 , Reference Linko, Juntunen and Mykkanen 19 , Reference Landberg, Aman and Friberg 20 ).
Information on whole-grain intake in Europe is scarce, and due to the different definitions of whole grains and the variation in whole-grain products consumed in the different countries, comparison of whole-grain intake is difficult. Information on AR concentrations in different populations might be useful to examine relative differences in whole-grain intake between countries, as well as serve as an objective ranking tool for whole-grain wheat and rye intake in relation to disease endpoints in observational studies. However, data on AR concentrations and AR C17 : 0/C21 : 0 ratios from observational studies representing different countries are limited.
Therefore, the aim of the present study was to evaluate the group-level variability in total AR concentrations and concentrations of the five AR homologues (C17 : 0, C19 : 0, C21 : 0, C23 : 0 and C25 : 0) as well as assess the C17 : 0/C21 : 0 ratio in plasma samples collected from participants from ten Western European countries using data from the European Prospective Investigation into Cancer and Nutrition (EPIC).
Subjects and methods
Study population and data collection
The EPIC cohort is a large multicentre cohort study of more than half a million European participants. The cohort consists of participants from twenty-three centres in Denmark, France, Germany, Greece, Italy, the Netherlands, Norway, Spain, Sweden and the UK.
Most of the participants were recruited from the general population, except for the French cohort (a teacher's organisation health insurance programme), the Italian (Florence and Turin) and Spanish cohorts (mostly blood donors), the Utrecht (the Netherlands) cohort (women attending mammographic screening programmes), and part of the Oxford (UK) cohort. The EPIC-Norfolk and EPIC-Oxford cohorts are the two UK cohorts included in the EPIC cohort. The EPIC-Norfolk cohort represents the general population, while the EPIC-Oxford cohort comprises participants from the general population as well as vegetarians and health-conscious people. In the present study, only one of the Swedish cohorts was included (Umeå), as biological samples were not available from the Malmö cohort. At baseline (1993–8), lifestyle questionnaire, dietary questionnaires and anthropometric data were collected from the participants( Reference Riboli, Hunt and Slimani 21 ).
Biological samples, including plasma samples, were collected at baseline from 385 747 of the 519 978 EPIC participants and stored for later use. Samples from all centres were processed and aliquoted at the local study centres. After that, samples from Denmark and Sweden were stored in tubes at − 150°C under N2 vapour in a biobank in Copenhagen, Denmark, or in − 80°C freezers in Umeå, Sweden. Samples from the other eight countries were stored in heat-sealed straws at − 196°C under liquid N2 at the International Agency for Research on Cancer (IARC) biobank in Lyon, France( Reference Riboli, Hunt and Slimani 21 ). The study was approved by the Ethical Review Board of the IARC and the ethical committees of the participating centres. All participants provided informed consent, and procedures were in line with the Declaration of Helsinki.
A total of 3100 men and women (1550 colorectal cancer cases and 1550 matched controls) from a nested case–control study on AR in relation to colorectal cancer risk were included in the present study. Only plasma samples from 3059 participants were retrieved, as plasma samples from forty-one participants were not available in the biobanks. AR concentrations were successfully analysed in only 2849 samples of the initial 3100 samples, mostly due to missing samples or to insufficient volume rather than due to laboratory errors. When the blood samples were drawn, 28 % of the participants were fasting (>6 h since the last meal).
Estimation of dietary fibre intake
Information on ‘habitual’ dietary intake was collected from each participant with validated country-specific dietary questionnaires( Reference Riboli, Hunt and Slimani 21 ). Cereal fibre intake was estimated using the standardised EPIC Nutrient Database( Reference Slimani, Deharveng and Unwin 22 ). In the EPIC Nutrient Database, dietary fibre intake definitions are based on the gravimetric method developed by the Association of Official Agricultural Chemists( Reference DeVries and Rader 23 ) for all countries, except for the UK and Greece, where the Englyst method is used( Reference Englyst, Quigley and Hudson 24 ).
Laboratory analyses
During a period of 1 year, the concentrations of plasma AR homologues (C17 : 0, C19 : 0, C21 : 0, C23 : 0 and C25 : 0) were determined using a GC–MS method in which molecular ions were used for quantification in a single-ion monitoring mode( Reference Landberg, Aman and Kamal-Eldin 25 ). For each participant, 200 μl of plasma were used. The samples were randomised, but matched case–control pairs were analysed together. In each batch, four quality control samples were included. The within-day and between-day precision values expressed as CV were 11 and 22 %, respectively. Plasma concentrations of the individual homologues (C17 : 0, C19 : 0, C21 : 0, C23 : 0 and C25 : 0) and their sum (plasma total AR concentrations) were used in the statistical analyses.
Determination of the alkylresorcinol C17 : 0/C21 : 0 ratio
The AR C17 : 0/C21 : 0 ratio may indicate whether the diet is dominated by whole-grain wheat or rye. Among the cereals, the ratio is typically 0·1 in common wheat, 0·01 in durum wheat and 1·0 in rye( Reference Chen, Ross and Aman 18 ). In human plasma samples, factors other than dietary intake also affect the C17 : 0/C21 : 0 ratio to some extent. Under controlled intervention conditions, the ratio is typically 0·1–0·2 and 0·6–0·8 after whole-grain wheat and rye consumption, respectively( Reference Landberg, Kamal-Eldin and Andersson 12 , Reference Kristensen, Toubro and Jensen 26 ). A low ratio ( < 0·2) is indicative of a wheat-dominated diet and a higher ratio is indicative of a rye-dominated diet.
Exclusions
In total, 2849 samples were successfully analysed for AR concentrations, and four of these samples were excluded because of missing data on covariates, leaving 2845 samples to be included in the statistical analyses.
Statistical analyses
The distribution of AR and AR homologues was skewed and was, therefore, normalised by log transformation (natural logarithm). Mean values for total AR and AR homologues on the logarithmic scale were calculated, and geometric mean values and standard deviations were obtained by back transformation.
In all country-specific analyses, the UK cohort was included as two separate groups (UK general population and UK ‘health conscious’), because part of the EPIC cohort in Oxford was over-represented by health-conscious people and vegetarians, and thereby it might have whole-grain intake different from that of the UK cohort representing the general population (EPIC-Norfolk). Therefore, the health-conscious part of the Oxford cohort was grouped alone and the remainder of the Oxford cohort was merged with the Norfolk cohort to form the group ‘UK general population’.
Correlations between plasma total AR concentrations and cereal fibre intake were investigated using Pearson's correlations, both crude and partial Pearson's correlations adjusted for sex and fasting status (no: < 3 h, in between: 3–6 h, and yes: >6 h).
The t test was used to test the null hypothesis of no difference in plasma total AR concentrations between cases and controls. As no difference was found (P= 0·59), it was decided to include both cases and controls in the study. The t test was also used to test whether plasma total AR concentrations and the ratio between two of the AR homologues (C17 : 0/C21 : 0) differed by sex and by fasting status. Differences in mean values for countries were tested using the F test.
The analyses were carried out using the SAS® software (version 9.3; SAS Institute, Inc.). The UNIVARIATE and FREQ procedures were used for descriptive statistics. The TTEST procedure was used for the t test. The CORR (Pearson) procedure was used for the correlation analyses. P values (two-sided) lower than 0·05 were considered to be statistically significant.
Results
In total, 2845 participants from ten European countries were included in the present study, with the largest group being from Denmark (n 732) and the smallest from Norway (n 33). The participants had a median age (5th–95th percentile) of 59 years (46–71 years) and a median BMI (5th–95th percentile) of 26 kg/m2 (21–34 kg/m2). Blood plasma samples were drawn in 1993–2001, and 28 % of the participants were fasting when the blood samples were drawn (Table 1).
Table 1 Lifestyle, socio-economic and dietary characteristics of 2845 participants from the European Prospective Investigation into Cancer and Nutrition (EPIC) (Median values and 5th (P5)–95th percentiles (P95); number of participants and percentages)

Plasma total AR concentrations varied substantially between the ten countries (Fig. 1 and Table 2). A statistically significant difference in plasma total AR concentrations was found between the countries (P< 0·001). When not taking fasting status into account (Fig. 1(a) and Table 2), plasma total AR concentrations were highest in the Danish and UK cohorts, with geometric mean concentrations being 63 nmol/l in the Danish cohort and 70 and 63 nmol/l in the UK cohorts representing ‘health-conscious’ and the general population, respectively. A statistically significant difference was found in plasma total AR concentrations by fasting status (P< 0·001). Among the participants who were fasting when the blood samples were drawn, the highest mean total AR concentrations were found in Swedish men (49 nmol/l), whereas low concentrations were found in participants from the Mediterranean countries in general (mean AR concentrations: fasting < 23 nmol/l; Fig. 1(d) and Table 3). However, a mean total AR concentration of 37 nmol/l was found in Greek women, but this value was based on only ten participants. No difference in mean total AR concentrations was found between men and women, except in the Italian, Spanish, Danish and Swedish cohorts, where men had higher concentrations. Mean plasma total AR concentrations did not seem to be significantly different depending on age (data not shown).

Fig. 1 Geometric mean plasma total alkylresorcinol (AR) concentrations (nmol/l) by country (by centre for the UK) in 2845 participants from the European Prospective Investigation into Cancer and Nutrition (EPIC): (a) for all participants (n 2845); (b) non-fasting: for participants who had their plasma samples drawn at < 3 h since the last meal (n 1354), (c) in between fasting: for participants who had their blood samples drawn at 3–6 h since the last meal (n 621), (d) fasting: for participants who had their blood samples drawn at more than 6 h since the last meal (n 792). A total of sixty participants had unknown fasting status, and eighteen participants were part of the group consisting of less than ten participants. Therefore, these were only included in the analyses where fasting status was not taken into account (a). (A colour version of this figure can be found online at http://www.journals.cambridge.org/bjn)
Table 2 Cereal fibre intake, percentage of cereal fibre in total dietary fibre, plasma alkylresorcinol (AR) concentrations (total, C17 : 0, C19 : 0, C21 : 0, C23 : 0 and C25 : 0) and C17 : 0/C21 : 0 ratios by country (by centre for the UK) of 2845 participants from the European Prospective Investigation into Cancer and Nutrition (EPIC) (Mean values and standard deviations)

* Geometric mean.
† Cohort consists of only women.
Table 3 Plasma total alkylresorcinol (AR) concentrations and AR homologue C17 : 0/C21 : 0 ratio by country (centre for the UK) and fasting status of 2845 participants from the European Prospective Investigation into Cancer and Nutrition (EPIC) (Mean values and standard deviations)

* Geometric mean.
† Cohort consists of only women.
‡ Category consists of less than ten participants and therefore results are not reported.
§ Information on fasting status was not available for sixty participants. Therefore, they were not included in the analyses stratified by fasting status (these participants were from the following countries: Germany – two participants; the Netherlands – six participants; UK general population – twenty-two participants; UK ‘health conscious’ – fourteen participants; Denmark – six participants; Norway – ten participants).
A high median C17 : 0/C21 : 0 ratio ( ≥ 0·30) was observed in the German, Danish and Swedish cohorts, indicating that a proportionally higher amount of rye was being consumed by the participants from these countries (Table 2). In the Greek, Italian, Dutch and British cohorts, a low median ratio was found ( < 0·20), indicating that the AR-containing whole-grain diet in these countries is dominated by wheat. No difference in the mean C17 : 0/C21 : 0 ratio was found depending on sex, except in the German and Danish cohorts, where women had higher statistically significant ratios. The ratio differed according to fasting status (P< 0·001); in general, the ratio was higher in fasting samples (Table 3).
Cereal fibre intake was correlated with plasma total AR concentrations (Table 4). When stratifying by country, a statistically significant positive correlation was found (partial Pearson's r 0·12–0·35), except for France, Greece, UK ‘health conscious’ and Norway. For Sweden, a statistically significant positive correlation was observed only for the crude Pearson correlation and not when corrected for sex and fasting status. The overall partial correlation for all participants was 0·22 for cereal fibre (P< 0·001). Overall, the correlations were similar for men and women (data not shown).
Table 4 Pearson's correlations between plasma total alkylresorcinol concentrations and cereal fibre intake by country (centre for the UK) of 2845 participants from the European Prospective Investigation into Cancer and Nutrition (EPIC) (Pearson's correlations and P values)
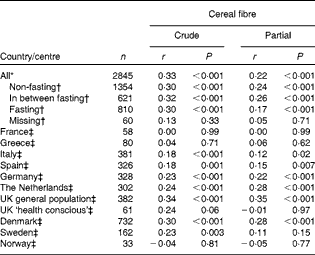
* Partial model corrected for fasting status, sex and country (centre for the UK).
† Partial model corrected for sex and country (centre for the UK).
‡ Partial model corrected for fasting status and sex.
Discussion
Large variations in plasma AR concentrations were found across Western Europe, with 2–3-fold higher concentrations being observed in Central Europe and in Scandinavia than in the Mediterranean countries.
Several weaknesses should be considered when interpreting the results of the present study. First, samples analysed in the present study were selected from a nested case–control study on colorectal cancer among participants in the EPIC study and therefore the number of participants per country and the fasting status were different within and between the countries. In some of the included countries, e.g. Norway, the number of participants included was small (n 33). Therefore, especially these results should be interpreted with care. Only a single sample was available from each participant. However, the medium- to long-term reproducibility has been shown to be modest to good for fasting samples collected from different populations with a frequent intake of whole grains( Reference Montonen, Landberg and Kamal-Eldin 16 , Reference Landberg, Aman and Hallmans 17 ). The measurement of plasma AR concentrations was carried out in singlets, and the analytical between-day variation was rather large. Furthermore, no information on whole-grain intake is available for the entire EPIC cohort. Therefore, we used cereal fibre intake as a crude proxy for whole-grain intake, although cereal fibre also included oats and other cereals, which do not contain AR. Previous studies have shown weaker correlations between cereal fibre intake and plasma total AR concentrations in plasma than for whole-grain intake, probably due to differences in the sources of cereal fibre in different populations( Reference Andersson, Marklund and Diana 27 ). The higher C17 : 0/C21 : 0 ratios in non-fasting samples than in the fasting samples are in line with previous findings and suggest that the AR homologues are subject to some differences in elimination( Reference Landberg, Linko and Kamal-Eldin 15 ). Therefore, it still needs to be clarified to what extent the C17 : 0/C21 : 0 ratio is affected by difference in the metabolism of AR homologues. The present study included mostly middle-aged Europeans and not all subcohorts included were population based. Therefore, the results cannot be confidently extrapolated to the general Western European population.
The present study has a number of strengths. Importantly, the plasma samples of participants from all the ten included countries were assayed at the same time in the same laboratory using the same method and were randomised in different batches. This ensures that differences between the countries are not due to laboratory differences. Furthermore, a standardised food composition database was used to estimate cereal fibre intake for the entire EPIC cohort.
When not taking fasting status into account, the highest concentrations of AR were observed in the Scandinavian and Central European cohorts and the lowest concentrations in the Mediterranean region cohort. The comparably low concentrations among Swedes and Norwegians were probably because many of the Swedish and Norwegian participants were fasting when their blood samples were drawn. Surprisingly, plasma total AR concentrations in samples drawn from fasting UK participants were similar to what was found in the samples of participants from most of the Central European and Scandinavian countries. This is surprising because whole-grain intake is believed to be lower in the UK( Reference Thane, Jones and Stephen 28 ) than, for instance, in Scandinavia( Reference Kyro, Skeie and Dragsted 29 ). Furthermore, calculations of AR intake from food supply data and food composition data also indicate that AR intake is lower in the UK than in Sweden( Reference Ross, Becker and Chen 30 ). There are no obvious explanations for the high concentrations observed in participants from the UK, but they are probably due to the high intakes of wheat bran or food products containing flour with a high extraction rate, but not classified as whole grains.
Few studies have reported on and compared plasma total AR concentrations in different populations. In an American cross-sectional study of 407 free-living older adults, the overall median concentration of AR was not mentioned, but the median fasting plasma AR concentrations were 5, 14, 27 and 62 nmol/l across the AR concentration quartiles( Reference Ma, Ross and Shea 31 ). This is similar to the total AR concentrations found in the plasma samples of participants from the Mediterranean region in the present study, indicating that the quantities of whole-grain wheat and rye consumed in the USA are similar to those consumed in the Mediterranean region. In one of the German subcohorts of the present study (EPIC-Potsdam), AR concentrations were measured in fasting plasma samples drawn 4 months apart in 100 participants. The geometric mean from both measurements was 49 nmol/l( Reference Montonen, Landberg and Kamal-Eldin 16 ). In the present study, fasting participants from EPIC-Potsdam (n 29) had a geometric mean AR concentration of 35 nmol/l (data not shown). In a previous study from EPIC-Denmark, AR concentrations were measured in plasma samples collected from 360 postmenopausal women who were non-fasting when the samples were drawn, and the median AR concentration was 78 nmol/l( Reference Landberg, Kamal-Eldin and Aman 13 ). We found lower median total AR concentrations of 52 nmol/l in postmenopausal Danish women (data not shown). The difference could be due to differences in fasting status in the previous study and the present study. Laboratory analyses of both the earlier studies were conducted in the same laboratory where those of the present study were carried out. Additionally, in a Danish intervention study of seventy-nine overweight or obese women, the baseline geometric mean plasma total AR concentration was 50 nmol/l( Reference Kristensen, Toubro and Jensen 26 ), and a recent Nordic intervention study has found baseline median fasting AR concentrations of 59 and 56 nmol/l for Swedes from Lund and Uppsala, respectively, and 67 nmol/l for Danes from Aarhus( Reference Magnusdottir, Landberg and Gunnarsdottir 32 ). The findings of the mentioned previous studies are overall similar to those of the present study. These findings indicate a potential of using fasting plasma AR concentrations to enable comparison between studies and populations. Information on whole-grain intake in Europe is scarce, and differences in the definitions of whole grains and variation in the products consumed complicate comparison of whole-grain intake. Therefore, AR might be a good complementary tool for the assessment of whole-grain intake.
Few studies have used the ratio between two of the AR homologues (C17 : 0 and C21 : 0) to indicate whether the whole-grain diet is dominated by whole-grain wheat or whole-grain rye. As expected, we found that the whole-grain diet of the Greek, Italian, Dutch and UK participants was dominated by wheat, as indicated by a low C17 : 0/C21 : 0 ratio, whereas the ratio was higher for the German, Danish and Swedish participants, indicating a higher whole-grain rye intake. These results are in line with those of a descriptive study on the intake of different whole-grain cereals in the Scandinavian part of the present study. In that study, it was found that rye intake constituted about 70 % of the whole-grain intake in Denmark, 55 % in Sweden and 20 % in Norway( Reference Kyro, Skeie and Dragsted 29 ). It is surprising that the C17 : 0/C21 : 0 ratio is higher among the Swedish participants than among the Danish participants in the present study (0·43 v. 0·37). Among the whole grains, wheat is primarily consumed in Norway, whereas rye is consumed in larger proportions in Sweden and Denmark( Reference Kyro, Skeie and Dragsted 29 ). As expected, the C17 : 0/C21 : 0 ratio was lower among the Norwegian participants (0·27). In the earlier mentioned Danish intervention study, a C17 : 0/C21 : 0 ratio of 0·13 was observed at baseline( Reference Kristensen, Toubro and Jensen 26 ), which is much lower than that found in the present study. According to the Danish national dietary surveys, the rye bread intake did not change between baseline of the present study and 2004( 33 ). The difference might be due to the participants included in the intervention study being overweight and obese( Reference Kristensen, Toubro and Jensen 26 ) and therefore having different dietary habits and lower rye bread intake. Previous observational studies conducted in Finnish, Swiss and Danish populations have reported C17 : 0/C21 : 0 ratios. In these studies, the C17 : 0/C21 : 0 ratio for Danes (EPIC-Denmark) was 0·40, for Finns 0·63, and for Swiss 0·17( Reference Ross 34 ). As the intake of rye is even higher in Finland than in Denmark, it is expected that the ratio would also be higher in Finland than in Denmark( Reference Nurmi, Mursu and Penalvo 35 ), and the results obtained for the Danish populations are similar to the findings of the present study. The results reported in the present study support the utility of the C17 : 0/C21 : 0 ratio for comparison of types of whole grains consumed in different populations.
In the present study, cereal fibre intake was found to be moderately or weakly correlated with plasma total AR concentrations. Overall, the correlations were higher in countries with a wide range of plasma total AR concentrations, i.e. Central Europe and Scandinavia, where the majority of the correlations were >0·25. The highest correlations were found in the UK general population, where the plasma total AR concentrations were also highest. The correlations are similar to what has been reported previously( Reference Magnusdottir, Landberg and Gunnarsdottir 32 , Reference Ross 34 ). In general, stronger correlations have previously been found between whole-grain wheat and rye intake and AR concentrations than between cereal fibre intake and AR concentrations. This is expected, because cereals other than wheat and rye as well as refined grains contribute to cereal fibre intake, but not to AR intake and plasma AR concentrations.
The present study demonstrates large variations in plasma AR concentrations in the ten countries included in the EPIC study, which seems to be largely due to differences in whole-grain wheat and rye intake between the countries. The plasma total AR concentrations were higher in Central Europe and Scandinavia and lower in the Mediterranean region. Using the AR C17 : 0/C21 : 0 ratio, it was found that the Danish, German and Swedish participants consumed rye in considerable amounts, whereas wheat was mostly consumed in the other seven European countries included in the study. We found modest/weak correlations with cereal fibre intake estimated from the FFQ.
Acknowledgements
The authors thank data managers Katja Boll, Nick Martinussen and Bertrand Hemon for assistance with data preparation and also Jytte Fogh Larsen for her administrative assistance. The authors also thank Ola Andersson and Janicka Nilsson for their excellent work on the laboratory analyses.
The present study was funded by Wereld Kanker Onderzoek Fonds (WCRF NL) grant no 2011/436, as part of the WCRF International grant programme and NordForsk (Centre of Excellence programme HELGA (070015)).
The coordination of EPIC is financially supported by the European Commission (DG-SANCO) and the International Agency for Research on Cancer. The national cohorts are supported by Danish Cancer Society (Denmark); Ligue Contre le Cancer, Institut Gustave Roussy, Mutuelle Générale de l'Education Nationale, Institut National de la Santé et de la Recherche Médicale (INSERM) (France); German Cancer Aid, German Cancer Research Center (DKFZ), Federal Ministry of Education and Research (Germany); the Hellenic Health Foundation (Greece); Associazione Italiana per la Ricerca sul Cancro-AIRC-Milan and National Research Council (Italy); Dutch Ministry of Public Health, Welfare and Sports (VWS), Netherlands Cancer Registry (NKR), LK Research Funds, Dutch Prevention Funds, Dutch ZON (Zorg Onderzoek Nederland), World Cancer Research Fund (WCRF), Statistics Netherlands (The Netherlands); ERC-2009-AdG 232997, the Norwegian Research Council, Extrastiftelsen Helse og Rehabiliering med Extra-midler (Norway); Health Research Fund (FIS), Regional Governments of Andalucía, Asturias, Basque Country, Murcia (no. 6236) and Navarra, ISCIII RETIC (RD06/0020) (Spain); Swedish Cancer Society, Swedish Scientific Council and Regional Government of Skåne and Västerbotten (Sweden); Cancer Research UK, Medical Research Council (UK).
The authors' contributions are as follows: C. K., A. O., H. B. B., R. L. and A. T. designed and conducted the research; C. K. coordinated and R. L. supervised the laboratory analyses; C. K. and J. C. analysed the data. All authors were involved in data interpretation and manuscript preparation.
The authors declare no conflicts of interest.


