


I is essential for the human body because it is required for thyroid hormone production. Owing to its importance in thyroid metabolism, adequate I is particularly critical for normal foetal and young child growth and development. Inadequate intake of I results in a spectrum of disorders, including goitre, impaired cognitive development and congenital abnormalities, generally referred to as I-deficiency disorders( Reference Delange 1 ).
The I content of food depends on the local soil content and animal feeding practices. Thus, I deficiency generally occurs in regions with low soil I content( Reference Rohner, Zimmermann and Jooste 2 ). In areas at risk of I deficiency, salt iodisation remains the key strategy to prevent and control I deficiency( 3 ). In the early 1990s, I deficiency was very common, and the UNICEF estimated that <20 % of households in low-income countries were using iodised salt, which increased to 70 % by 2000( 4 ). In countries at risk of I deficiency, where universal salt iodisation programmes do not achieve high coverage, other I supplementation strategies are recommended. In particular, the WHO and UNICEF recommend providing I supplements to pregnant and lactating women and I-fortified complementary foods to children aged 7–24 months when iodised salt coverage is <50 %( 5 ). In countries with coverage of 50–90 %, efforts should be made to improve universal salt iodisation, and targeted provision of supplementary I should be considered in the meantime.
The WHO, the International Council for the Control of Iodine Deficiency Disorders and UNICEF recommend an intake of 90 µg I/d for children<60 months of age( 3 ), whereas the US Institute of Medicine recommends 110–130 µg/d for children aged between 0 and 12 months and 90 µg/d for children between 1 and 8 years of age( 6 ). Home fortification products such as micronutrient powders (MNP) and small-quantity lipid-based nutrient supplements (SQ-LNS) are alternative vehicles for providing micronutrients including I to young children. Although the current MNP recommendations by WHO do not specify the amount of I in MNP( 7 ), the Home Fortification Technical Advisory Group recommends including 90 µg/d( 8 ). For the present study, SQ-LNS for young children was designed to provide 90 µg I/20 g (493 kJ (118 kcal)) daily portion, along with additional protein, essential fatty acids and other micronutrients( Reference Arimond, Zeilani and Jungjohann 9 ). Previous studies of MNP and SQ-LNS focused on the assessment of young children’s anaemia and iron status, and only a few studies investigated the impact on other micronutrients such as vitamins A and B12 and Zn status( Reference Salam, Macphail and Das 10 – Reference Siega-Riz, Estrada Del Campo and Kinlaw 13 ). To date, there is no information available on the impact of providing MNP or SQ-LNS on young children’s I status.
The primary objective of the present study was to assess the impact of supplementing local complementary foods with I-fortified SQ-LNS on the I status of young Burkinabe children exposed to iodised salt. In Burkina Faso, the addition of I to salt is mandatory since 2003. The regulations require an I content of 50–80 ppm at the time of importation and >30 ppm at retail distribution sites( 14 ). At the time when the present study was planned, available data from the 2003 National Demographic and Health Survey (DHS) indicated that only 34 % of households consumed iodised salt with >15 ppm I( 15 ).
There are suggestions that Zn is important for normal thyroid homoeostasis( Reference Hess 16 ). A secondary objective of the present study was to assess the impact of Zn intake on I status by comparing groups that received SQ-LNS containing either 10 mg Zn/d or no added Zn in a population considered to be at elevated risk for Zn deficiency.
Methods
Participants
The present study was part of the larger iLiNS-ZINC trial, which is described in more detail elsewhere( Reference Hess, Abbeddou and Yakes Jimenez 11 ). In brief, the study was designed as a partially masked, placebo-controlled, cluster-randomised intervention trial conducted from April 2010 to July 2012 in rural communities of the Dandé Health District in southwestern Burkina Faso. This study was conducted according to the guidelines laid down by the Declaration of Helsinki, and all the procedures involving human subjects were approved by the Institutional Review Boards of the Centre Muraz in Bobo-Dioulasso (Burkina Faso) and the University of California Davis (USA). All the participating guardians/caregivers provided their written informed consent. The study was registered as a clinical trial with the US National Institutes of Health (www.ClinicalTrials.gov; NCT00944281).
Children were examined for eligibility based on the following inclusion criteria: 8·8–9·9 months of age, permanent residence in the area and planned availability during the study period. Children were excluded based on the following criteria: Hb levels <50 g/l, weight-for-length<70 % of the median of the National Center for Health Statistics (NCHS)/WHO growth reference( 17 ), presence of bipedal oedema, other severe illnesses warranting hospital referral, congenital abnormalities potentially interfering with growth, chronic medical conditions requiring frequent medical attention, known HIV infection of infant or mother, history of allergy towards peanuts, history of anaphylaxis or serious allergic reaction to any substance requiring emergency medical care and concurrent participation in any other clinical trial.
Sample size
The sample size estimates for the I status assessments were based on the number of children required to detect an effect size of 0·6 (with a significance level of P<0·05 and power>0·80), which was considered to be of public health significance. The target sample size per intervention group for biochemical indicators of I status was n 55, which was increased to n 69 to include an assumed attrition rate of 20 %. Owing to the cluster sampling design, the estimated sample size for the non-intervention cohort (NIC) was increased to n 103 for an assumed design effect of 1·5 (including 20 % for attrition).
Salt samples were collected from a randomly selected subsample of participants. The sample size estimates were based on the number of household salt samples required for each type of intervention to detect (with a significance of P<0·05 and power>0·80) effect sizes that are consistent with the magnitude of differences observed in the salt analyses conducted in northern Côte d’Ivoire( Reference Hess, Zimmermann and Adou 18 ). Assuming that approximately 15–20 % of the caregivers would not provide a salt sample, the target sample size per cohort (intervention cohort (IC) v. NIC) was approximately 50.
Interventions
In total, thirty-four communities were stratified by a statistician at the University of California Davis using selected indicators (population size; proximity to road and Bobo-Dioulasso; and health clinic affiliation) and assigned within strata to participate in the IC (twenty-five communities) or NIC (nine communities). Within the IC, children were randomly assigned to one of four intervention groups, which received 20 g SQ-LNS daily containing different amounts of Zn from 9 to 18 months of age( Reference Hess, Abbeddou and Yakes Jimenez 11 ). For the present I impact study, only two intervention groups and the NIC participated in the I assessment: (1) SQ-LNS without Zn and placebo tablet (LNS-Zn0), (2) SQ-LNS with 10 mg Zn and placebo tablet (LNS-Zn10) and (3) NIC. For the purpose of the primary objective of the previously reported trial of the effects of different amounts of Zn in SQ-LNS v. dispersible Zn tablets( Reference Hess, Abbeddou and Yakes Jimenez 11 ), all the children in the intervention groups included in the present analyses also received a placebo tablet daily. Children in the intervention groups received free treatment for diarrhoea, malaria and fever, as described in more detail elsewhere( Reference Hess, Abbeddou and Yakes Jimenez 11 ). Children in the NIC did not receive SQ-LNS, tablets or any illness treatments during the study period.
The SQ-LNS products were developed and produced for the iLiNS project by Nutriset SAS and tested for acceptability before the trial( Reference Arimond, Zeilani and Jungjohann 9 , Reference Hess, Bado and Aaron 19 ). The caregivers were advised to feed the daily ration of 20 g with two separate meals. The placebo tablets were also produced by Nutriset SAS. Caregivers were advised to continue breast-feeding and to provide children with a variety of nutritious local foods.
Data collection
At enrolment, children’s age was confirmed from the health card, children’s length and weight were measured and family socio-economic data were recorded, as previously described( Reference Hess, Abbeddou and Yakes Jimenez 11 ). A capillary blood sample was collected for the assessment of Hb concentration (Hemocue 201+; HemoCue® AB) and to perform a rapid diagnostic test (RDT) for malaria parasites (SD BIOLINE Malaria Ag P.F/Pan; Standard Diagnostics Inc.). In case of anaemia (Hb<80 g/l) and uncomplicated illnesses at time of enrolment, all the children received free treatment according to national policy( Reference Hess, Abbeddou and Yakes Jimenez 11 ). At 9 and 18 months of age, the children’s dietary practices were assessed using non-quantitative food frequency questionnaires that elicited information on food groups consumed in the previous 24 h and in the previous 7 d( 20 ).
A subset of children (n 661) from LNS-Zn0, LNS-Zn10 and NIC were randomly selected for the biochemistry subgroup and were asked to provide venous blood and spot urine samples, as described below (Fig. 1). The biochemistry subgroup included a child if she or he was (1) the first in the concession (i.e. family compound) to be enroled in the study to avoid intra-cluster bias, (2) did not participate in any other substudy( Reference Abbeddou, Hess and Yakes Jimenez 21 , Reference Prado, Abbeddou and Yakes Jimenez 22 ) and (3) was free from fever and diarrhoea symptoms for the previous 48 h according to the caregiver. Children were assigned to the biochemistry subgroup progressively until the target sample size was reached. Household salt samples were collected from randomly selected households in this subgroup. In the IC 24 % (n 64 of 268) and in NIC 62 % (n 64 of 103) of all biochemical participants were assigned to the salt subgroup. Selected mothers were given a small plastic bag on the day of enrolment and were asked to return with a salt sample from their home on the day of blood and urine collection; 106 salt samples were successfully collected. Venous blood was collected in evacuated, trace element-free polyethylene tubes containing lithium heparin (Sarstedt AG & Co.), stored on ice and transported to the field laboratory, where dried blood spots (DBS) were collected on filter paper and then stored with desiccant in sealed bags. Plasma was separated from heparinised venous blood by centrifuging at 2800 rpm for 10 min. Plasma, DBS and urine samples were stored at −20°C until shipped on dry ice to the respective laboratories for analysis. Salt samples were stored in a dry room with controlled temperature until analysis.

Fig. 1 Flow diagram of clusters and participant progression through the I impact assessment of the iLiNS-ZINC trial. * Eligiblity was determined at the level of the child. † Not participating in the I impact assessment study. ‡ Invited if free of symptomatic fever or diarrhoea for 48 h before blood draw. § Number of children who successfully provided blood and/or urine samples at both time points (9 and 18 months).
Laboratory analyses
I status was assessed based on urinary iodine (UI), whole-blood thyroid-stimulating hormone (TSH) and total thyroxine (T4) and plasma thyroglobulin (Tg) concentrations. Total I content of salt samples was determined by iodometric titration at the Institut de Recherche en Sciences de la Santé in Bobo-Dioulasso( Reference Sullivan, Houston and Gorstein 23 ). UI was assessed at the Medical Research Council in Cape Town, South Africa, using a modification of the Sandell–Kolthoff reaction( Reference Jooste and Strydom 24 ). DBS were analysed for TSH and total T4 concentrations by an automated time-resolved fluoroimmunoassay (DELFIA neonatal TSH and T4 assays; PerkinElmer Life Sciences) at the Children’s Hospital in Zurich, Switzerland( Reference Torresani and Scherz 25 ). Tg was assessed in plasma using the Immulite 1000 Immunoassay system (Siemens) at the University of California Davis. Inadequate I status was defined as UI<100 µg/l( Reference Zimmermann, Jooste and Pandav 26 ). The manufacturer’s normal reference range for TSH was 0·1–3·7 mU/l and for T4 65–165 nmol/l. There is currently a recommended normal range for Tg assessed in DBS available for only school-age children (4–40 µg/l), but not for young children( 3 ). As there are no reference values available for young children, we also explored differences between intervention groups or cohorts at 18 months of age using standardised values and based on the upper and lower 2·5th percentile of the adjusted values for baseline values of the whole sample using general linear models. This study will report on data collected from the subgroup of children who successfully provided blood and/or urine samples both at 9 and 18 months of age for the analyses of I status.
Statistical analyses
Statistical analyses were carried out using SAS software for Windows (9.3; SAS Institute) using mixed models to account for the random effect of the community. Descriptive statistics (mean values and standard deviations, geometric means and 95 % CI and proportions) were used to assess baseline information by group and cohort, as well as to compare children included in the I add-on study with those not included. Length-for-age Z-score and weight-for-length Z-score were calculated using the SAS macros for the WHO Child Growth Standards( 27 ). Breast-feeding and 24 h-complementary feeding indicators were constructed according to WHO guidelines( 20 ). Any variables not normally distributed were transformed using Box–Cox transformations to identify the optimal transformation that leads to normality. Analyses were carried out using natural logarithmically transformed TSH and UI and with square root transformed Tg, which were back transformed for reporting descriptive results.
I status indicators (UI, T4, TSH and Tg) were compared by study group and cohort using mixed model ANCOVA for continuous outcome variables (SAS PROC MIXED procedure) and mixed models logistic regression for dichotomous variables (SAS PROC GLIMMIX procedure). Intervention group and cohort were used as the main effects, and covariates were tested individually in a binary model before including only the variables with P<0·1 in the final model. Intervention group means were compared post hoc using least-square means with the Tukey–Kramer test.
Results
Of the 3220 children enroled in the iLiNS-ZINC trial (Fig. 1), 661 were randomly assigned to the biochemical substudy, and 431 of those children were free of reported fever and diarrhoea 48 h before the blood collection day. In all, 66 % of those children provided a urine and/or blood sample both at baseline and at the end of the study. Mean age was 9·5 (sd 0·3) months and 25 % were stunted at enrolment (Table 1). There were no significant group-wise differences in baseline child characteristics and maternal education. Maternal age and BMI were significantly higher in the LNS-Zn10 group compared with mothers in the other two groups. Maternal and child characteristics also did not differ between the children who participated in the I study and the rest of the iLiNS-ZINC participants, who were not included in the I assessment, except for the prevalence of positive baseline RDT. Children in the I study had a higher prevalence of positive baseline RDT than those not included (68 v. 61 %; P=0·041).
Table 1 Baseline characteristics of children and their mothers of the two intervention groups and the non-intervention cohort (NIC) participating in I status assessments and compared with iLiNS-ZINC study participants not in the I status assessment (Mean values and standard deviations; numbers and percentages)

LAZ, length-for-age Z-score; LNS, lipid-based nutrient supplements; RDT, rapid diagnostic test; WLZ, weight-for-length Z-score.
a,b Values within a row with unlike superscript letters are significantly different (P<0·05).
* P values are from mixed model for continuous variables, Glimmix for binary variables and χ 2 for polychotomous variables. All the analyses were adjusted for the random effect of village.
† Child consumed at least one semi-solid or solid food item during the previous 24 h.
‡ Child received food from four or more food groups during the previous 24 h.
§ Child consumed at least one animal-source food during the previous 24 h.
Over the course of the trial, caregivers of participants in the IC reported very high adherence (98 (sd 2) %) to SQ-LNS. All the children were breast-fed at 9 months, and 96·7 % of children continued to be breast-fed at 18 months of age. In contrast, at 9 months of age, only 24·4 % consumed the minimum recommended number of meals on the previous day and 15·5 % met the minimum food group diversity recommended by the WHO( 20 ). Moreover, only 11·3 % consumed any kind of dairy product and 22·3 % consumed any animal-source food on the previous day. By 18 months of age, 60·0 % consumed the minimum number of meals, but only 27·4 % met the minimum food group diversity, 20·7 % consumed at least one dairy product and 37·0 % consumed at least one source of animal food during the previous 24 h.
The geometric mean UI concentration at baseline was 220 (95 % CI 192, 257) µg/l in children in the IC and 276 (95 % CI 192, 397) µg/l in children in the NIC (Table 2). Baseline UI concentrations did not differ between the children in the IC and NIC. For both cohorts combined, the mean UI was significantly higher at 18 months compared with 9 months of age (P<0·0001). Although the difference in UI between the IC and NIC at 18 months of age was NS, there was a significant interaction between intervention and age. In particular, UI was significantly higher at 18 months compared with 9 months of age only in the IC (P intervention×age=0·035). Only 14·8 % of participants had low UI concentration at baseline, which declined to 4·0 % at 18 months of age. A large proportion of children had high UI, with 18·8 and 32·3 % of children having UI>500 µg/l at 9 and 18 months, respectively, although there are no specific cut-offs for excessive UI levels available for this age group (Fig. 2). The baseline UI differed between the two SQ-LNS intervention groups (P=0·043), but this difference did not persist at 18 months of age.

Fig. 2 Distribution of urinary iodine (UI) concentration at 9 and 18 months of age.
Table 2 Urinary iodine (UI), thyroid-stimulating hormone (TSH), total thyroxine (T4) and thyroglobulin (Tg) concentrations in children at 9 and 18 months of age participating in the iLiNS-ZINC trial (Geometric means and 95 % confidence intervals; numbers and percentages)
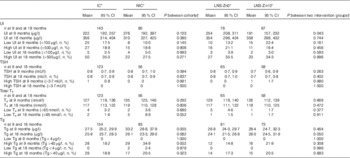
IC, intervention cohort; LNS, lipid-based nutrient supplements; NIC, non-intervention cohort; SQ-LNS, small-quantity lipid-based nutrient supplements.
* Communities were cluster randomised to IC and NIC. Within the IC, children were randomly assigned to receive 20 g LNS/d containing 90 µg I with 0 mg Zn (LNS-Zn0) or 10 mg Zn (LNS-Zn10) from 9–18 months, and NIC children received no SQ-LNS. All the children received iodised salt through the national salt iodization programme.
† Adjusting for cluster randomisation (village) and age during the visit and for baseline value additionally for analysis at 18 months of age.
The geometric mean of the TSH concentration was 0·8 (95 % CI 0·7, 0·9) mU/l both at baseline and at the end of the study. Only one child had an elevated TSH concentration at baseline, and all children had normal TSH concentrations at 18 months of age. Similarly, most children had normal T4 concentrations at 9 and 18 months of age. The prevalence of hypothyroxinaemia (low T4 concentration) was 3·4 % at baseline with no difference between the groups. The prevalence remained low at 18 months of age, but there was a marginally significant difference between the IC and the NIC (1·6 v. 8·9 %; P=0·052).
At baseline, the geometric mean of the Tg concentration was significantly higher in children in the NIC, 33·2 (95 % CI 28·8, 37·9) µg/l, compared with children in the IC, 27·5 (95 % CI 25·2, 29·9) µg/l (P=0·005). However, Tg concentrations were not significantly different between the cohorts or the intervention groups at 18 months of age after controlling for baseline values. There was also no significant difference in the prevalence of low or high Tg concentrations using the cut-offs for school-age children( 3 ), using standardised values and the upper and lower 2·5th percentiles of the adjusted baseline values of the whole sample. None of these comparisons found a significant difference in adjusted Tg by cohort. However, significantly more children (n 5; 6 %) in the NIC had adjusted Tg below the 2·5th percentile (<10·6 µg/l) compared with children in the IC (n 1; 0·6 %; P=0·006).
Salt samples (n 106) were successfully collected and analysed from randomly selected households. The mean I content of the salt samples was 37 ppm (ranging from 5 to 86 ppm). Only 5 % of the salt samples had an I content<15 ppm and 37 %<30 ppm.
Discussion
I deficiency was not prevalent in the study participants at 9 and 18 months of age, and the majority of households had access to adequately iodised salt. In all 63 % of the salt samples collected at the household level had an I content of >30 ppm, the level mandated in Burkina at retail distribution sites( 14 ), and 95 % had >15 ppm. These results are comparable with findings from the most recent 2010 DHS, which found that 96 % of Burkinabe households had access to salt-containing I>15 ppm( 28 ) and confirmed a significant increase in programmatic coverage, as only 34 % of salt samples were found to be iodised (>15 ppm) during the 2003 DHS( 15 ). The provision of 90 µg I/d in SQ-LNS did not affect UI, TSH, T4 or Tg concentrations at the end of the study, although children who received SQ-LNS had slightly lower prevalence of low T4 and low Tg concentrations compared with children from the NIC. Overall, the prevalence of hypothyroxinaemia was relatively low in both cohorts. Considering that the majority of children in both the IC and the NIC had adequate I status based on all four I status indicators, the salt iodisation programme seems to provide sufficient I to young children in the study area, either indirectly through the consumption of breast milk or directly through the consumption of salt-containing foods. To our knowledge, this was the first intervention trial investigating the impact of a home fortification product on young children’s I status.
TSH and T4 concentrations are homoeostatically controlled( 3 ), and thus we did not expect that the provision of the additional I would affect these biomarkers in already I-sufficient populations. However, we expected that the provision of additional I via SQ-LNS would have increased UI concentration. Possible explanations for the lack of the observed increase in UI are (1) less than reported adherence to SQ-LNS, (2) instability of I in SQ-LNS and/or (3) storage of excess I in the thyroid gland. The present study included a variety of methods to assess adherence( Reference Abbeddou, Hess and Yakes Jimenez 21 ). Although caregivers’ reports of adherence (97 (sd 6) %) and disappearance rate of returned empty packages (98 (sd 4) %) implied very high adherence in the present study, 12 h home observations during home visits found that only 59 % of the children were offered SQ-LNS during the hours of observation( Reference Abbeddou, Hess and Yakes Jimenez 21 ). Moreover, during interviews assessing knowledge, attitude and practices related to SQ-LNS at 15 months of age, half of the caregivers reported sharing of SQ-LNS during the previous week, mostly with other siblings. Thus, it is likely that the additional I intake from SQ-LNS was <90 µg/l, which would likely also be the case in any programme setting. Although adequate amounts of I in SQ-LNS were confirmed at the time of production, and products were tested for long-term stability, it cannot be ruled out that there was some loss of I from SQ-LNS over time due to oxidation. The I content of the thyroid gland is 0·1 mg at birth and increases to 8–15 mg by adulthood; therefore, it is also possible that some of the additionally provided I was taken up by the thyroid gland and stored rather than excreted.
Dietary I intake was not assessed in our study population. However, based on non-quantitative food frequency questionnaires, children’s diets were primarily based on cereal, with poor reported dietary diversity and intake of animal-source foods, including dairy, at 9 and 18 months of age( 20 ). Based on this presumed inadequate dietary intake, it can be assumed that the I intake from foods containing iodised salt was limited, particularly at 9 months of age. In contrast, considering that all the children were breast-fed at 9 months and almost all children continued to be breast-fed at 18 months of age, it is likely that most children benefitted from the salt iodisation programme indirectly via breast milk. The I content of breast milk varies widely and depends on the maternal I status( Reference Semba and Delange 29 ).
The tolerable upper intake level (UL), the highest average daily I intake that is likely not to pose adverse health risks, is set at 200 µg I/d for children aged between 1and 3 years( 6 , 30 ). Assuming a breast milk consumption of 620 and 550 g/d at 9 and 18 months, respectively( Reference Brown, Dewey and Allen 31 ), and a median breast milk I content of 146 µg/l as found in a study in the USA among women with adequate I intake( Reference Gushurst, Mueller and Green 32 ), the frequently breast-fed iLiNS-ZINC study participants consumed approximately 80–90 µg I/d through breast milk. Little is known about salt intake among young African children, but assuming a salt intake of 2 g/d( Reference Hess, Zimmermann and Staubli-Asobayire 33 ) and considering the median I content of salt of 37 ppm, I intake from salt would be approximately 74 µg/d. Thus, based on these estimates, children in this setting may already consume more than the UL even without considering the I provided in SQ-LNS. At present, no cut-off of UI has been established to identify young children with excessive I intakes and the normal range for Tg has not been determined for early childhood( 3 , Reference Zimmermann, Jooste and Pandav 26 ). All children in the study population had normal TSH concentrations and most had T4 concentrations within the normal range, implying normal thyroid function. This leads us to the conclusion that, although providing 90 µg additional I/d in SQ-LNS may have been more than necessary, it does not seem to have adversely affected thyroid metabolism at 18 months of age.
This is the first randomised clinical trial assessing the impact of providing Zn on I status. The addition of 10 mg Zn to a daily ration of SQ-LNS did not have an impact on any of the measured indicators of I status and thyroid metabolism. To date, the evidence of interactions between I and Zn metabolism is inconclusive and is mostly based on cross-sectional studies in humans( Reference Hess 16 ). One Zn-depletion study in six young men found that serum TSH, total T4 and free T4 concentrations tended to decrease during the period of low Zn intake (5·5 mg/d for 54 d), but only free T4 was significantly reduced( Reference Wada and King 34 ). It is possible that Zn deficiency was not severe enough in the study population to have affected thyroid metabolism. Zn deficiency was common and 35 and 54 % of children at 9 and 18 months, respectively, had low plasma Zn concentration (<650 µg/l)( Reference Hess, Abbeddou and Yakes Jimenez 11 ). However, the intervention also had no effect on plasma Zn concentration, possibly indicating inadequate adherence to the study supplements or poor Zn absorption.
Strengths of this study include the high participation rates and continuous training and rigorous supervision of field staff. In addition, I status was assessed using a variety of recommended biochemical indicators in urine and blood, the salt iodisation programme was assessed by titration of salt samples collected from participating families and multiple strategies were used to assess adherence to SQ-LNS( Reference Abbeddou, Hess and Yakes Jimenez 21 ). Thus, the present study provided a broad overview of I and thyroid status, as well as potential dietary sources of I. The target sample size was calculated based on an effect size of 0·6 and a three-group comparison (with a significance level of P<0·05 and power>0·80). However, considering the study objectives, we decided that two-group comparisons (IC v. NIC; LNS-Zn0 v. LNS-Zn10) would be more appropriate. Post hoc power calculations show that we were powered to detect an effect size of 0·54 and 0·55 for Tg and UI concentrations, respectively, and 0·67 for TSH and T4 concentrations for the comparison between the IC and the NIC. Thus, our sample was less adequate for comparing TSH and T4 concentrations than originally planned. However, as the mean concentrations of these indicators were so similar, it is unlikely that a larger sample size would have influenced our conclusions.
In conclusion, in settings with high coverage of universal salt iodisation and continued breast-feeding, a reduction in the I content added to home fortification products such as SQ-LNS should be considered. Before including I in home fortification products in countries with established salt iodisation programmes, salt samples should be tested at the household level for adequate I content, and ideally I status of the target population should be assessed. However, further assessments are needed in other countries, particularly in countries where the universal salt iodisation programme is less well established.
Acknowledgements
The authors thank the entire iLiNS-ZINC study staff. Special thanks go to Jérôme W. Somé, Zinéwindé P. Ouédraogo, Faustin Ye, Jean-Fidele Bationo and Lucien Bado (Institut de Recherche en Sciences de la Santé, Bobo-Dioulasso) for their support during data collection and salt analyses, Emmerentia Strydom (Medical Research Council, Cape Town, South Africa) for UI analyses, Janet Peerson (University of California Davis, USA) for assistance with the statistical analyses and the iLiNS Project Steering Committee (www.ilins.org) for technical support. Finally, the authors sincerely appreciate the support of the participating children and their parents, the local communities and the staff of the Health District of Dandé.
The project was funded by a grant from the Bill & Melinda Gates Foundation to the University of California, Davis (K. G. Dewey, grant no. 49817) and by Sight and Life (S. Y. H., grant no. 20010008). The findings and conclusions contained within are those of the authors and do not necessarily reflect positions or policies of the Bill & Melinda Gates Foundation or Sight and Life. The funder had no role in study design, data collection and analysis, decision to publish or preparation of the manuscript.
K. H. B., S. Y. H. and J. B. O. were responsible for the iLiNS-ZINC study design, S. Y. H. designed the I add-on study, S. A. and E. Y. J. implemented the research and S. Y. H., K. H. B., and J. B. O. supervised data collection. S. A. completed the statistical analyses and S. Y. H. drafted the manuscript. All authors read and approved the final version of the manuscript.
K. H. B. has worked as a consultant and later as an employee for the Bill & Melinda Gates Foundation. None of the other authors has any conflicts of interest to declare.


