


Vegetables are nutrient-dense plant-based foods that are an important part of healthy dietary patterns( Reference Medina-RemOn, Kirwan and Lamuela-Raventos 1 ). Vegetables can be rich sources of dietary fibre, plant protein, phytochemicals, vitamins and minerals, and these bioactive components may independently or jointly contribute to a lower risk of type 2 diabetes (T2D)( Reference Ley, Hamdy and Mohan 2 ). However, most( Reference Bazzano, Li and Joshipura 3 – Reference Kurotani, Nanri and Goto 11 ) prospective studies have been unable to detect a substantial association between total vegetable consumption and risk of T2D (with a few exceptions( Reference Cooper, Sharp and Lentjes 12 , Reference Villegas, Shu and Gao 13 )), and the lack of association was supported by several meta-analyses( Reference Cooper, Forouhi and Ye 4 , Reference Carter, Gray and Troughton 14 – Reference Schwingshackl, Hoffmann and Lampousi 18 ). The associations of individual groups of vegetables with T2D risk have been investigated in fewer studies and findings have been less consistent. Among the most frequently assessed vegetable groups, green leafy vegetables and cruciferous vegetables were associated with a lower T2D risk in several prospective studies( Reference Bazzano, Li and Joshipura 3 , Reference Cooper, Forouhi and Ye 4 , Reference Mamluk, O’Doherty and Orfanos 7 , Reference Montonen, Jarvinen and Heliovaara 9 , Reference Villegas, Shu and Gao 13 ) and meta-analyses( Reference Cooper, Forouhi and Ye 4 , Reference Carter, Gray and Troughton 14 – Reference Wang, Fang and Gao 16 , Reference Jia, Zhong and Song 19 ). A specific beneficial effect of green leafy vegetables, if any, may be partially explained by their high Mg content. Cumulative evidence has shown that Mg supplementation may improve glucose homoeostasis and that Mg intake is inversely associated with risk of T2D( Reference Dong, Xun and He 20 , Reference Veronese, Watutantrige-Fernando and Luchini 21 ). However, other studies observed no difference in risk( Reference Liu, Serdula and Janket 6 , Reference Kurotani, Nanri and Goto 11 ), or even a higher risk of T2D( Reference Mamluk, O’Doherty and Orfanos 7 ) associated with green leafy and/or cruciferous vegetable consumption.
To our knowledge, only two prospective studies have investigated vegetable consumption in relation to T2D risk in Asian population( Reference Kurotani, Nanri and Goto 11 , Reference Villegas, Shu and Gao 13 ). Total and several specific vegetables were inversely associated with T2D risk in Chinese women( Reference Villegas, Shu and Gao 13 ), but not in Japanese men and women( Reference Kurotani, Nanri and Goto 11 ). The inconsistency of findings for specific vegetables and the limited cohort data from Asian population highlight the need for additional studies. Thus, we used the Singapore Chinese Health Study (SCHS), a large population-based prospective study of ethnic Chinese men and women, to examine the associations between total and specific vegetables and risk of T2D. Furthermore, we also conducted an updated meta-analysis that incorporated results from the SCHS and cohort studies( Reference Mamluk, O’Doherty and Orfanos 7 ) that were published after previous meta-analyses( Reference Cooper, Forouhi and Ye 4 , Reference Carter, Gray and Troughton 14 – Reference Wang, Fang and Gao 16 , Reference Jia, Zhong and Song 19 ) to assess the overall evidence for a beneficial effect of green leafy and cruciferous vegetable consumption on risk of T2D.
Methods
Study population
The design of the SCHS has been described elsewhere( Reference Hankin, Stram and Arakawa 22 ). In brief, a total of 63 257 Chinese individuals (35 298 women and 27 959 men) aged 45–74 years were enrolled between 1993 and 1998. Participants belonged to one of the major dialect groups (Hokkien or Cantonese) of Chinese in Singapore, and were citizens or permanent residents of government-built housing estates where 86 % of the general population resided during the enrolment period. Using a structured questionnaire, in-person interviews were conducted at recruitment to collect subjects’ information on habitual diet, demographics, height and weight, tobacco use, physical activity, menstrual and reproductive history (women only) and medical history. The first and second follow-up interviews were conducted by telephone calls during 1999–2004 and 2006–2010, respectively. Informed consents were obtained from all enrolled participants. The study was approved by the Institutional Review Boards of the National University of Singapore and the University of Pittsburgh.
For the present analysis, we excluded individuals who: (1) had self-reported, physician-diagnosed diabetes (n 5696) or other chronic diseases such as cancer, heart disease or stroke at baseline (n 4108); (2) reported unrealistically high (>3700 kcal (>15480 kJ) for men; >3000 kcal (>12550 kJ) for women) or low (<700 kcal (<2930 kJ) for men;<600 kcal (<2510 kJ) for women) daily energy intake (402 men and 467 (<2510 kJ) women); and (3) did not respond to both follow-up interviews (n 7173). After these exclusions, 45 411 subjects remained for the present analysis, including 26 002 women and 19 409 men.
Dietary assessment
Baseline information on habitual dietary intake over the past year was collected using a 165-item, semi-quantitative FFQ that was administered by a trained interviewer( Reference Hankin, Stram and Arakawa 22 ). The FFQ contained twenty-four items that assessed intake of thirty-three types of fresh vegetables. For fresh vegetables and other food items, eight food-frequency categories (ranging from ‘never or hardly ever’ to ‘two or more times a day’) and three portion sizes (small, medium, large) with accompanying photographs were available for respondents to denote their habitual intake. The daily intake of each food item was derived by multiplying intake frequency with portion sizes. For non-alcoholic beverages such as coffee, soft drinks and fruit/vegetable juices, nine intake frequency options were available for each item, ranging from ‘never or hardly ever’ to ‘six or more times a day’, with the standard serving size assigned as one cup or glass. For total and specific vegetables, the daily quantity of intake was computed as the sum of the above-described fresh vegetables and vegetables mixed in distinct dishes (including rice, noodle and meat dishes, preserved foods, breads and crackers, snacks and dim sum, and fast food and sandwiches), as well as vegetable juices daily consumed, and expressed as g/d. In addition to total vegetable intake, vegetables were categorised as light green, dark green (all were leafy), yellow and cruciferous vegetables, potatoes and tomatoes (online Supplementary Table S1).
Daily nutrient and total energy intake were computed from the Singapore Food Composition Table that was developed in conjunction with the cohort( Reference Hankin, Stram and Arakawa 22 ). In our previous validation study of 810 randomly selected cohort participants that compared the FFQ against two 24-h diet recalls, the correlations ranged from 0·24 to 0·79 between the two different methods for dietary energy and nutrients( Reference Hankin, Stram and Arakawa 22 ). Correlation coefficients were not calculated for food groups such as vegetables. For several nutrients that were substantially contributed by dark green leafy vegetables (7·2 % of dietary fibre, 55·0 % of β-carotene, 16·9 % of vitamin C and 21·5 % of folate) and cruciferous vegetables (8·8 % of dietary fibre, 40·2 % of β-carotene, 19·4 % of vitamin C and 20·9 % of folate) in our study population, the correlation coefficients ranged from 0·65 to 0·72 for dietary fibre, 0·38 to 0·61 for β-carotene, 0·63 to 0·67 for vitamin C and 0·50 to 0·69 for folate, respectively, for the four dialect-sex groups.
Assessment of other covariates
Data on other covariates such as cigarette smoking, alcohol consumption, physical activity, education level, medical history (physician-diagnosed hypertension, diabetes, heart attack or angina and cancer) and height and weight were also collected using interview-administered questionnaires. Alcohol consumption was assessed by asking subjects their intake frequency of 4 types of commonly consumed alcohol (beer, rice wine, other wine and liquor) in this population, with specific serving sizes being assigned to each alcohol item. Physical activity was assessed by asking subjects the amount of time they spent per week on the following activities over the past year: (1) strenuous sports such as jogging, tennis or swimming; (2) vigorous work such as moving heavy furniture, loading or unloading trucks or shoveling; and (3) moderate activities such as brisk walking, tai chi or chi kung. BMI (kg/m2) was calculated as self-reported weight divided by the square of self-reported height.
Ascertainment of incident diabetes
Diabetes that occurred during follow-up was assessed through telephone interviews by the following question: ‘Have you been told by a doctor that you have diabetes (high blood sugar)?’ If yes: ‘Please also tell me the age at which you were first diagnosed?’ We counted as incident T2D those who reported physician-diagnosed diabetes at any time between the initial enrolment interview and the first (1999–2004) or second (2006–2010) follow-up telephone interviews.
The validation of the self-reported, physician-diagnosed diabetes in this study has been previously described( Reference Odegaard, Koh and Arakawa 23 , Reference Odegaard, Pereira and Koh 24 ). Among participants who reported physician-diagnosed diabetes at the follow-up I interview, 949 were confirmed to be valid cases by linking with a nationwide hospital-based discharge database. The remaining 1321 participants without diabetes-related hospitalisation records were contacted to answer a supplementary questionnaire about symptoms, diagnostic tests and hypoglycaemic therapy during a telephone interview. Of these 1321 participants, 702 (53 %) were available for further interview and agreed to be interviewed, of whom 682 (97 %) were confirmed by the supplementary questionnaire( Reference Odegaard, Pereira and Koh 24 ). Among participants who did not report a diagnosis of diabetes and provided blood samples at the follow-up I interview, 2625 were randomly selected and HbA1c was measured in their blood samples; 2477 (94 %) had an HbA1c<6·5 %( Reference Odegaard, Koh and Arakawa 23 ).
Statistical analysis
Person-years of follow-up time for each subject were calculated from the year of the baseline questionnaire until the year of reported initial diagnosis of diabetes or the date of the second follow-up interview, whichever came first. Total and specific vegetable intake were divided by total energy intake and expressed as g/2000 kcal (8370 kJ) because of the substantial correlation between vegetable and energy intake in this population (r 0·48)( Reference Willett, Howe and Kushi 25 ), and quintiles were created based on these energy-adjusted intake values.
Hazard ratios (HR) and 95 % CI of T2D risk were estimated by Cox proportional hazards model. Three models with different covariates were constructed to account for potential confounders. The first model was adjusted for age at baseline interview (years), year of baseline interview (1993–1995 or 1996–1998), sex, dialect group (Hokkien or Cantonese) and daily energy intake (kcal/d). The second model included the variables in model 1 and was additionally adjusted for moderate and vigorous physical activity (no moderate or vigorous/strenuous activity, <4 h/week moderate or <2 h/week vigorous/strenuous activity or ≥4 h/week moderate or ≥2 h/week vigorous/strenuous activity), the highest education level (no formal education, primary school or secondary school or higher), smoking (never smoker, former smoker, current smoker with 1–12 cigarettes/d or current smoker with ≥13 cigarettes/d), alcohol consumption (0, <5 or ≥5 g/d), soft drink consumption (glasses/week), coffee consumption (cups/d) and other food groups that may confound the association between vegetable consumption and T2D risk, including red meat, poultry, fish, nuts and seeds, soya products and whole grains (g/2000 kcal (8370 kJ))( Reference Schwingshackl, Hoffmann and Lampousi 18 , Reference Talaei, Wang and Yuan 26 , Reference Mueller, Odegaard and Gross 27 ). In the third model, analyses were further adjusted for BMI (kg/m2) and physician-diagnosed hypertension status (yes or no).
P values for linear trends were assessed by fitting median values of intake categories as a continuous variable. We also conducted stratified analyses and tested interactions of total and specific vegetable consumption by sex, BMI (<25·0 v. ≥25·0 kg/m2) and smoking status (never v. ever smokers). P values for interaction were calculated by including the median values of intake categories as continuous variables and a multiplicative term with sex, BMI or smoking status as a binary variable in the fully adjusted models. To account for potential bias due to undiagnosed diabetes or reverse causality, sensitivity analyses were performed by excluding T2D cases that were diagnosed during the first 4 years of follow-up. A further supplementary analysis was carried out by subtracting preserved vegetables from total vegetables.
Meta-analysis
We conducted an updated meta-analysis that incorporated results from the SCHS to quantify the prospective relationships between green leafy and cruciferous vegetable consumption and risk of T2D. We conducted a literature search on PubMed from inception to March 15, 2017 using the search terms ‘vegetable’ and ‘diabetes’ in combination with ‘cohort’ or ‘prospective’. The literature search was limited to publications that were published in English. Bibliographies in the retrieved full articles and recent meta-analyses( Reference Cooper, Forouhi and Ye 4 , Reference Carter, Gray and Troughton 14 – Reference Wu, Zhang and Jiang 17 , Reference Jia, Zhong and Song 19 ) were also hand-searched for additional studies. We also contacted relevant authors, if necessary, for additional information.
To be included, studies should have a prospective design, investigate the associations between green leafy and/or cruciferous vegetable intake and incidence of T2D and report corresponding HR, relative risks (RR) or OR and 95 % CI that were adjusted for potential confounders. In case of multiple publications from the same population, the one with the largest number of T2D cases was included. Our meta-analysis focused on intakes of green leafy and cruciferous vegetables in relation to T2D risk. In several prospective studies, only results for cabbage rather than total cruciferous vegetables were reported, and we used these results in a sensitivity analysis for cruciferous vegetable intake. On the basis of these criteria, we excluded six publications( Reference Brunner, Mosdol and Witte 28 – Reference Yu, Zhang and Xiang 33 ) for which vegetable intake was investigated in the whole dietary patterns, three publications( Reference Elwood, Galante and Pickering 34 – Reference Mandalazi, Drake and Wirfält 36 ) in which fruits and vegetables were combined in the analyses, two publications( Reference Malik, Li and Tobias 37 , Reference Weng, Lee and Yeh 38 ) that investigated vegetable protein/fibre intake and two publications in which only total vegetables were assessed( Reference Hodge, English and O’Dea 5 , Reference Meyer, Kushi and Jacobs 8 ). We further excluded two publications( Reference Cooper, Sharp and Lentjes 12 , Reference von Ruesten, Feller and Bergmann 39 ) that were from sub-cohorts of the European Prospective Investigation into Cancer and Nutrition (EPIC) study, because most of the T2D cases in the two sub-cohorts should have been included in another report of the EPIC-InterAct study( Reference Cooper, Forouhi and Ye 4 ). For the EPIC Elderly study that included participants who were from four European countries( Reference Mamluk, O’Doherty and Orfanos 7 ), we included the Greek sub-cohort that was not included in the EPIC-InterAct study.
We extracted information on various study and population characteristics and we assessed study quality using the nine-star Newcastle–Ottawa Scale( Reference Wells, Shea and O’Connell 40 ). We treated OR and HR reported in the primary studies as RR approximations because the incidence of T2D was sufficiently low for the rare disease assumption to apply. We used a random-effects model( Reference DerSimonian and Laird 41 ) to calculate summary risk estimates of T2D for the highest compared with the lowest categories of vegetable intake. To explore the potential sources of heterogeneity, we also conducted several subgroup and meta-regression analyses according to geographic area, sex, duration of follow-up, measure of association (HR/RR v. OR), average vegetable intake and whether adjustments for other dietary factors were made or not. Furthermore, we also conducted a dose–response analysis by use of the method proposed by Greenland & Longnecker( Reference Greenland and Longnecker 42 ) and Orsini et al.( Reference Orsini, Bellocco and Greenland 43 ). Accordingly, the average (mean or median) intake of vegetables, the number of cases and person-years and the risk estimates with their variance for at least three quantitative exposure categories were extracted. Vegetables were expressed as frequency (e.g. servings/d) or weight (e.g. g/d) of intake in the primary studies, and we converted the intake into g by using 80 g as a serving size for the studies that reported the intake in frequency( Reference Mamluk, O’Doherty and Orfanos 7 ). Results of the dose–response meta-analysis in the forest plot were presented for a 40-g/d increment, which approximates the average intake levels across different studies.
Heterogeneity among studies was assessed using the I 2 statistics( Reference Higgins and Thompson 44 ), with I 2<30 %, 30–75 % and >75 % indicating low, moderate and high heterogeneity, respectively. Potential publication bias was investigated with Egger’s asymmetry test and funnel plots( Reference Egger, Davey Smith and Schneider 45 ). All analyses were performed using STATA 14.0 (Stata Corp LP). All P values were two-sided, and the level of significance was at <0·05.
Results
Cohort analyses
Baseline characteristics of the study population by quintiles of energy-adjusted vegetable consumption are presented in Table 1. Higher vegetable consumption was associated with younger age, higher BMI, higher educational achievement, female sex, non-smoking and non-drinking, and lower consumption of coffee and soft drinks. Participants who had higher vegetable consumption were also more likely to be from the Cantonese dialect group, engage in moderate physical activity and have a history of hypertension at baseline.
Table 1 Baseline characteristics according to quintiles of energy-adjustedFootnote * vegetable intake in the Singapore Chinese Health Study (Mean values and standard deviations; percentages)
* Vegetable (and also other foods listed in the table) intake was divided by total energy intake and expressed as g/2000 kcal (1 kcal=4·184 kJ).
During 494 741 person-years of follow-up, 5207 cases of incident T2D were documented, of which 2195 were male and 3012 were female participants. With the basic adjustment for demographic variables and total energy intake, total vegetable consumption was associated with a non-significant trend towards a higher risk of T2D (model 1: top v. bottom HR=1·13; 95 % CI: 1·04, 1·24; P trend=0·07) (Table 2). Further adjusting for other lifestyle and dietary factors yielded a similar result (model 2: top v. bottom HR=1·13; 95 % CI 1·03, 1·24; P trend=0·10). Additional adjustment for BMI and hypertension further attenuated the association (model 3: HR=1·08; 95 % CI 0·98, 1·18; P trend=0·66) (Table 2).
Table 2 Type 2 diabetes by quintile of energy-adjusted* total and specific vegetable intake in the Singapore Chinese Health Study (Hazard ratios (HR) and 95 % confidence intervals)
* Vegetable intake was divided by total energy intake and expressed as g/2000 kcal (1 kcal=4·184 kJ).
† Tests for trends were assessed by fitting median values of intake for quintiles as continuous variables in statistical models.
‡ Model 1 includes age at baseline interview (years), sex, dialect group (Hokkien or Cantonese), year of baseline interview (1993–1995 or 1996–1998) and energy intake (kcal/d).
§ Model 2: model 1 plus physical activity (no moderate or vigorous,<4 h/week moderate or < 2 h/week vigorous,≥4 h/week moderate or≥2 h/week vigorous), education (no formal, primary school or secondary school or higher), smoking (never, former, current with 1–12 cigarettes/d or current with≥13 cigarettes/d), alcohol consumption (0, <5 or≥5 g/d), soft drink consumption (glasses/week), coffee consumption (cups/d) and energy-adjusted intakes (g/2000 kcal) of red meat, poultry, fish, nuts and seeds, soya products and whole grains.
|| Model 3: model 2 plus BMI (kg/m2) and history of hypertension (yes, no).
No substantial associations were observed between specific vegetable consumption and risk of T2D, including dark green leafy vegetables (model 3: top v. bottom quintile HR=1·05; 95 % CI 0·96, 1·15; P trend=0·21) and cruciferous vegetables (model 3: HR=0·97; 95 % CI 0·88, 1·06; P trend=0·29) (Table 2). Higher potato consumption was associated with a borderline significant lower risk of T2D after adjusting for the potential confounders in model 2 (HR=0·91; 95 % CI 0·84, 1·00; P trend=0·05), but the association lost significance after further adjusting for BMI and hypertension (P trend=0·24).
In stratified analyses, the lack of associations between total and specific vegetables and risk of T2D were largely consistent in the analyses by sex, BMI and smoking status (online Supplementary Table S2). In ever-smokers, light green vegetable intake was associated with a significant (P trend=0·04) and cruciferous vegetable intake was associated with a borderline significant (P trend=0·05) lower risk of T2D, but no significant interaction with smoking status was observed (P interaction=0·11 and 0·22, respectively). There was a suggestion that the association with preserved vegetable differed by sex (P interaction=0·01), with a marginally significant, direct association in men (model 3: top v. bottom quintile HR=1·12; 95 % CI 0·98, 1·29; P trend=0·05), but not in women (HR=0·89; 95 % CI 0·79, 1·00; P trend=0·21) (online Supplementary Table S2).
When light green and dark green leafy vegetables were combined as total green vegetables, the lack of association remained (model 3: top v. bottom quintile HR=1·03; 95 % CI 0·94, 1·13; P trend=0·22). Excluding T2D cases that occurred during the first 4 years of follow-up did not substantially change the associations between consumption of total vegetables or any of the specific vegetable groups and risk of T2D (data not shown). Subtracting preserved vegetables from total vegetables did not appreciably alter the results (data not shown).
Meta-analysis
Results of the literature search and selection of studies for the meta-analysis are provided in detail in Fig. 1. Eleven prospective studies, including the SCHS and others from nine publications( Reference Bazzano, Li and Joshipura 3 , Reference Cooper, Forouhi and Ye 4 , Reference Liu, Serdula and Janket 6 , Reference Mamluk, O’Doherty and Orfanos 7 , Reference Montonen, Jarvinen and Heliovaara 9 – Reference Kurotani, Nanri and Goto 11 , Reference Villegas, Shu and Gao 13 , Reference Lacoppidan, Kyro and Loft 46 ) (two cohorts were reported in one publication( Reference Mamluk, O’Doherty and Orfanos 7 ) and one cohort( Reference Lacoppidan, Kyro and Loft 46 ) on cabbage intake was included in our sensitivity analysis), were included in the meta-analysis, involving 754 729 participants and 58 297 incident T2D cases. The studies were largely conducted in the USA or Europe, in addition to three studies that were from China( Reference Villegas, Shu and Gao 13 ), Japan( Reference Kurotani, Nanri and Goto 11 ) or Singapore (the SCHS), respectively. The duration of follow-up ranged from 4·6 to 23 years. Consumption of vegetables was mostly assessed using FFQ by self-reports or interviews, with the only exception of one cohort( Reference Mursu, Virtanen and Tuomainen 10 ) where diet records were used. Characteristics of the studies are presented in Table 3. Types of individual vegetables that contributed to green leafy or cruciferous vegetables differed substantially across studies (online Supplementary Table S3). The online Supplemental Table S4 presents details of quality assessment for the included studies according to the nine-star Newcastle–Ottawa Scale.
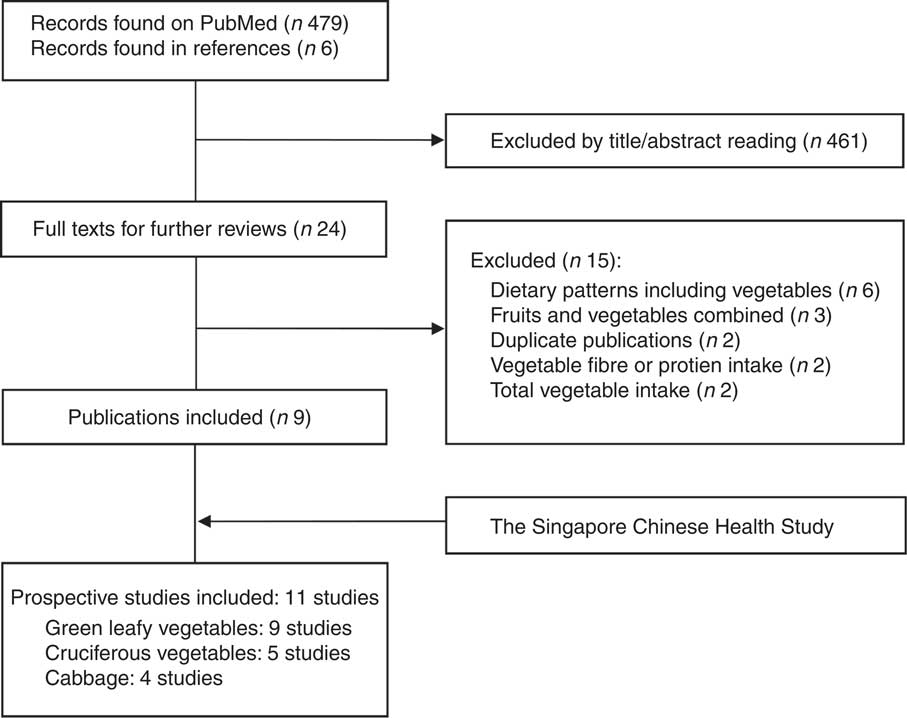
Fig. 1 Literature search and selection of studies for the meta-analysis.
Table 3 Characteristics of prospective studies on green leafy vegetable and cruciferous vegetable intake and risk of type 2 diabetes
WHS, Women’s Health Study; W, women; serv, servings; veg, vegetables; RR, relative risk; M, men; FMCHES, Finnish Mobile Clinic Health Examination Survey; SWHS, Shanghai Women’s Health Study; HR, hazard ratio; WHR, waist:hip ratio; NHS, Nurses’ Health Study; EPIC, European Prospective Investigation into Cancer and Nutrition; NR, not reported; JPHC, Japan Public Health Center-based Prospective Study; KIHDRFS, Kuopio Ischaemic Heart Disease Risk Factor Study; FPG, fasting plasma glucose; OGTT, oral glucose tolerance test; WC, waist circumference; DCH, Diet, Cancer and Health; AARP, American Association of Retired Persons.
The summary RR for the highest compared with lowest intake of green leafy vegetables was 0·91 (95 % CI 0·84, 1·00) based on nine studies (50 499 cases and 697 337 participants), and there was moderate-to-high heterogeneity among studies (I 2=72·3 %) (Fig. 2). The corresponding RR for cruciferous vegetable intake was 0·87 (95 % CI 0·76, 1·00, I 2=63·8 %) based on five studies (9757 cases and 198 389 participants) (Fig. 2). There was a suggestion of funnel plot asymmetry for studies of green leafy vegetables (online Supplementary Fig. S1), but this was based on a small number of studies and the Egger test did not provide evidence for publication bias (P=0·57 for green leafy vegetables and P=0·56 for cruciferous vegetables).
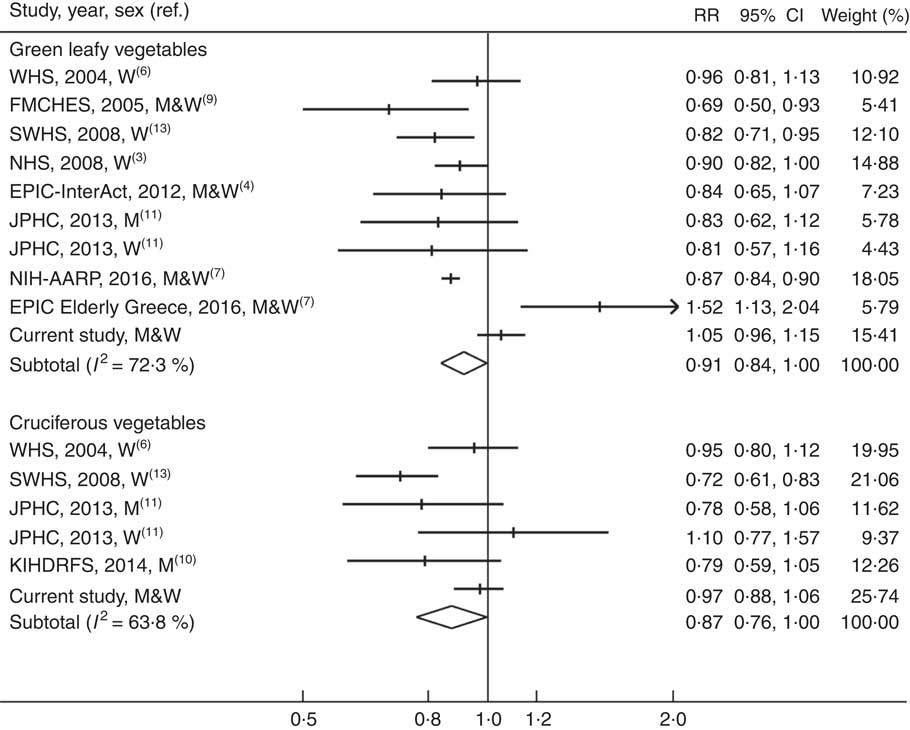
Fig. 2 Meta-analysis of green leafy vegetable and cruciferous vegetable intake (high v. low) and risk of type 2 diabetes. WHS, Women’s Health Study; W, women; FMCHES, Finnish Mobile Clinic Health Examination Survey; M, men; SWHS, Shanghai Women’s Health Study; NHS, Nurses’ Health Study; EPIC, European Prospective Investigation into Cancer and Nutrition; JPHC, Japan Public Health Center-based Prospective Study; AARP, American Association of Retired Persons; KIHDRFS, Kuopio Ischaemic Heart Disease Risk Factor Study.
In the stratified and meta-regression analyses (online Supplementary Table S5), none of the predefined factors was found to be a significant contributor to the heterogeneity (P difference≥0·12). The summary RR for cabbage intake and T2D risk based on four studies (three publications( Reference Cooper, Forouhi and Ye 4 , Reference Mamluk, O’Doherty and Orfanos 7 , Reference Lacoppidan, Kyro and Loft 46 )) was 0·98 (95 % CI 0·92, 1·04, I 2=35·9 %). When combining studies on cruciferous vegetables and cabbage in a sensitivity analysis, the summary RR of T2D was 0·93 (95 % CI 0·87, 1·00, I 2=57·3 %). Results of meta-analysis were similar when the estimate for dark green leafy vegetables in the SCHS was replaced with the one for total green vegetables (data not shown).
One study( Reference Mursu, Virtanen and Tuomainen 10 ) on cruciferous vegetables was not eligible for the dose–response analysis because the intake levels were not available across quartile of cruciferous vegetables. A dose–response meta-analysis of the remaining studies yielded a summary RR of 0·97 (95 % CI 0·94, 1·00, I 2=70·8 %) for a 40-g/d increment in green leafy vegetable intake and 0·93 (95 % CI 0·85, 1·03, I 2=78·5 %) for the same increment in cruciferous vegetable intake (online Supplementary Fig. S2).
Discussion
In a large, population-based, prospective study of ethnic Chinese men and women, we found no substantial associations between total vegetable intake or intake of specific vegetable groups, including green leafy and cruciferous vegetables, and risk of T2D. In a meta-analysis including results from published studies and the SCHS with up to 58 000 incident cases, high green leafy and cruciferous vegetable intake was associated with a 9 and 13 % lower risk of T2D, respectively, but both associations were only borderline significant with moderate-to-high heterogeneity across studies.
Our cohort finding of a lack of association between total vegetable intake and T2D risk agrees with results from most previous cohort studies( Reference Bazzano, Li and Joshipura 3 – Reference Kurotani, Nanri and Goto 11 ) and meta-analyses( Reference Cooper, Forouhi and Ye 4 , Reference Carter, Gray and Troughton 14 – Reference Schwingshackl, Hoffmann and Lampousi 18 ), with the only exception being the Shanghai Women’s Health Study (SWHS)( Reference Villegas, Shu and Gao 13 ), for which a significant inverse association was reported. Higher green leafy vegetable intake was significantly associated with 10–31 % lower risk of T2D in a Finnish cohort( Reference Montonen, Jarvinen and Heliovaara 9 ), the Chinese SWHS( Reference Villegas, Shu and Gao 13 ), the US Nurses’ Health Study (NHS)( Reference Bazzano, Li and Joshipura 3 ) and the NIH-American Association of Retired Persons Diet and Health Study( Reference Mamluk, O’Doherty and Orfanos 7 ). However, findings from other studies suggested no association( Reference Liu, Serdula and Janket 6 ) or even a direct association with risk of T2D( Reference Mamluk, O’Doherty and Orfanos 7 ) for green leafy vegetables. Only the SWHS( Reference Villegas, Shu and Gao 13 ) found a significant inverse association between cruciferous vegetable intake and T2D risk. The differences between our results and those of studies that showed inverse associations may be owing to several reasons. Previous studies recruited subjects who participated in health examinations( Reference Montonen, Jarvinen and Heliovaara 9 ), pre-dominantly non-smoking women( Reference Villegas, Shu and Gao 13 ), nurses( Reference Bazzano, Li and Joshipura 3 ) or retired persons in the USA( Reference Mamluk, O’Doherty and Orfanos 7 ). These participants may have been more health conscious than our study population, and their vegetable intake may therefore have been correlated more strongly with other lifestyle factors that are protective for T2D. Although several previous studies statistically adjusted for other lifestyle risk factors, only our cohort and the NHS( Reference Bazzano, Li and Joshipura 3 ) accounted for a wide range of dietary confounders. Furthermore, individual vegetables that contributed to specific vegetable groups varied substantially across different studies (online Supplementary Table S3). In the SCHS, green leafy and cruciferous vegetables comprised a variety of individual vegetables, and subjects who had higher intake of total green leafy or cruciferous vegetables may not necessarily have higher intake of individual vegetables that are specifically beneficial for T2D. In addition, although the Egger test did not support publication bias, the funnel plots appeared asymmetric in the meta-analyses of green leafy vegetable intake, suggesting that the possibility of publication bias cannot be excluded.
Previous meta-analyses by Li et al. ( Reference Li, Fan and Zhang 15 ) and Wang et al. ( Reference Wang, Fang and Gao 16 ) each included six cohort studies and suggested a 13 % (RR=0·87; 95 % CI 0·81, 0·93) lower risk of T2D associated with higher green leafy vegetable consumption. Another meta-analysis by Jia et al. ( Reference Jia, Zhong and Song 19 ) included four cohorts and suggested a 16 % (RR=0·84; 95 % CI 0·73, 0·96) lower risk of T2D-associated higher consumption of cruciferous vegetables. Our updated meta-analysis showed slightly weaker associations that were only borderline significant. Moreover, the substantial heterogeneity in results across studies in our meta-analysis indicates that findings for green leafy or cruciferous vegetable consumption on T2D risk have been inconsistent. Although our meta-analyses estimates do not exclude the possibility of moderate benefits of green leafy and cruciferous vegetable consumption and T2D risk, the current evidence for such benefits is not convincing.
Our cohort findings showed suggestive inverse associations for light green and cruciferous vegetable intake in ever-smokers, and significant interaction by sex for preserved vegetable intake. A marginally significant inverse association that was limited to male (but not female) smokers was also observed for cruciferous vegetables in a Japanese cohort( Reference Kurotani, Nanri and Goto 11 ). Although effect modification of effects of vegetables by smoking or sex hormones cannot be fully ruled out, these observations most likely reflect residual lifestyle confounders that are associated with both smoking dosage or sex and T2D, or chance findings owing to multiple stratified analyses performed.
We found no association between tomato, potato or yellow vegetable intake and risk of T2D after the full adjustment for potential confounders. Among a few studies( Reference Liu, Serdula and Janket 6 , Reference Montonen, Jarvinen and Heliovaara 9 , Reference Villegas, Shu and Gao 13 ) that investigated tomato or yellow vegetable intake in relation to risk of T2D, significant inverse associations with both yellow vegetable and tomato intake were observed in the Chinese SWHS, and no associations with yellow vegetable intake in other studies( Reference Liu, Serdula and Janket 6 , Reference Montonen, Jarvinen and Heliovaara 9 ). Previous results on potato intake and T2D risk have been heterogeneous, ranging from a significant inverse association in the SWHS( Reference Villegas, Liu and Gao 47 ) to no association( Reference Hodge, English and O’Dea 5 , Reference Liu, Serdula and Janket 6 , Reference von Ruesten, Feller and Bergmann 39 ) or direct associations( Reference Montonen, Jarvinen and Heliovaara 9 , Reference Muraki, Rimm and Willett 48 ) in USA or European studies. In general, potatoes are more likely to be consumed as French fries and eaten in greater amounts in Western populations than in Asians, which may explain these divergent observations. In a report of the three US cohorts( Reference Muraki, Rimm and Willett 48 ), the higher T2D risk related to total potato intake was largely driven by the intake of French fries.
In contrast with the lack of association we observed between vegetable consumption and risk of T2D, our previous findings in the SCHS suggested a significant inverse association between a dietary pattern characterised by higher intake of vegetables, fruits and soya foods and T2D risk( Reference Odegaard, Koh and Butler 49 ). The potential benefit of this dietary pattern may be explained by higher intake of other plant foods such as unsweetened soya( Reference Mueller, Odegaard and Gross 27 ) and certain fruits (e.g. apples and grapes)( Reference Alperet, Butler and Koh 50 ) that were inversely associated with T2D risk and/or lower intake of red meat( Reference Talaei, Wang and Yuan 26 ) that was directly associated with T2D in our study population.
Strengths of our study included the large sample size, population-based and prospective nature and the broad ranges of the intake of total and specific vegetable groups among cohort participants. Baseline diets were assessed with a semi-quantitative FFQ and only the derived dietary energy and various nutrients, but not vegetables or other whole foods, have been validated. Misclassification of vegetable intakes would likely be non-differential in cohort studies and attenuate a true association towards null. Despite the use of different statistical models and the careful adjustments for various potential confounders, we cannot exclude that residual confounding may have affected our results. Incident diabetes was identified according to participants’ self-reports. However, validation studies in our study population indicated that diabetes was accurately reported. Our results may be most generalisable to East Asian populations, and should be confirmed for other ethnic groups.
In this prospective study of ethnic Chinese men and women, total or specific vegetable consumption including consumption of green leafy and cruciferous vegetables was not substantially associated with risk of T2D. In contrast, vegetable consumption was associated with a lower risk of ischaemic heart disease in our cohort( Reference Rebello, Koh and Chen 51 ) and other cohorts( Reference Aune, Giovannucci and Boffetta 52 ). Although vegetables are an important part of healthy diets, higher vegetable consumption may not confer the same benefits for T2D risk as have been observed for CVD.
Acknowledgements
G.-C. C. received an award from the China Scholarship Council. The authors thank Nithya Neelakantan of the National University of Singapore for carefully checking the statistical analyses and reviewing the whole manuscript. The authors express the gratitude to Siew-Hong Low of the National University of Singapore for overseeing the fieldwork of the Singapore Chinese Health Study and Renwei Wang for the development and maintenance of the cohort-study database. Finally, the authors recognise Mimi C. Yu as the founding principal investigator of the Singapore Chinese Health Study.
This study was supported by the National Institutes of Health, USA (NIH R01 CA144034 and UM1 CA182876). W.-P. K. is supported by the National Medical Research Council, Singapore (NMRC/CSA/0055/2013).
Authors’ contributions are as follows: G.-C. C. and R. M. v. D. designed the research and developed the analytical plan; G.-C. C. performed the statistical analyses and had primary responsibility for writing the manuscript; W.-P. K., J.-M. Y. and R. M. v. D. directed the study. W.-P. K., J.-M. Y., L.-Q. Q. and R. M. v. D. critically reviewed the manuscript. All authors interpreted the findings, edited the manuscript and approved the final manuscript.
The authors declare that there are no conflicts of interest.
Supplementary material
For supplementary material/s referred to in this article, please visit https://doi.org/10.1017/S0007114518000119


