


1. Introduction
It has been proposed that the evolution of plant morphology often involves changes in genes coding for transcriptional regulators (Doebley & Lukens, Reference Doebley and Lukens1998; Cronk, Reference Cronk2001). Several studies have provided examples where changes in the expression or function of transcription factors can give rise to morphological differences in plant architectures, leaf morphology, inflorescence structure and floral configuration (Doebley et al., Reference Doebley, Stec and Hubbard1997; Hellmann et al., Reference Hellmann, Ebersberger, Ptak, Paabo and Przeworski2003; Kim et al., Reference Kim, McCormick, Timmermans and Sinha2003; Wang et al., Reference Wang, Nussbaum-Wagler, Li, Zhao, Vigouroux, Faller, Bomblies, Lukens and Doebley2005).
The MIKC-type (Type II) MADS-box genes encode transcription factors that are key regulators of plant vegetative and reproductive development (Riechmann & Meyerowitz, Reference Riechmann and Meyerowitz1997a; Riechmann & Meyerowitz, Reference Riechmann and Meyerowitz1997b; Theissen & Saedler, Reference Theissen and Saedler1999; Theissen et al., Reference Theissen, Becker, Di Rosa, Kanno, Kim, Münster, Winter and Saedler2000; Ng & Yanofsky, Reference Ng and Yanofsky2001; Theissen, Reference Theissen2001). Type II MADS-box proteins possess four functional domains, the M (DNA-binding), K (keratin-like), I (intervening) and C (C-terminal) domain. The M domain usually contains ~58 amino acids and is the most conserved region of the MADS protein sequence (Riechmann & Meyerowitz, Reference Riechmann and Meyerowitz1997b). The K and I domains are involved in protein–protein dimerization and interaction (Sieburth et al., Reference Sieburth, Running and Meyerowitz1995; Fan et al., Reference Fan, Hu, Tudor and Ma1997; Egea-Cortines et al., Reference Egea-Cortines, Saedler and Sommer1999). The less conserved C domain is responsible for transactivation, formation of multimeric protein complexes and specificity of protein function (Honma & Goto, Reference Honma and Goto2001; Immink et al., Reference Immink, Ferrario, Busscher-Lange, Kooiker, Busscher and Angenent2003). Alterations in the C domain were shown to contribute to diversification and neo-functionalization during floral MADS-box gene evolution (Vandenbussche et al., Reference Vandenbussche, Theissen, Van de Peer and Gerats2003).
Molecular evolution studies showed that the duplication and functional diversification of the MADS-box genes are correlated with the origin of land plants, the establishment of certain floral structures in higher plants and the increasingly diverse and complex flower structures in land plants (Theissen et al., Reference Theissen, Kim and Saedler1996; Purugganan, Reference Purugganan1997; Saedler et al., Reference Saedler, Becker, Winter, Kirchner and Theissen2001; Litt & Irish, Reference Litt and Irish2003; He et al., Reference He, Münster and Saedler2004; Kaufmann et al., Reference Kaufmann, Melzer and Theissen2005). Since MADS-box genes were critically relevant to the long-term evolution of plant form, the genetic modification at these genes could also provide a source of diversity to be utilized for creating intraspecific morphological variation. However, a few investigations have looked at the evolution pattern of within-species sequence variation at MADS-box genes. A limited number of studies include examinations of CAL, AP3, PI, SEP1-2 and SHP1-2 genes in Arabidopsis and Brassica (Purugganan & Suddith, Reference Purugganan and Suddith1998, Reference Purugganan and Suddith1999; Purugganan et al., Reference Purugganan, Boyles and Suddith2000; Moore et al., Reference Moore, Grant and Purugganan2005). Positive selection was detected in the pattern of sequence variation at the CAL gene of the domesticated subspecies of Brassica oleracea and was used as evidence to suggest that specific CAL alleles were selected by early farmers to modify inflorescence structure in B. oleracea (Purugganan et al., Reference Purugganan, Boyles and Suddith2000).
Maize (Zea mays ssp. mays) domestication and improvement processes provide a good system to examine the contribution of MADS-box genes to morphological evolution (Eyre-Walker et al., Reference Eyre-Walker, Gaut, Hilton, Feldman and Gaut1998; Vigouroux et al., Reference Vigouroux, McMullen, Hittinger, Houchins, Schulz, Kresovich, Matsuoka and Doebley2002; Wright & Gaut, Reference Wright and Gaut2005). The maize gene pool is composed of three components: maize inbreds, maize landraces and teosintes, including Z. mays ssp. parviglumis, the direct progenitor of maize. Starting with teosinte, native people of the New World constantly selected certain traits to meet different cultural and agricultural needs, and thus produced domesticated maize and diversified this crop into many landraces (Pressoir & Berthaud, Reference Pressoir and Berthaud2004). More recently, multiple maize inbred lines important for breeding have been created by selection on landrace populations.
The purpose of this study was to examine the MADS-box genes for their involvement in maize domestication and improvement. We compared the pattern of genetic polymorphism of 32 MADS-box genes to that in loci randomly chosen from the maize genome. The possibility of MADS-box and control genes being putative targets of selection was evaluated by neutrality tests and a test based on a bottleneck model of domestication.
2. Materials and methods
(i) Plant materials and sequence data
Our sample of 32 MADS-box genes included 30 previously described genes (Theissen et al., Reference Theissen, Kim and Saedler1996; Münster et al., Reference Münster, Deleu, Wingen, Ouzunova, Cacharron, Faigl, Werth, Kim, Saedler and Theissen2002; Vigouroux et al., Reference Vigouroux, McMullen, Hittinger, Houchins, Schulz, Kresovich, Matsuoka and Doebley2002) (Fig. 1). Additional MADS-box genes were found by querying the Entrez and the Maize Assembled Genomic Island (MAGI, version of April 2004) translated nucleotide databases using TBLASTN (http://www.ncbi.nlm.nih.gov/BLAST). This strategy identified two unique type-II MADS-box genes, AY109828 and CA483635.
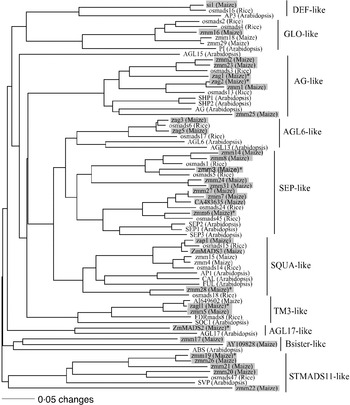
Fig. 1. The phylogenetic relationship of maize MADS-box genes with homologous genes in rice and Arabidopsis. The tree was constructed using amino acid sequences of the MIK domains and the neighbour-joining (NJ) method with the distance option of mean character difference in the PAUP* 4·0b10 (Swofford, Reference Swofford2003). Subfamilies were named according to Münster et al. (Reference Münster, Deleu, Wingen, Ouzunova, Cacharron, Faigl, Werth, Kim, Saedler and Theissen2002). Genes shaded with boxes are the maize MADS-box genes surveyed in this study. The eight MADS-box genes that our analysis implicated as being under selection during domestication are indicated with an asterisk.
DNA sequences were obtained for the 32 MADS-box genes by PCR amplifying and sequencing a 300 to 1500 bp DNA fragment in a common set of 28 different maize inbred lines, 16 maize landraces and 21 teosinte accessions (Supplementary Table 1). In MADS-box genes with strong evidence of selection, multiple amplicons within the gene were tested in order to determine the extent of selection but were not included in analyses comparing the original MADS-box-sequenced amplicons to those from the control genes. The 28 maize inbreds represent much of the genetic diversity among important public lines currently available for breeding (Liu et al., Reference Liu, Goodman, Muse, Smith, Buckler and Doebley2003). The 16 maize landraces represent the genetic diversity present in maize before modern breeding efforts (Tenaillon et al., Reference Tenaillon, Sawkins, Long, Gaut, Doebley and Gaut2001). Sixteen of the 21 different teosintes were chosen on the basis of geographic criteria and cover the entire natural distribution of Z. mays ssp. parviglumis. Single alleles for each specific gene were isolated from Tripsacum, a sister genus of Zea, or Zea diploperennis, when a Tripsacum sequence was not obtainable (Supplementary Table 1). Sampled fragments mainly encode I, K and C domains of the MADS proteins. Previously generated DNA sequences of zagl1 in maize landraces and the outgroup were also used for analysis (Vigouroux et al., Reference Vigouroux, McMullen, Hittinger, Houchins, Schulz, Kresovich, Matsuoka and Doebley2002).
Thirty-two randomly chosen genes served as controls for comparison to the MADS-box genes. These genes represent a subset of 774, loci which had previously been sequenced in maize inbreds and teosinte individuals (Wright et al., Reference Wright, Bi, Schroeder, Yamasaki, Doebley, McMullen and Gaut2005). From the 774 loci, we randomly chose a subset of 32 loci that were ⩾500 bp in sequence length and had been successfully sequenced in at least eight maize inbreds and at least eight teosintes. We subsequently sequenced these 32 genes in 16 maize landraces and an outgroup. A smaller set of teosintes (16 accessions of Z. mays ssp. parviglumis) and maize inbreds (14 lines) were sampled for the 32 control genes in comparison with the MADS-box genes. In order to eliminate false-positive results due to sampling differences, we only included sequence data from 16 Z. mays ssp. parviglumis individuals and 14 maize inbred lines when comparing the nucleotide polymorphism data from the MADS-box and control genes.
For maize landraces, maize inbreds and the teosinte individuals, we were able to directly sequence PCR products using a standard protocol (Applied Biosystems, Foster City, CA) from homozygous or haploid DNA sources. Our DNA sources for Z. diploperennis and Tripsacum DNAs are potentially heterozygous, and thus PCR products from these sources were cloned into the TOPO-TA vector (pCR 2.1-TOPO kit, Invitrogen, Carlsbad, CA) and multiple clones were sequenced to identify a single allele and correct Taq errors introduced during PCR. The forward and reverse DNA sequences were assembled for each individual using the Sequencher software (Gene Codes, Ann Arbor, MI). Individual sequences from the maize inbreds, maize landraces, teosinte and an outgroup were then manually aligned using SE-Al version 2.0 a11 (Rambaut, Reference Rambaut1996). Unique single-base-pair variants (singletons) were double checked by manually inspecting the corresponding raw chromatogram peaks.
(ii) Tests for neutrality
Molecular population genetic statistics were generated using DnaSP Version 4.0 (Rozas et al., Reference Rozas, Sanchez-DelBarrio, Messeguer and Rozas2003). Two estimators of the population mutation rate, nucleotide diversity (π) (Tajima, Reference Tajima1983) and nucleotide polymorphism (θ) (Watterson, Reference Watterson1975) were calculated based on all sites. Three neutrality tests, Tajima's D test (Tajima, Reference Tajima1989), Fay and Wu's H test (Fay & Wu, Reference Fay and Wu2000) and the Hudson–Kreitman–Aguadé (HKA) test (Hudson et al., Reference Hudson, Kreitman and Aguade1987), were performed to test for selection. A multi-locus HKA test (http://genfaculty.rutgers.edu/hey/software#HKA) was performed for testing the overall fitness of the observed nucleotide polymorphism and divergence of the 32 MADS-box genes or the 32 control genes to a neutral equilibrium model. The pair-wise HKA test, as implemented in DnaSP (Rozas et al., Reference Rozas, Sanchez-DelBarrio, Messeguer and Rozas2003), was performed to test for selection at each individual locus. Eleven neutral loci (adh1, an1, asg75, bz2, csu1138, csu1171, csu381, csu1132, fus6, glb1 and umc128) (Eyre-Walker et al., Reference Eyre-Walker, Gaut, Hilton, Feldman and Gaut1998; Hilton & Gaut, Reference Hilton and Gaut1998; Tenaillon et al., Reference Tenaillon, Sawkins, Long, Gaut, Doebley and Gaut2001) were used for HKA tests involving maize landraces. A smaller set of neutral loci (adh1, glb1, bz2, csu1132 and csu1171) was available and used for HKA tests involving maize inbreds and teosinte (Tenaillon et al., Reference Tenaillon, U'Ren, Tenaillon and Gaut2004). The overall χ2 value for each pair-wise HKA test was calculated by summing up the χ2 values across different neutral loci.
(iii) Coalescent-simulation-based approach to testing for selection
For each MADS-box gene a coalescent-simulation-based (CS) test was performed to determine whether the gene was a potential target of selection during domestication. We used a modified version of the standard coalescence procedure (Hudson et al., Reference Hudson, Kreitman and Aguade1987) that incorporated the domestication bottleneck as previously described (Eyre-Walker et al., Reference Eyre-Walker, Gaut, Hilton, Feldman and Gaut1998). All parameters in the model were assigned to previously established values (Eyre-Walker et al., Reference Eyre-Walker, Gaut, Hilton, Feldman and Gaut1998; Tenaillon et al., Reference Tenaillon, U'Ren, Tenaillon and Gaut2004). The severity of the bottleneck (k) was defined as a function of the population size during the bottleneck (N b) and the duration of the bottleneck (d) such that k=N b/d. Using sequence data from 30 neutral control genes, the best multilocus estimate of k was found to be 1·8 using methods previously described (Tenaillon et al., Reference Tenaillon, U'Ren, Tenaillon and Gaut2004). To estimate k, we used the number of segregating sites (S) as the summary statistic and explored d values of 500, 1000 and 1500 generations. Finally, k values ranging from 0·5 to 5 (in increments of 0·1) were explored.
We used the coalescence model described above to test for selection in 32 MADS-box genes. This model was implemented using a program provided by Innan & Kim (Reference Innan and Kim2004). For each of the 32 MADS-box genes, 10 000 simulations were conducted. The number of segregating sites S simul was calculated for each of the 10 000 simulated sequence sets. A gene was considered to be a potential target of selection during domestication, if the observed S maizelandraces was <97·5% of the S simul values.
3. Results
(i) Nucleotide diversity in maize and teosinte
First, we compared sequence diversity between the 32 MADS-box genes and the 32 genes chosen at random from the genome. The number of maize landraces and teosintes assayed and the average sequence length sampled were similar in the MADS-box and control genes (Table 1). The proportion of sequence diversity maintained in the maize landraces (or inbreds) to that in teosinte (r=θmaize/θteosinte) was calculated for each gene. When averaged across the control genes, maize landraces retained 64·1% of the genetic diversity found in teosinte. The MADS-box genes retained less sequence diversity (53·4%) than the control genes. This is evident in a plot of nucleotide diversity in maize landraces by that in teosinte where the MADS-box genes have values closer to the x-axis as compared to the control genes (Fig. 2). The values observed in the control genes correspond to previous studies that reported values for maize landraces or maize inbreds ranging from 57 to 80% (Tenaillon et al., Reference Tenaillon, U'Ren, Tenaillon and Gaut2004; Wright et al., Reference Wright, Bi, Schroeder, Yamasaki, Doebley, McMullen and Gaut2005). This provides evidence that the majority of control genes are neutral (did not undergo selection) and therefore serve as a good control set to compare with the MADS-box genes.

Fig. 2. Nucleotide diversity maintained in maize landraces. Nucleotide polymorphism (θ) (Watterson, Reference Watterson1975) in maize landraces (y-axis) plotted against that observed in teosinte (x-axis). Values for the 30 neutral control genes are represented by grey squares; the two candidate-domestication neutral genes excluded when tuning the bottleneck model are represented by blue squares. Values for the 24 neutral MADS-box genes are represented by black diamonds and the values for the eight candidate-domestication MADS-box genes are represented by the red diamonds.
Table 1. Sequence statistics of 32 control genes and 32 MADS-box genes

a Average number of sequences in the alignment.
b Average length of alignments, excluding gaps.
c Average number of segregating sites (SNPs) in the alignments.
d Average amount of nucleotide polymorphism (Watterson's estimator of population mutation parameter).
(ii) Statistical tests for neutrality
A multi-locus HKA test was conducted separately for maize inbreds, landraces and teosintes to assess the overall fit of MADS-box genes or control genes to the neutral model. For MADS-box genes, the null hypothesis of neutrality was rejected in both maize inbreds (P<0·001) and landraces (P<0·001), but not in teosinte (P=0·71). However, for the control genes, the test was only marginally significant for maize inbreds (P=0·04), but not for the maize landraces (P=0·858) or teosinte (P=0·818). These results demonstrate that the MADS-box genes lost more genetic diversity during domestication than a sample of control genes from the genome.
We performed pair-wise HKA tests for selection at individual loci. A gene was considered as a candidate selection gene for domestication if it had significant results for the HKA test in maize landraces but not in teosinte. A gene was considered as a candidate selection gene for improvement if it had a significant HKA test result in maize inbreds but not in maize landraces or teosinte. For nine MADS-box genes (zag1, zag2, zagl1, zmm3, zmm6, zmm19, zmm20, zmm28 and ZmMADS2) the pair-wise HKA test was significant in maize landraces but not in teosinte (Table 2). All these genes demonstrated a reduced level of polymorphism except for zmm20, where more polymorphism was observed among the maize landraces than expected under the neutral evolution model. It is difficult to interpret the HKA test results for zmm20. There are ten haploptyes inferred from 16 landraces; however, there is no strong evidence suggesting that these ten haplotypes underwent diversifying or balancing selection. Only one MADS-box gene, zmm22, yielded a significant pair-wise HKA test in maize inbreds but not in maize landraces (Table 2). Collectively, based on the results of pair-wise HKA tests, signatures of domestication selection were evident at zag1, zag2, zagl1, zmm3, zmm6, zmm19, zmm28 and ZmMADS2 (Fig. 2), and evidence of improvement selection was found at zmm22. Within the control genes, we identified AY111689 as a candidate domestication gene and four additional genes, AY105750, AY108201, AY111546 and AY112456 as candidate improvement genes (Table 3).
Table 2. Results of the pair-wise HKA and CS tests for 32 MADS-box genes

a These sequences are publically available at www.panzea.org and have been deposited into Genbank (HM992947-HM994864).
b The neutral evolution model was rejected because more polymorphisms were observed among the maize landraces than expected under the model.
Table 3. Results of the pair-wise HKA and CS tests for 32 control genes

(iii) Tests for selection under the domestication bottleneck model
The bottleneck model tuned by the 30 neutral control genes was used in order to test for selection for 32 MADS-box genes (Supplementary Results). Control genes AY111689 and AY111546 were excluded because of their domestication gene candidacy (Fig. 2) as indicated by the pair-wise HKA test (Table 3) or results obtained from Tajima's D and Fay and Wu's H test (Supplementary Table 2). We simulated the sequence evolution for each MADS-box gene under the bottleneck model with bottleneck severity (k) equal to 1·8 (when d=1000) with 10 000 replicates. If the observed number of segregating sites, S, in maize landraces was smaller than 97·5% of its simulated values, then the bottleneck effect alone could not explain the observed severe reduction in S and a past selection event may have occurred. For three of the 32 MADS-box genes (zag2, zagl1 and zmm6), the observed S was significantly smaller than expected from the bottleneck effect alone (Table 2). Therefore, coalescent simulation of the bottleneck model provided evidence of selection during domestication at these three loci.
The bottleneck model also provides an opportunity to test whether as a group the MADS-box genes are enriched for domestication genes relative to the group of control genes. If MADS-box genes were targeted by selection more frequently than genes chosen at random from the genome, the bottleneck severity estimated using the 32 MADS-box genes is expected to be much smaller than that for the 32 control genes. When d=1000 and S was used to fit the bottleneck intensity, the approximate maximum likelihood (ML) estimate of k is equal to 1·0 for 32 MADS-box genes versus 1·6 for 32 control genes. The likelihoods for 32 control genes under k=1·6 and k=1·0 are 1·60×10−19 and 3·48×10−21, respectively, and this difference is statistically significant as indicated by the likelihood ratio (LR) test (−2ln LR=7·66, P=0·006). Thus, the control genes fit better with the less severe bottleneck. Reciprocally, the likelihoods for the 32 MADS-box genes under k=1·6 and k=1 are 1·27×10−24 and 5·98×10−23, respectively, and again this difference is significant (−2ln LR=7·70, P=0·006). This result indicates that the MADS-box genes fit better with the more severe bottleneck. Therefore, the 32 MADS-box genes experienced a significantly more severe bottleneck than the 32 control genes.
To test whether our ‘neutral’ MADS-box genes fit the ‘neutral’ bottleneck model, we evaluated estimates of k over 24 potentially neutral MADS-box genes (as assessed by the pair-wise HKA and CS tests) using ±20% S maize as a fitting criterion when d=1000. The approximate maximum likelihood was located at k=1·5 with a confidence interval ranging from ~1·1 to ~2·2. The likelihoods for 24 MADS-box genes under k=1·8 and k=1·5 are 4·40×10−13 and 6·63×10−13, respectively, which are not statistically different (−2ln LR=0·41, P=0·52). Hence, the ‘neutral’ MADS-box genes overall fit well with the ‘neutral’ bottleneck model tuned by the 30 neutral control genes. In addition, the consistency of k estimates between neutral MADS-box and neutral control genes suggests that k=~1·5–1·8 may well represent a general effect of bottleneck on maize sequence variation.
(iv) Selection sweeps in candidate domestication MADS-box genes
In order to investigate the extent of the selection sweeps in seven of the candidate domestication MADS-box genes (zag1, zag2, zagl1, zmm3, zmm6, zmm19 and zmm28), we sampled DNA polymorphism among maize landraces and teosinte in additional coding and 5′ regulatory regions (Fig. 3). Evidence of selection was found in the additional sampled coding sequences from five (zag1, zag2, zagl1, zmm6 and zmm28) of the candidate domestication genes (Fig. 3, Table 4). A single haplotype was fixed among all maize landraces sampled in the 3′ coding regions of both zag2 and zagl1, suggesting the presence of the selected site(s) within these regions. The evidence of selection was limited to the initially sequenced regions in the other two candidate domestication genes, zmm3 and zmm19. In contrast to the coding regions, the examined 5′ regulatory regions did not show any evidence of selection associated with domestication in any of the seven genes.

Fig. 3. Extended survey of the selection sweeps in seven MADS-box candidate-domestication genes. Solid black boxes represent exons and lines represent UTR regions or introns. White and grey boxes represent sequenced regions and are labelled with the corresponding PANZEA marker number (http://www.panzea.org). The HKA or coalescent simulation (CS) test gave no evidence of selection (NS) for amplicons depicted as white boxes. Amplicons depicted as grey boxes had evidence of selection (S) in at least one of the two tests.
Table 4. Results of the pair-wise HKA and CS tests for additional regions sequenced in candidate domestication MADS-box genes

a The neutral evolution model was rejected because more polymorphisms were observed among the maize landraces than expected under the model.
4. Discussion
We tested 32 MADS-box genes to determine if they were under selection during maize domestication or improvement. Neutrality and coalescent simulation-based (CS) tests identify eight of these genes as putative domestication genes and one as a putative improvement gene. In order to assess if MADS-box genes were more frequent targets of selection than expected by chance, we also tested 32 randomly chosen genes from the genome for signatures of selection. This comparison indicates that the MADS-box genes are more enriched for selected genes than would be expected by chance.
(i) Search for targets of selection
Three of the eight MADS-box genes were identified as putative targets of selection during domestication by both the pair-wise HKA and the CS test. The other five putative domestication MADS-box genes were identified by the pair-wise HKA test alone. There are many possible reasons why the results from the pair-wise HKA and the CS test were not entirely consistent. First, the CS test is heavily influenced by the model parameters used. In our analysis, we estimated the population recombination rate using data from teosinte. This was most likely an underestimate due to the fact that only a small proportion of the recombination events that occurred can be detected based on population genetic data (Hudson & Kaplan, Reference Hudson and Kaplan1985; Stumpf & McVean, Reference Stumpf and McVean2003). This would lead to wide distributions for summary statistics (e.g., S, π), making the test more conservative.
Second, selection associated with domestication could have acted on existing alleles with moderate frequency in the teosinte populations as opposed to newly arising mutations. In such cases, selection does not necessarily leave an apparent signature on the patterns of nucleotide variation in the regions closely linked to the selected site. If the initial frequency of the beneficial allele, p, is <0·2, the signature of artificial selection can be captured with a reasonably high probability, but the chance of detecting selection is very low when p>0·5 (Innan & Kim, Reference Innan and Kim2004). Therefore, various tests could yield inconsistent results due to the weak trace left by the selection event. For example, when p is small, selection is likely to be detected by the HKA test; however, when p is moderate and polymorphism is not significantly reduced, those tests looking at the allele frequency spectrum (e.g. Tajima's D and Fay and Wu's H tests) will have more power (Innan & Kim, Reference Innan and Kim2004).
Third, the chance to detect positive selection is also a function of the strength of selection and the amount of recombination between the selected and neutral sites (Braverman et al., Reference Braverman, Hudson, Kaplan, Langley and Stephan1995; Przeworski, Reference Przeworski2002; Przeworski, Reference Przeworski2003; Wright & Gaut, Reference Wright and Gaut2005). Borderline evidence of selection may be found at loci that were under weak selection. Recombination could have broken down the linkage between the selected site and the regions we have surveyed and hence only marginally or nearly significant results were found in the sampled regions.
(ii) MADS-box genes as frequent targets of selection during maize domestication
There are striking differences in inflorescence and plant architecture between maize and teosinte as a result of selection during domestication. MADS-box transcription factors are known to affect both inflorescence and plant architecture in various plant species (Gu et al., Reference Gu, Ferrándiz, Yanofsky and Martienssen1998; De Bodt et al., Reference De Bodt, Raes, Van de Peer and Theissen2003). Accordingly, we hypothesized that MADS-box genes had contributed to the morphological change of maize during domestication and would be more enriched for domestication genes than expected by chance.
Several lines of evidence support the hypothesis that MADS-box genes were more frequently targeted by selection during domestication than a comparable set of genes chosen at random. First, the multi-locus HKA test conducted using the maize landraces detected evidence of selection among the MADS-box genes but not for the control genes. This same test did not detect any evidence of selection for either group of genes in teosinte. Second, the bottleneck intensity based on the 32 MADS-box genes is significantly more severe than the bottleneck intensity estimated over the 32 control genes. The parameter of the bottleneck intensity, k, is ~1·0 for 32 MADS-box genes versus ~1·6 for 32 control genes. The likelihood ratio test indicated that this difference of k was significant (−2ln LR=7·66, P=0·006). Third, the proportion of MADS-box genes identified as domestication gene candidates by the pair-wise HKA test was higher than that observed for the control genes. Eight out of the 32 (25%) MADS-box genes were classified into the ‘domestication’ class as opposed to only one out of the 32 (3·1%) control genes. Moreover, if we compare 25% to an empirical estimate of the proportion of selected genes during maize domestication and improvement (~2–4%) (Wright et al., Reference Wright, Bi, Schroeder, Yamasaki, Doebley, McMullen and Gaut2005), then 25% is significantly higher than the upper bound of the estimate (~4%) (Binomial test, P<0·001). In summary, the higher proportion of domestication genes in the MADS-box gene family, together with results from other independent tests, provides evidence for the MADS-box genes being more frequent targets of selection during domestication than expected by chance.
Our results argue that MADS-box genes have served an important role in the morphological change that was selected for during maize domestication. Additional experimentation and analysis in other crops will be necessary to see if this phenomenon is limited to maize. Preliminary evidence suggests that MADS-box genes will prove to be an important source of domestication genes and varietal differences in other systems (Purugganan et al., Reference Purugganan, Boyles and Suddith2000; Smith & King, Reference Smith and King2000; Vrebalov et al., Reference Vrebalov, Ruezinsky, Padmanabhan, White, Medrano, Drake, Schuch and Giovannoni2002; Yan et al., Reference Yan, Loukoianov, Tranquilli, Helguera, Fahima and Dubcovsky2003). This study also provides further evidence that transcription factors are over-represented among domestication genes (Doebely, Reference Doebely2006). This observation suggests that further sequencing and analysis of transcription factor families could result in the identification of other domestication genes and subsequently, clarify our understanding of the domestication process.
This work was funded by National Science Foundation grants DBI-0321467 and DBI-0820619, National Institutes of Health grant GM-58816, U.S. Department of Agriculture Hatch grant WIS04772 and research funds provided by the USDA-ARS to M.D.M.


