


Introduction
Cerebral blood flow (CBF) is focally reduced in acute ischemic stroke patients, within the infarct core and the penumbra. Pharmacological agents that lower blood pressure (BP) are generally avoided in acute stroke, due to concerns that they might exacerbate this hypoperfusion. Reference Symon, Branston and Strong1 Nevertheless, high BP in the acute phase is associated with poor functional outcomes due to lower revascularization rates, decreased collateral flow on baseline angiography, and hemorrhagic transformation. Reference Malhotra, Ahmed and Alexandrov2–Reference Regenhardt, Das and Stapleton4
Nitroglycerin (NTG) is a vasodilator that has a mild antihypertensive effect. Randomized trials have demonstrated that transdermal NTG may reduce BP in both ischemic stroke and intracerebral hemorrhage in ultra-early, early, and subacute phase. 5–Reference Ankolekar, Fuller and Cross7 NTG is a nitric oxide donor with other properties, including an antiplatelet effect and prevention of ischemia-induced apoptosis. Experimental stroke models have observed that nitric oxide donors reduce cerebral infarct volume and increase cortical CBF. Reference Willmot, Gray, Gibson, Murphy and Bath8,Reference Maniskas, Roberts and Trueman9 In healthy human volunteers, NTG leads to a decrease in mean arterial pressure and an increase in cerebral perfusion pressure (CPP) without any change in hemispheric CBF. Reference Dahl, Russell, Nyberg-Hansen and Rootwelt10,Reference Moppett, Sherman, Wild, Latter and Mahajan11 In a randomized controlled trial in patients with recent stroke, transdermal NTG maintained CBF in infarct core, penumbra, and ipsilateral hemisphere despite 14% systolic BP reduction after 1 h. Reference Willmot, Ghadami, Whysall, Clarke, Wardlaw and Bath6 It is unknown if CBF is maintained beyond 1 h or if NTG is associated with an increase in CBF in hypoperfused tissue as described experimentally. Reference Willmot, Gray, Gibson, Murphy and Bath8,Reference Maniskas, Roberts and Trueman9 We tested the hypothesis that NTG increases cerebral perfusion focally and globally in acute ischemic stroke patients, using serial perfusion-weighted magnetic resonance imaging (PWI-MRI) measurements.
In order to minimize the potential for decreased CPP, treatment with NTG was stratified by baseline mean arterial pressure (MAP). Current guidelines provide systolic and diastolic BP treatment thresholds for acute stroke patients. Reference Casaubon, Boulanger and Blacquiere12 However, CPP is dependent on MAP, rather than systolic or diastolic BP alone. Reference Qureshi13 In acute stroke, systolic BP is elevated in 63% of patients, but MAP is elevated in only 38%. In patients with isolated systolic hypertension, treatment may therefore potentially lead to greater falls in MAP and subsequently CPP. Reference Whalin, Halenda and Haussen14 A MAP of <100 mmHg is associated with a higher proportion of in-hospital mortality, inability to ambulate at the time of discharge and failure to return home. Reference Vemmos, Tsivgoulis and Spengos15,Reference Bangalore, Schwamm and Smith16
Patients and Methods
The Perfusion and Antihypertensive Therapy in Acute Ischemic Stroke (PATIS) study was a prospective controlled observational study of CBF pre- and post-BP treatment in acute ischemic stroke patients (ClinicalTrials.gov Identifier: NCT02327793). The study was approved by the Human Research Ethics Office, University of Alberta, Canada (Pro00001847). The first phase of the study, published previously, was a serial PWI-MRI investigation of the effect of intravenous labetalol and sublingual NTG on MAP and CBF 30 min after treatment. Reference Kate, Asdaghi and Gioia17 In the second phase of the study, described here, patients with MAP > 100 mmHg were treated with transdermal NTG for 72 h and in those with MAP ≤ 100 mmHg, no antihypertensive was given. A repeat PWI-MR was performed after 72 h.
Inclusion Criteria
Adult patients with acute ischemic stroke presenting within 72 h of symptom onset were eligible. All patients had evidence of cortical infarction on diffusion-weighted MRI (DWI-MRI). Partial and total anterior circulation infarcts (PACI), Oxfords hire Stroke Classification Project (OSCP), as well as posterior circulation infarcts (POCI) with evidence of cortical infarction in the territory of the posterior cerebral artery or its branches, including the occipital and mesial temporal lobes were all eligible. Reference Lindley, Warlow, Wardlaw, Dennis, Slattery and Sandercock18 Patients treated with tissue plasminogen activator (tPA) were eligible.
Exclusion Criteria
Patients were excluded if they had a contraindication (i.e. known extracranial/intracranial arterial stenosis, high-grade stenotic valvular heart disease, or severe renal failure) or definite indication (i.e. hypertensive encephalopathy or aortic dissection) for BP reduction. Other exclusion criteria were contraindications to MRI, allergy to gadolinium contrast, requirement for oxygen therapy (>4 l/min to keep SpO2 ≥92% by nasal cannulae), suspected hemodynamic stroke mechanism, evidence of significant mass effect secondary to acute infarction, known allergic reaction to NTG/labetalol/adhesives in NTG patches/angiotensin-converting enzyme (ACE) inhibitors/angiotensin receptor blockers, or use of phosphodiesterase inhibitors such as sildenafil or tadalafil within 12 h of the baseline MRI.
BP Management Protocols
Patients were stratified into two groups based on the baseline MAP (≥2 readings ≥5 min apart). Patients with MAP > 100 mmHg were treated with transdermal NTG, at a dose of 0.2 mg/h (Nitro-Dur) for 72 h without a drug-free interval (NTG group). Patients with MAP < 100 mmHg were not treated. All patients had hourly automated noninvasive BP (Intellivue MP 70 with Standard Multi-Measurement Server, Philips Healthcare, The Netherlands) monitoring for 24 h. For the next 48 h, BP was recorded every 12 h with a noninvasive BP monitor. On Day 2 of enrolment irrespective of the groups, if the MAP was >100 mmHg (at that time), patients were administered with oral ACE inhibitors (perindopril 4 mg daily). Patients with ACE inhibitor intolerance received the angiotensin receptor blocker, candesartan 4 mg daily.
Clinical Assessments
Demographic profile, medical history including antihypertensive medications and Glasgow Coma Scale were recorded in a case record form. Trained personnel assessed the National Institute of Health Stroke Scale (NIHSS) scores at baseline, immediately after the second PWI, at 24 h for 30 and 90 days. Functional assessment (modified Rankin scale) was performed at 24 h for 30 and 90 days.
Imaging Procedures
Patients underwent an MRI scan within 72 h of stroke onset. All imaging sequences were repeated 72 h later. Patients were imaged using an eight-channel phased array radiofrequency head coil (MRI Devices, Waukesha, WI) on a 1.5-T whole-body Siemens Sonata MRI scanner (Siemens Medical Systems, Erlangen, Germany). The imaging protocol consisted of a T1-weighted sagittal localizer, time-of-flight magnetic resonance angiogram (MRA), gradient recalled echo (GRE), DWI, fluid-attenuated inversion recovery (FLAIR), and PWI. DWI acquisition parameters were: repetition time (TR) of 3 s, spin-echo time (TE) of 86 ms, 8 averages, 128 × 128 matrix base resolution zero-filled to 256 × 256, 22 cm field of view, and slice thickness of 5 mm with a 1.5 mm inter-slice gap. Isotropic DWI images were obtained by averaging the b = 1000 signal from all orthogonal directions. Raw perfusion images were obtained with the administration of intravenous gadolinium (0.1 mmol/kg; 5 ml/s power injection, followed by 20 ml saline flush 5 ml/s, via an 18 g angiocatheter in an antecubital vein) with echo-planar imaging gradient-echo (T2*) images acquired every 1.4 s for 84 s (16 axial slices at each of the 60 time points).
Image Analysis
Anonymized images were post-processed and reviewed by two raters (MK and KB), who were blinded to the outcome and treatment group. Baseline and 72 -h infarct volumes were measured on DWI using semi-automated planimetric measurement techniques included in the Analyze 12.0 software package (Biomedical Imaging Resource, Rochester, NY). Reference Robb19
Raw PWI source images were transferred to a computer workstation and post-processed using the MIStar software package, Version 3.2 (Apollo Medical Imaging Technology, Melbourne, Australia). An arterial input function was selected automatically in the contralateral middle cerebral artery. An arrival time deconvolution algorithm was used to calculate voxel-wise maps of CBF, cerebral blood volume (CBV), mean transit time (MTT), and delay time (DT) to a peak of the residue function. Reference Bivard, Spratt, Levi and Parsons20 These perfusion maps were then imported into Analyze 12.0 for the planimetric region of interest (ROI) analysis and volume measurements.
Infarct ROIs were drawn on DWI isotropic images obtained pre- and 72 h post -BP reduction. They were later co-registered to CBF, CBV, MTT and DT maps. The mean absolute perfusion value within the core infarct ROI was then measured (Figure 1). Mean perfusion values were measured in the homologous region of the contralateral hemisphere. Relative CBF (rCBF), relative CBV (rCBV), and relative MTT (rMTT) were calculated as the ratio of the absolute mean value in the infarct core and homologous contralateral region. Relative DT (rDT) was defined as the difference between the absolute mean in the infarct region and that in the contralateral homologous region.
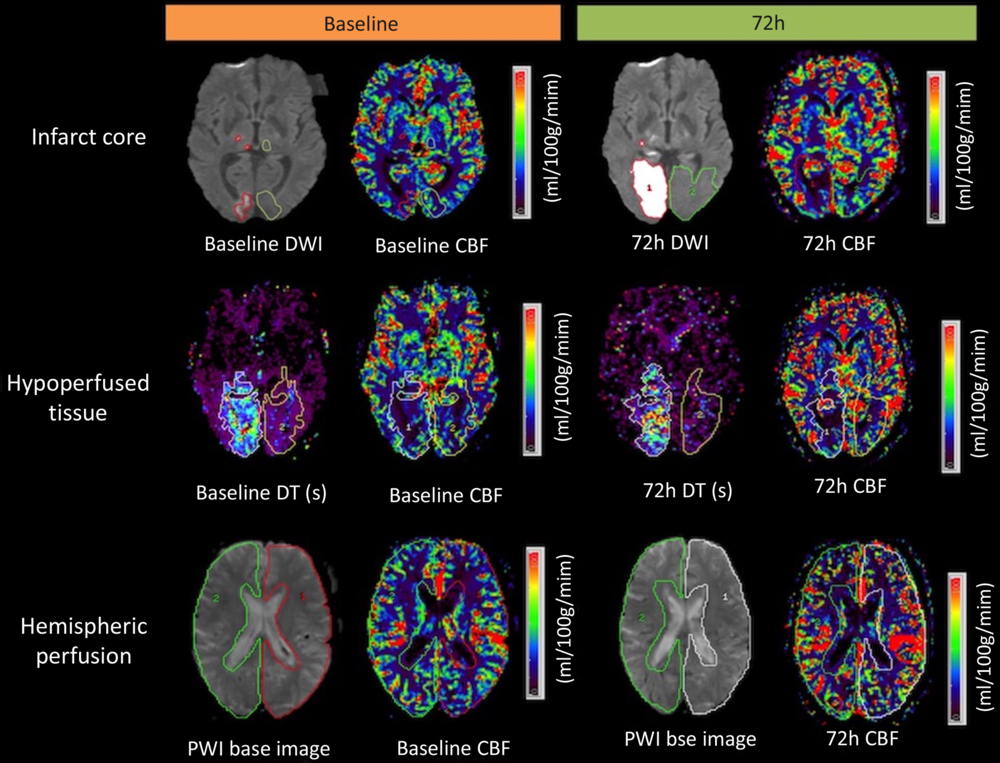
Figure 1: Measurement of infarct core, hypoperfused region, and hemispheric CBF in a patient with an acute right occipital artery territory infarct. The infarct core region of interest (ROI) red outline in the first row, was drawn on the baseline and at 72 h diffusion-weighted images (DWI). The infarct core ROI was then co-registered with CBF maps at baseline and at 72 h to assess a mean CBF in infarct core region. Relative perfusion measures were calculated using homologous contralateral ROIs (green). The hypoperfused region ROI included voxels with delayed contrast arrival (DT+2 s) and CBF ≤18 ml/100 g/min. The PWI base image was used to draw hemispheric ROIs.
Hypoperfused tissue volume was measured at two time points (baseline and 72 h later) using a double-threshold technique. Reference Bivard, Levi, Spratt and Parsons21 The initial hypoperfused volume was defined using a DT threshold of >2 s within the symptomatic hemisphere, as previously described. Reference Bivard, Spratt, Levi and Parsons20 This ROI was then transferred to a normalized CBF map (white matter = 22 ml/100 g/min). Voxels containing blood vessels were removed from ROI using an intensity threshold (CBF > 100 ml/100 g per minute or CBV > 8 ml/100 g). Reference Murphy, Fox and Lee22 Voxels within this ROI ≤ 18 ml/100 g per minute were defined as the final hypoperfused tissue volume. Reference Schlaug, Benfield and Baird23,Reference Butcher, Parsons and MacGregor24 Relative CBF, CBV, and MTT values within the hypoperfused volume and ipsilateral hemisphere were calculated in the same fashion as for the core infarct (Figure 1).
Outcomes
The primary outcome measure was changed in absolute CBF in the hypoperfused region at 72 h in the NTG group. Secondary outcomes included differences in hypoperfused tissue volumes between treatment groups, infarct volume growth, and hypoperfused region volume change at 72 h. Clinical outcomes were MAP at 72 h, blood pressure variability (BPV) at 72 h, and NIHSS at 72 h.
Statistical Analysis
The differences in mean absolute CBF in the hypoperfused region between baseline and 72 h imaging were assessed with a paired t-test. Hypoperfused region and infarct volumes were not normally distributed (Shapiro–Wilk test, p < 0.001). Changes in median volumes were therefore assessed with a Mann–Whitney U-test. The mean and median differences between groups were assessed with independent t-tests and Mann–Whitney U-test. A multiple linear regression was performed. To avoid over-specification, we included the two variables with the most significant independent effects in the model (age and thrombolysis). A multiple logistic regression was performed to assess the relation of infarct core volume at 72 h between the untreated and NTG-treated groups.
BPs over time and between groups were assessed with a repeated measure variance analysis (two-way repeated ANOVA: between-groups [NTG-treated/untreated]; within: time [baseline/2h/12h/24h/36/48h/72h]) with Bonferroni tests. Systolic BP, diastolic BP, and MAP BPV were assessed in both groups at baseline, 2, 12, 24 36, 48, and 72 h later. BPV indices included SD, coefficient of variation (CV), average real variability (ARV), variation independent of the mean (VIM), and successive variation (SV). Reference De Havenon, Bennett and Stoddard25,Reference Manning, Mistri, Potter, Rothwell and Robinson26 All tests were performed in IBM SPSS Version 24 and significance was set at p < 0.05.
Results
Baseline Characteristics
Thirty-five patients underwent PWI immediately before and 72 h after BP management.
Patients with baseline MAP >100 mmHg (n = 20) were treated with transdermal NTG (0.2 mg/h) for 72 h (NTG group). Patients with MAP ≤ 100 mmHg (n = 15) were not treated (untreated group). Patients in the NTG group were older (mean difference (MD) 8.9 years 95% confidence interval (CI) 0.4, 7.3; p = 0.04) than those in the untreated group. Patients in the NTG group were more likely to have a history of prior stroke, while those in the untreated group were more likely to have been treated with tPA (Table 1).
Table 1: Baseline patient characteristics

MRA = magnetic resonance angiography.
Blood Pressure Changes
The mean baseline BPs were higher in the NTG group than that in the untreated group (Table 1). Two hours after treatment initiation, there was no difference in systolic BP reduction (1.2 ± 15.9 vs. (−5.7) ± 9.6 mmHg, p = 0.1), diastolic BP reduction (1.2 ± 17.7 vs. (−4.7) ± 13.5 mmHg, p = 0.2), or MAP reduction (1.2 ± 12.6 vs. (−5.1) ± 9 mmHg, p = 0.09) between the NTG and untreated groups. Similarly, 72 h after treatment initiation, there was no difference in systolic BP reduction (12 ± 27.2 vs. (−5.4) ± 25.9 mmHg, p = 0.09), diastolic BP reduction (6 ± 20.9 vs. (−2.1) ± 15.3 mmHg, p = 0.2), and MAP reduction (8 ± 20.7 vs. (−3) ± 16.9 mmHg, p = 0.1) between the NTG and untreated groups. A two-way repeated-measures ANOVA indicated no effect of treatment or time for systolic BP (p = 0.53), diastolic BP (p = 0.29), or MAP (p = 0.56) (Figure 2A–C). A total of 10 (50%) patients in the NTG-treated group had a MAP > 100 mmHg on Day 2, and all these patients received perindopril 4 mg one time daily.

Figure 2: Mean systolic (A), diastolic (B), and Mean Arterial Pressure (C) measurements over 72-h treatment period in the two experimental groups.
Baseline and 72-H Infarct and Hypoperfused Volumes
The cerebral perfusion parameters in the treatment groups are presented in Table 2. Baseline PWI was performed at a mean 22.9 ± 15 h after symptom onset. The mean absolute CBF in the hypoperfused region at baseline was similar in the NTG (32.7 ± 8.4 ml/100 g/min) and untreated groups (33.3 ± 10.2 ml/100 g/min; p = 0.8).
Table 2: Effect of NTG on cerebral perfusion * and infarct volume between baseline and 72 h measurements

* Mean ± SD.
# Median.
** Significant on multiple linear regression.
The mean time to repeat PWI and DWI was 72 ± 18 h after baseline assessment. There was infarct growth at 72 h in both in the untreated group and NTG-treated group (p < 0.0001; Table 2) compared to baseline. On univariate analysis, median infarct growth was greater in the untreated group (11.8 (5.7–44.2) ml), than the NTG group (3.2 (0.5–16.5) ml; p = 0.033). This between-group differences in infarct growth was not significant after adjustment for age (p = 0.3). Repeat PWI demonstrated reperfusion in both groups, with similar hypoperfused region volumes at 72 h in the untreated (8 (3.1–36.4) ml) and NTG groups (2.9 (1–8.1) p = 0.03).
Cerebral Blood Flow in Hypoperfused Tissue Regions
The mean absolute CBF in the hypoperfused region at 72 h (29.9 ± 12 ml/100 g/min) was not different from the baseline value (33.3 ± 10.2 ml/100 g/min, p = 0.15) in the NTG group. In the untreated group, the CBF at 72 h (24.1 ± 10 ml/100 g/min) was lower than that at baseline (32.7 ± 8.4 ml/100 g/min; p = 0.03). However, on regression adjustment, the apparent difference was no longer evident. In the untreated group, relative mean transit time (rMTT) in the infarct core region (B = 1.09, 95% CI 0.44–1.7; p = 0.003) and relative cerebral blood volume (rCBV) in the hypoperfused region (B = 0.52 95% CI 0.17–0.87; p = 0.008) reduced at 72 h compared to the baseline. Mean absolute CBF in the hypoperfused region at 72 h was not different in the NTG group compared to that in the untreated patients (MD between groups 5.1 ± 10.3 ml/100 g/min; p = 0.8).
Clinical Outcomes
All indices of BPV were similar in the untreated and NTG groups (Table 3). There were no correlations between any of the BPV and perfusion parameters. None of the patients in the NTG group developed clinical deterioration after treatment. A total of 9 (25.7%) patients were thrombolysed prior to recruitment (Table 1). There were no differences in cerebral perfusion parameters, infarct core volumes, or hypoperfused tissue volumes between patients who were thrombolysed and those who were not. The median NIHSS score at 72 h was similar in the untreated 11 (2–16) and NTG groups (5 (3–8); p = 0.2). Median mRS scores in the NTG group (2 (2–4)) were similar to those in the untreated group (3 (2–4), p = ns) at 30 days.
Table 3: Blood pressure variability in subacute stroke at 72 h according to treatment groups

Discussion
In this serial PWI study, transdermal NTG was not associated with an increase in cerebral perfusion within the hypoperfused region, infarct core, or globally in either hemisphere. In addition, transdermal NTG did not appear to have a significant antihypertensive effect at 72 h.
Vasoactive agents have generally been avoided in acute ischemic stroke due to concerns that this may exacerbate cerebral hypoperfusion. Indeed there is experimental stroke model data to support this. Reference Dirnagl and Pulsinelli27 Clinical trials have demonstrated either no benefit Reference He, Zhang and Xu28,Reference Hong29 or a trend to worse outcome in patients treated with antihypertensive agents. Reference Bath, Scutt and Anderson30,Reference Sandset, Bath and Boysen31 Nonetheless, there are some data suggesting BP reduction may have beneficial effects on cerebral perfusion. Longitudinal cerebral perfusion studies in chronic hypertension have suggested that sustained BP reduction may be associated with improvements in CBF at 12 weeks and 6 months. Reference Tryambake, He, Firbank, O’Brien, Blamire and Ford32,Reference Lipsitz, Gagnon and Vyas33 Mild CBF improvement following BP reduction has also been reported in acute/subacute ischemic stroke patients treated with nimodipine and assessed with PET/SPECT perfusion measurements. Reference Infeld, Davis and Donnan34,Reference Hakim, Evans and Berger35
NTG is a vasodilator with mild hypotensive effects, but it has also been hypothesized to improve cortical cerebral perfusion. Reference Willmot, Gray, Gibson, Murphy and Bath8 Although we did not demonstrate improvements in CBF, there was no exacerbation of the severity or volume of the hypoperfused tissue either. Our results are consistent with the findings of a systematic review indicating modest pharmacological BP reduction is not associated with a decrease in CBF. Reference Sare, Gray and Bath36 There is one other published study of perfusion changes associated with transdermal NTG treatment. In a randomized, blinded evaluation trial, investigators assessed regional CBF changes using xenon CT measurements in 18 ischemic and hemorrhagic stroke patients within 5 days of onset. Reference Willmot, Ghadami, Whysall, Clarke, Wardlaw and Bath6 Perfusion measurements were made before and 1 h after NTG or sham patch application. Systolic BP decreased by 23 mmHg after 1 h in the NTG group, and, similar to our own results, this was not associated with a decrease in global, hemispheric, or hemispheric CBF. In our study, we assessed changes in CBF using PWI-MR prior to and 72 h after transdermal NTG treatment. We did not observe a decline in MAP with transdermal NTG at 72 h (Figure 2A–C).
In the recently published RIGHT-2 trial, 1149 suspected stroke patients were randomized to transdermal NTG (5 mg daily for 4 days) or placebo. Reference Bath, Scutt and Anderson30 All patients were randomized in an ambulance en route to a stroke center, at a median time of 71 (45–116) min after symptom onset. The effect of NTG on CBF was not assessed, but the functional outcome at 3 months was not improved over placebo. The NTG and control groups had similar BPs 15 min after randomization, but on arrival to the hospital, systolic pressures were 5.8 mmHg lower in the NTG group. Pressures were again similar in both treatment groups by Day 3. The lack of a sustained BP effect seen in both RIGHT-2 and the present study likely reflect tachyphylaxis associated with prolonged administration of NTG. Reference Münzel, Daiber and Mülsch37,Reference Sage, de la, Lande and Stafford38
In the present study, infarct volume expansion appeared to be attenuated in the NTG group, relative to the untreated patients. While it is possible that this represents a treatment effect, perhaps related to other pleiotropic effects of NTG, Reference Ankolekar, Fuller and Cross7 this may represent a type I error, particularly given the fact that these groups were not randomized, nor were they balanced with respect to baseline infarct characteristics (Table 2).
Our study has several limitations, primarily the small sample size and non-randomized design. We cannot rule out an effect of NTG on CBF. This was a secondary analysis of a trial aimed at determining the effect of BP reduction on cerebral perfusion and is most certainly underpowered. Serial studies of CBF using nondiffusible tracers are exceedingly difficult to complete in ill patients, which likely explains the lack of previous studies of this nature. Although a randomized design is certainly preferable, the effect of BP lowering is and remains controversial, with most guideline statements suggesting caution in patients with low-normal BP. We, therefore, chose an open-label design, based on the pretreatment BP in this exploratory physiological endpoint study, accepting the inherent weakness of the study in favor of patient safety. We assessed CBF after 23 and 72 h, respectively, when the volume of at-risk tissue is generally lower, which may make the findings less relevant to acute treatment. A recently published sub-study of the DEFUSE-3 trial, however, indicated that penumbral tissue may persist for up to 38 h in some patients. Reference Christensen, Mlynash and Kemp39 We have excluded patients with known intracranial and extracranial carotid stenosis (>50%). It is possible that these patients may actually benefit from BP reduction. ACE inhibitors were used in 10 patients in the NTG-treated group on Day 2 that may affect CBF. We also assessed perfusion at later time points when tachyphylaxis of NTG is expected. This may also have contributed to the lack of effect on CBF. However, we did not see any change in BP, even within 6 h, which has been hypothesized to be the time window in which this medication is most effective. Reference Woodhouse, Scutt and Krishnan40 In addition, we have previously assessed the effect of high dose sublingual NTG on early perfusion changes (30 min) and found a similar lack of effect. Reference Kate, Asdaghi and Gioia17
Conclusion
Transdermal NTG was not associated with improvements in cerebral perfusion in hypoperfused regions or a decline in MAP 72 h after treatment.
Funding
This trial was funded by grant-in-aid support from the Canadian Institutes of Health Research (G11816079). KB holds a Canada Research Chair in Cerebrovascular Disease, a Heart and Stroke Foundation of Alberta (HSFA) Professorship in Stroke Medicine, and a New Investigator Award from Alberta Innovates Health Solutions (AIHS). MK and LG were supported by the Clinician Fellowship, Alberta Innovates Health Solutions, Alberta, Canada.
Disclosures
LG reports Speaker/advisory board Honoraria from BMS-Pfizer and Bayer. Research support and advisory board Honoraria from Servier Canada. KB reports grant and personal fees from Servier Canada, Boehringer Ingelheim, Bayer, and BMS-Pfizer. The other authors have no conflicts of interest to declare.
Statement of Authorship
MK concept, enrolment of subjects, image analysis, statistical analysis, and the first draft of manuscript; LG enrolment of subjects, image analysis, and critical revision; NA study design, enrolment of subjects, and critical revision; TJ study design, enrolment of subjects, and critical revision; AS enrolment of subjects, critical revision; BB enrolment of subjects, critical revision; DE enrolment of subjects, critical revision; CB enrolment of subjects, critical revision; KB concept, study design, enrolment of subjects, image analysis, and critical revision.


