


Background
Schizophrenia-spectrum disorders (SSDs) are debilitating disorders characterized by a heterogeneous constellation of symptoms, including positive and negative symptoms as well as cognitive dysfunction [Reference Kahn, Sommer, Murray, Meyer-Lindenberg, Weinberger and Cannon1]. Early research using magnetic resonance imaging (MRI) established structural abnormalities, such as volume deficits and a higher rate of atrophy in patients with SSDs, further supported by longitudinal studies [Reference Borgwardt, Mcguire, Aston, Gschwandtner, Pfluger and Stieglitz2–Reference Van Haren, Pol, Schnack, Cahn, Brans and Carati4]. The loss of gray-matter volume may reflect a reduction of neuropil, indicating changes in synaptic and dendritic organization in patients with SSDs [Reference Howes and Shatalina5], that could in turn underlie disruptions in functional connectivity. This is in line with increasing evidence supporting the conceptualization of SSD as a network disorder [Reference Brandl, Avram, Weise, Shang, Simões and Bertram6–Reference Zhang, Braun, Harneit, Zang, Geiger and Betzel10]. Accordingly, studies employing resting state functional MRI (rs-fMRI) have not only demonstrated widespread changes in regional function using regional homogeneity (ReHo) and amplitude of low-frequency fluctuations (ALFF) as local activity measures [Reference Qiu, Zhang, Wen, Jiang, Mao and Yan11, Reference Zhao, Zhu, Liu, Pu, Lai and Chen12] but also abnormal organization in large-scale functional connectivity (FC) networks in patients with SSDs compared to healthy controls [Reference O’Neill, Mechelli and Bhattacharyya13]. A triple network model of disturbed networks (i.e., default mode (DMN), central executive (CEN), and salience network (SN)) has been suggested to play a prominent role in SSDs [Reference Menon14]. Importantly, the SN is thought to act as a switch between activating and deactivating the DMN and CEN, thus modulating internal and external attention [Reference Goulden, Khusnulina, Davis, Bracewell, Bokde and McNulty15, Reference Sridharan, Levitin and Menon16]. Consistent with this role, disturbances in the SN – particularly in regions such as the anterior insula and anterior cingulate cortex – have been linked to both positive and negative symptoms in SSDs [Reference Goodkind, Eickhoff, Oathes, Jiang, Chang and Jones-Hagata17–Reference Walter, Suenderhauf, Smieskova, Lenz, Harrisberger and Schmidt20]. However, the mechanisms behind rs-fMRI abnormalities in SSDs remain unknown.
With regard to brain neurotransmission systems, both animal and post-mortem studies have implicated the dysfunction of glutamatergic signaling in the pathophysiology of SSDs, findings further supported by in vivo studies in which pharmacological manipulation of glutamate (Glu) signaling either triggered or reduced psychotic symptoms [Reference Beck, Hindley, Borgan, Ginestet, McCutcheon and Brugger21–Reference McCutcheon, Krystal and Howes23]. This link has also been established in in vivo neuroimaging studies directly demonstrating abnormal glutamatergic levels among SSD patients using proton magnetic resonance spectroscopy (1H-MRS; see Merritt et al. [Reference Merritt, Egerton, Kempton, Taylor and McGuire24]). Similarly, evidence suggests that abnormalities of the γ-aminobutyric acid (GABA) system are also implicated in the pathophysiology of SSDs [Reference Lewis, Hashimoto and Volk25, Reference Nakahara, Tsugawa, Noda, Ueno, Honda and Kinjo26]. Glutamatergic and GABA signaling together maintain the balance between excitation and inhibition, thereby fundamental for generating synchronized neural oscillations [Reference Uhlhaas and Singer27]. These synchronized patterns drive slow fluctuations in brain activity, which are observable with rs-fMRI, and form the foundation of functional brain networks [Reference Niessing, Ebisch, Schmidt, Niessing, Singer and Galuske28, Reference Schirner, McIntosh, Jirsa, Deco and Ritter29]. Given the essential role of both glutamate and GABA signaling in coordinating synchronized neural activity across the brain, disruptions in these systems may impact functional brain networks. Supporting this, studies have shown that administering drugs affecting glutamatergic and GABAergic signaling, such as ketamine, can alter functional network connectivity [Reference Fleming, Javitt, Carter, Kantrowitz, Girgis and Kegeles30, Reference Mueller, Musso, London, De Boer, Zacharias and Winterer31].
Although previous studies have explored the relationship between glutamate or GABA levels and functional brain networks in SSD patients, the results – along with the choice of measure of glutamate (e.g., glutamate or combination of glutamate and glutamine (Glx)) and/or inclusion of GABA – have been inconsistent [Reference Chen, Song, Öngür and Du32–Reference Shukla, Wijtenburg, Chen, Chiappelli, Kochunov and Hong38]. Moreover, few, if any, have related these findings to symptomatology, limiting our understanding of how neurochemical alterations translate into clinical manifestations. Gaining insight into the connection between glutamate and GABA levels and functional brain networks is fundamental for advancing our understanding of disease mechanisms and informing the development of new therapeutic strategies [Reference Javitt, Carter, Krystal, Kantrowitz, Girgis and Kegeles39].
In this study, we investigated how the neurotransmitters glutamate and GABA are linked to differences in brain network connectivity between schizophrenic patients and healthy controls, and how these links may relate to symptomatology in SSDs. To this end, we used proton magnetic resonance spectroscopy (1H-MRS) to estimate Glu and GABA levels in the anterior cingulate cortex, rs-fMRI to evaluate brain network connectivity, and a subset of the Brief Psychiatric Rating Scale (BPRS; [Reference Ventura, Lukoff, Nuechterlein, Liberman, Green and Shaner40]) to assess symptom severity. Our specific aims were: 1) to determine whether ACC glutamate and GABA levels are associated with ACC functional connectivity in patients with SSDs and healthy controls; and 2) to examine whether such neurotransmitter-connectivity relationships are linked to symptomatic burden.
Methods and materials
Participants
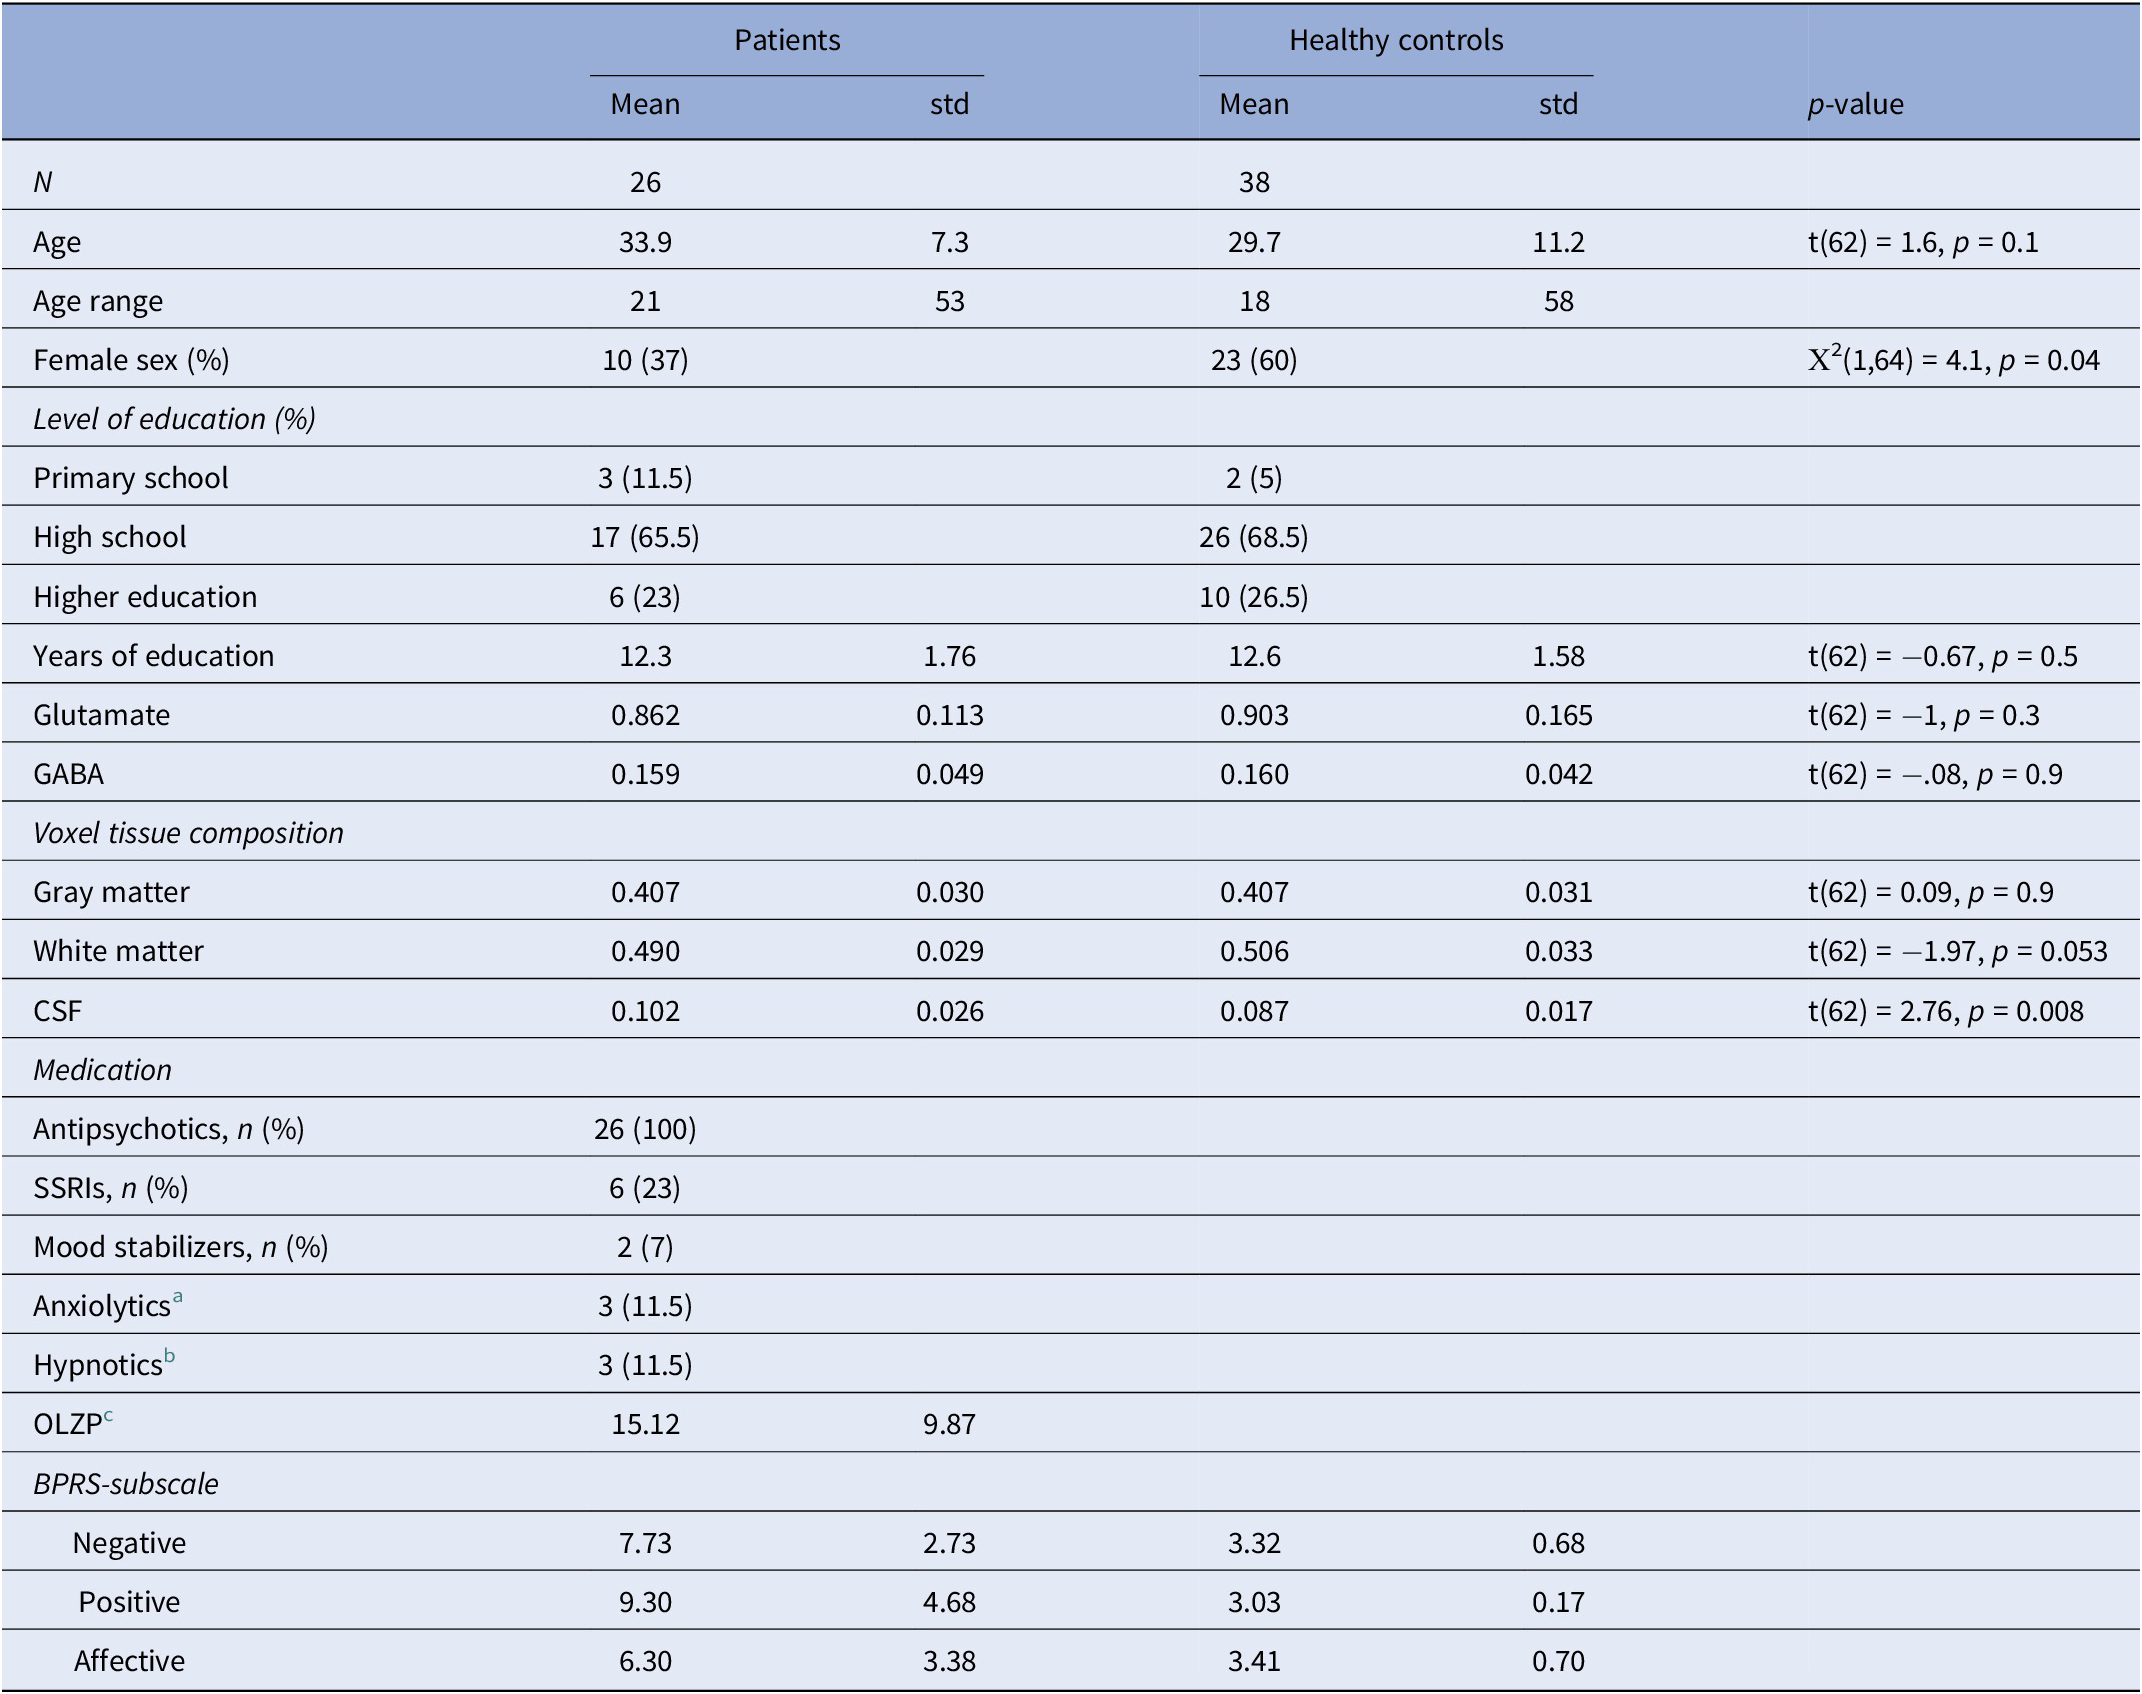
The data used in this study originates from two projects carried out at the psychiatric clinic at Uppsala University Hospital: the Supplementary Motor Area Targeted Magnetic Stimulation Against Auditory Verbal Hallucinations study (AVH-SMA; registered as NCT04651621) which investigated repeated transcranial magnetic stimulation (TMS) targeting auditory verbal hallucinations, and the Magnetic Stimulation of the Brain in Schizophrenia or Depression study (MA-SCH-DEP; NCT02905604) which examined the effects of magnetic stimulation in patients with SSDs and depression. Clinical participants were referred from their outpatient clinics with a diagnosis of schizophrenia spectrum disorders verified through a Mini International Neuropsychiatric Interview (M.I.N.I.) Swedish translation of version 6.0 [Reference Sheehan, Lecrubier, Sheehan, Amorim, Janavs and Weiller41]. All patients met the criteria for schizophrenia spectrum disorder (ICD-10 code F20-F29) and were mainly diagnosed with schizophrenia, except 1 with psychotic depression, who was excluded from the present study. For the AVH-SMA study, the presence of hallucinations was required for inclusion in the study, whereas the inclusion criterion was negative symptoms with anhedonia and avolition (≤40 points on the Motivation and Pleasure Scale-Self-Report [Reference Llerena, Park, McCarthy, Couture, Bennett and Blanchard42]) for the MA-SCH-DEP dataset. However, only patients with SSDs were included in the present study (ICD-10 code F20-F29; see Supplementary Material S1). By combining these groups, the final sample captures a broad clinical spectrum of SSD. Healthy participants were recruited via advertisement and structured clinical interviews were conducted to confirm the absence of current or previous psychiatric disorder. Exclusion criteria for all our participants were neurological disorders, contraindications to MRI/TMS, unstable medication regimens, substance or alcohol use disorder, daily benzodiazepine use, or other factors that make the participant unlikely to be able to complete the study. Alcohol and substance abuse were screened using AUDIT and DUDIT. The study sample consisted of 95 participants, including 60 healthy controls and 35 patients. Of these, 13 HC and 5 patients were missing fMRI data due to scanner error; 8 HC and 2 patients did not pass quality control of rs-fMRI data (see data processing further down); and 1 HC and 2 patients were missing MRS data. Thus, the sample for group-level connectivity analyses included 67 participants (39 HC and 28 patients), whereas analyses involving MRS data included 64 participants (38 HC and 26 patients). The sample characteristics are reported in Table 1.
Demographic information

Abbreviation: CSF, Cerebrospinal fluid.
a Non-benzodiazepine.
b Z-drugs.
c Calculated dose equivalent of olanzapine.
Symptom rating
The BPRS-E is a widely used clinical interview tool used to assess the severity of psychiatric symptoms ranging from psychotic to affective symptoms. It combines patient reports with clinician observations during the interview, with each item rated on a seven-point scale, where a score of 1 indicates absence of a symptom and 7 indicates extreme severity. In the present study, we formulated the positive (suspiciousness {9}, hallucinations {10}, & unusual thought content {11}), negative (blunted affect {16}, emotional withdrawal {17}, & motor retardation {18}), and the affective symptom (depression {3}, suicidality {4}, & guilt {5}) factors based on the most recent and rigorous confirmatory factor analysis study on the BPRS-E [Reference Shafer, Dazzi and Ventura43].
Neuroimaging data acquisition
Participants underwent anatomical and functional MRI together with 1H-MRS on a Philips Achieva dStream 3T scanner equipped with a 32-channel phased-array head coil at Uppsala University Hospital.
Structural MRI
T1-weighted images were acquired using a 3D gradient echo sequence with the following parameters: TR = 8.18 ms, TE = 3.75 ms, flip angle 8°, 220 axial slices, 1 mm isotropic voxels, and an axial field of view of 256 × 256 mm.
Functional MRI
The functional images were acquired using a T2*-weighted echo-planar imaging (EPI) sequence with 32 axial slices, voxel size 3 × 3 × 3.9 mm3, TR = 2000 ms, TE = 30 ms, flip angle = 90°, and FOV = 192 × 192 × 125 mm.
Spectroscopy
Spectroscopy data were acquired using the J-difference Mescher-Garwood spectral editing sequence (MEGA-PRESS; [Reference Mescher, Merkle, Kirsch, Garwood and Gruetter44]). MEGA-PRESS was developed for the quantification of GABA, but can also give reliable estimates of glutamate using the OFF spectra [Reference Maddock, Caton and Ragland45]. The following parameters were used: TR/TE = 2000/68 ms, spectral bandwidth 2000 Hz, 1024 points, and phase cycling 4. For each condition (ON and OFF), 160 averages were obtained. Data were gathered in groups of 40, each starting with an unsuppressed water line, followed by four consecutive pairs of water-suppressed transients in the ON and OFF conditions. The water line positions were used for magnetic field drift correction and to update the carrier frequency of radiofrequency pulses for each group.
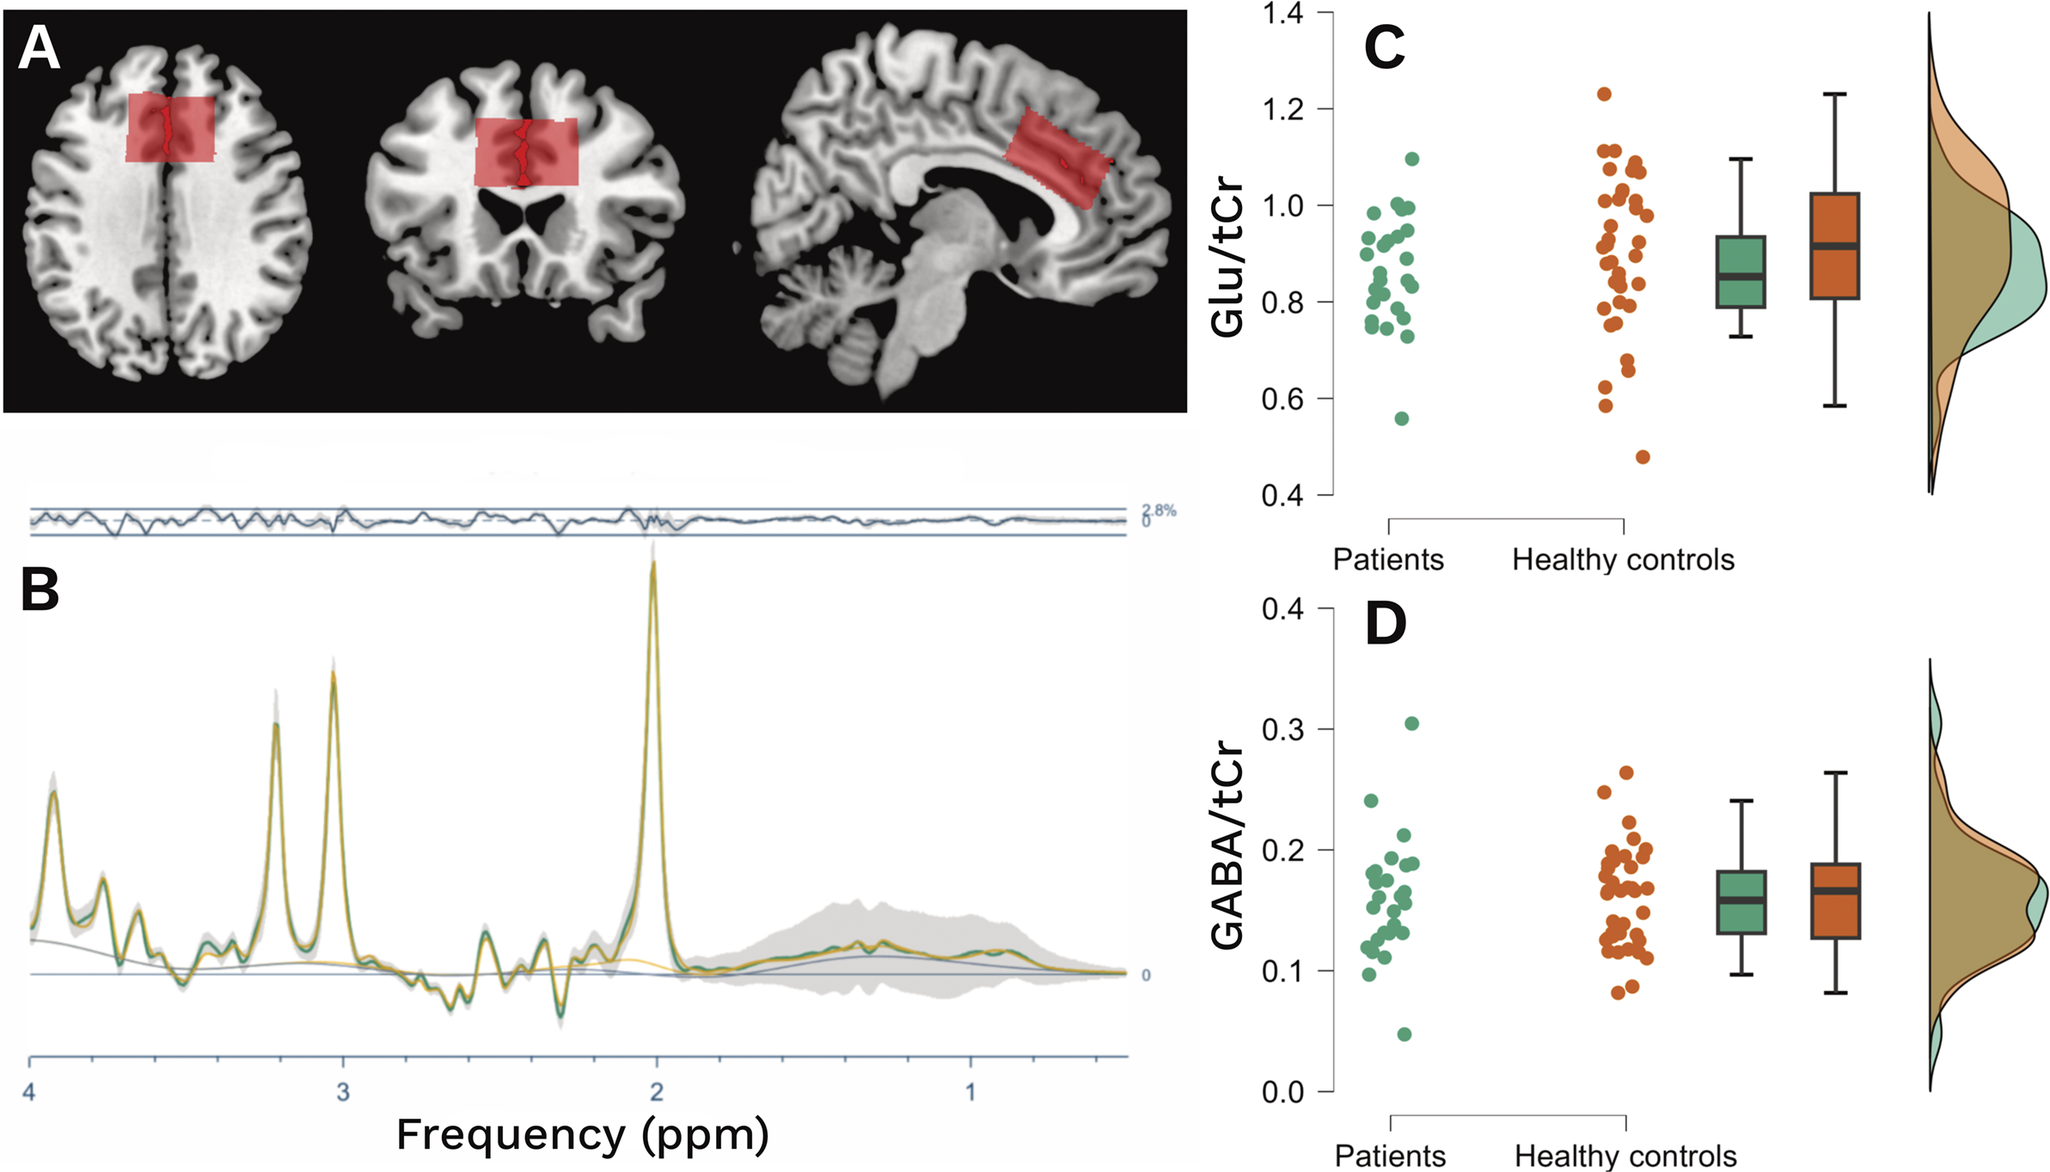
A voxel measuring 40 × 40 × 20 mm (left–right × anterior–posterior × feet–head) was placed along the bilateral cingulate gyrus, with its inferior border aligned to the superior margin of the corpus callosum and its anterior edge positioned at the most anterior point of the corpus callosal genu (Figure 1A).
(A) Voxel position of tCr along the cingulate gyrus. (B) Mean OFF spectra (green) with standard deviation (gray), mean residual (above), and mean fit (yellow) from the baseline acquisitions. (C), (D) Comparison of glutamate and GABA levels between patients and healthy controls.

Data processing
Pre-processing of functional data using fMRI prep and CONN toolbox
Here, brief descriptions of the processing steps are given. Full descriptions can be found in the Supplementary Material S2. Pre-processing of the fMRI data was performed through fMRI prep [Reference Esteban, Ciric, Finc, Blair, Markiewicz and Moodie46, Reference Esteban, Markiewicz, Blair, Moodie, Isik and Erramuzpe47]. Then, the fMRI data were loaded into the CONN toolbox (v.22a [Reference Whitfield-Gabrieli and Nieto-Castanon48]) for final steps of processing (spatial smoothing with a Gaussian kernel of 8 mm full width half maximum (FWHM)) and analyses. Additionally, the data were denoised using component-based correction in order to reduce potential confounding effects characterized by white matter time series (5 noise components reflecting respiration), CSF time series (5 noise components reflecting cardiac activity), motion parameters and their first order derivatives (12 regressors), outlier scans (fewer than 192 factors), session and task effects and their first-order derivatives (2 factors), and linear trends (2 factors) within each functional run, followed by bandpass frequency filtering of the BOLD timeseries between 0.008 Hz and 0.09 Hz. The effective degrees of freedom of the BOLD signal after denoising ranged from 0 to 59 (average 40.9) across all subjects. Individuals were excluded if less than 125 frames remained after scrubbing [Reference Power, Barnes, Snyder, Schlaggar and Petersen49].
Spectroscopy pre-processing using Osprey
The 1H-MRS data were analyzed in Matlab R2022b using Osprey (v. 2.5.0), an all-in-one software suite for state-of-the-art processing and quantitative analysis of in-vivo MRS data [Reference Oeltzschner, Zöllner, Hui, Mikkelsen, Saleh and Tapper50]. Raw data imported into Osprey underwent eddy-current correction, frequency- and phase-alignment, residual water removal, frequency referencing, and initial phasing for post-processing with the OspreyProcess module. MRS voxel parameters (size, location, and orientation) were utilized to construct a binary voxel mask, which was then co-registered to the T1 anatomical image via Osprey’s ‘Coreg’ module, facilitating spatially accurate alignment of spectroscopic and structural data. The post-processed spectral data were then fitted with a linear combination of the default model spectra package within the range of <4;0.5 > ppm, and knot spacing (digital resolution) of 0.55 ppm [Reference Zöllner, Tapper, Hui, Barker, Edden and Oeltzschner51].
The difference (ON–OFF) and OFF spectra were used for GABA and Glu quantification (Figure 1B), respectively. The levels were estimated as the spectral intensity ratio of GABA and Glu using alpha-corrected total creatin (tCr) as the reference [Reference Mikkelsen, Barker, Bhattacharyya, Brix, Buur and Cecil52]. Quality metrics for the MRS signal were determined by calculating the average signal-to-noise ratio (SNR) and the mean linewidth of creatine. Relative residuals were calculated by comparing the amplitude of the residuals to the standard deviation (SD) of the noise, serving as an indicator of the goodness of fit. Given the report of differences in creatine between patients and healthy controls in psychosis studies [Reference Tibbo, Bernier, Hanstock, Seres, Lakusta and Purdon53], we performed a validation analysis of tCr as a stable internal reference (Supplementary Material R1).
Statistical methods
General analyses
Descriptive data were tabulated, and group differences were analyzed using an independent-samples t-test or Mann–Whitney for non-normal data, and the Chi2 test for categorical data. Associations between estimated Glu and GABA levels, and between connectivity and symptom ratings were assessed using Spearman’s rho. Unless specified otherwise, tests were two-tailed with an alpha level of 0.05. The analyses were performed using JASP 0.18.1 [Reference Love, Selker, Marsman, Jamil, Dropmann and Verhagen54].
Functional connectivity analyses
The analyses were run in CONN Toolbox and statistical significance was set at p < 0.001 at the voxel-level and p < 0.05 with FDR correction at the cluster-level, unless otherwise specified. First-level analysis was done to estimate seed-based connectivity maps characterizing the patterns of functional connectivity with 164 HPC-ICA networks and Harvard-Oxford atlas ROIs [Reference Nieto-Castanon and Whitfield-Gabrieli55]. Functional connectivity strength was represented by Fisher-transformed bivariate correlation coefficients from a weighted general linear model (weighted-GLM [Reference Nieto-Castanon and Whitfield-Gabrieli55]), defined separately for each pair of seed and target areas, modeling the association between their BOLD signal time series.
Group level connectivity
Group-level analyses were performed using a General Linear Model for each voxel with first-level connectivity measures at this voxel as dependent variable and groups or other subject-level identifiers as independent variables. Cluster-level inferences were based on parametric statistics from Gaussian Random Field theory. Results were thresholded using a combination of a cluster-forming voxel-level threshold of p < 0.001 and a False Discovery Rate (FDR)-corrected cluster-size threshold of p < 0.05.
Seed-based connectivity
To test our hypotheses of the involvement of glutamate and GABA, we used seed-based voxel-level functional connectivity analyses (SBA) with a bilateral dACC seed to investigate the connectivity to the rest of the brain. To this end, the level of the respective neurotransmitter was added as a covariate in the SBA. The averaged connectivity from the SBA was extracted and correlated with each symptom domain using Spearman’s rank correlation. Given the small sample size, we conducted bootstrapping analyses to confirm the stability of associations and to avoid interpretation of spurious findings. The bootstrapping analyses were based on 10,000 samples and reported bias-corrected 95% confidence intervals (CIs) of parameter estimates for the correlation coefficients. P-values were adjusted for multiple testing using the Holm–Bonferroni method for controlling the Family-Wise Error Rate (FWER) with an alpha level of 0.05.
Sensitivity analyses
We performed sensitivity analyses to control for the possible influence of medication. To this end, a dose equivalent to olanzapine was calculated according to the mean dose method by Leucht et al. [Reference Leucht, Samara, Heres, Patel, Furukawa and Cipriani56] and included in the models as a covariate. Furthermore, we also performed a sensitivity analysis by including years of education as a covariate.
Results
Demographics and spectral quality
There was a statistically significant difference in sex distribution between patients and controls, (p = 0.042). All acquired spectra were of good quality. The mean creatine SNR was 218 (SD: 37), and the FWHM was 6.2 Hz (SD: 0.95), both of which were acceptable [Reference Wilson, Andronesi, Barker, Bartha, Bizzi and Bolan57]. The mean relative amplitude residuals were 17.7 (SD: 7.1) for the OFF spectra and 13.7 (SD: 6.1) for the DIFF spectra. Levene’s test for equality of variances confirmed that there were no significant differences in the distribution of metabolite levels between patients and controls for glutamate (p = 0.069) or GABA (p = 0.85), indicating comparable data variability across groups. However, we did not observe any differences in either glutamate or GABA levels within the ACC between patients and controls (see Table 1, Figure 1C,D). Voxel tissue composition analysis revealed no significant group differences in fraction of gray matter (fGM, p = 0.9). In contrast, patients exhibited a significantly higher fraction of cerebrospinal fluid (fCSF, p = 0.008) and a lower fraction of white matter (fWM, p = 0.053) compared to controls. Consequently, group differences in glutamate and GABA levels were tested using ANCOVAs with fWM and fCSF as covariates. These analyses showed no significant main effect of group for either glutamate (F(1,60) = 1.787, p = 0.18, η2 = 0.024) nor GABA (F(1,60) = 0.347, p = 0.5, η2 = 0.006).
Functional connectivity
Group differences in dACC connectivity
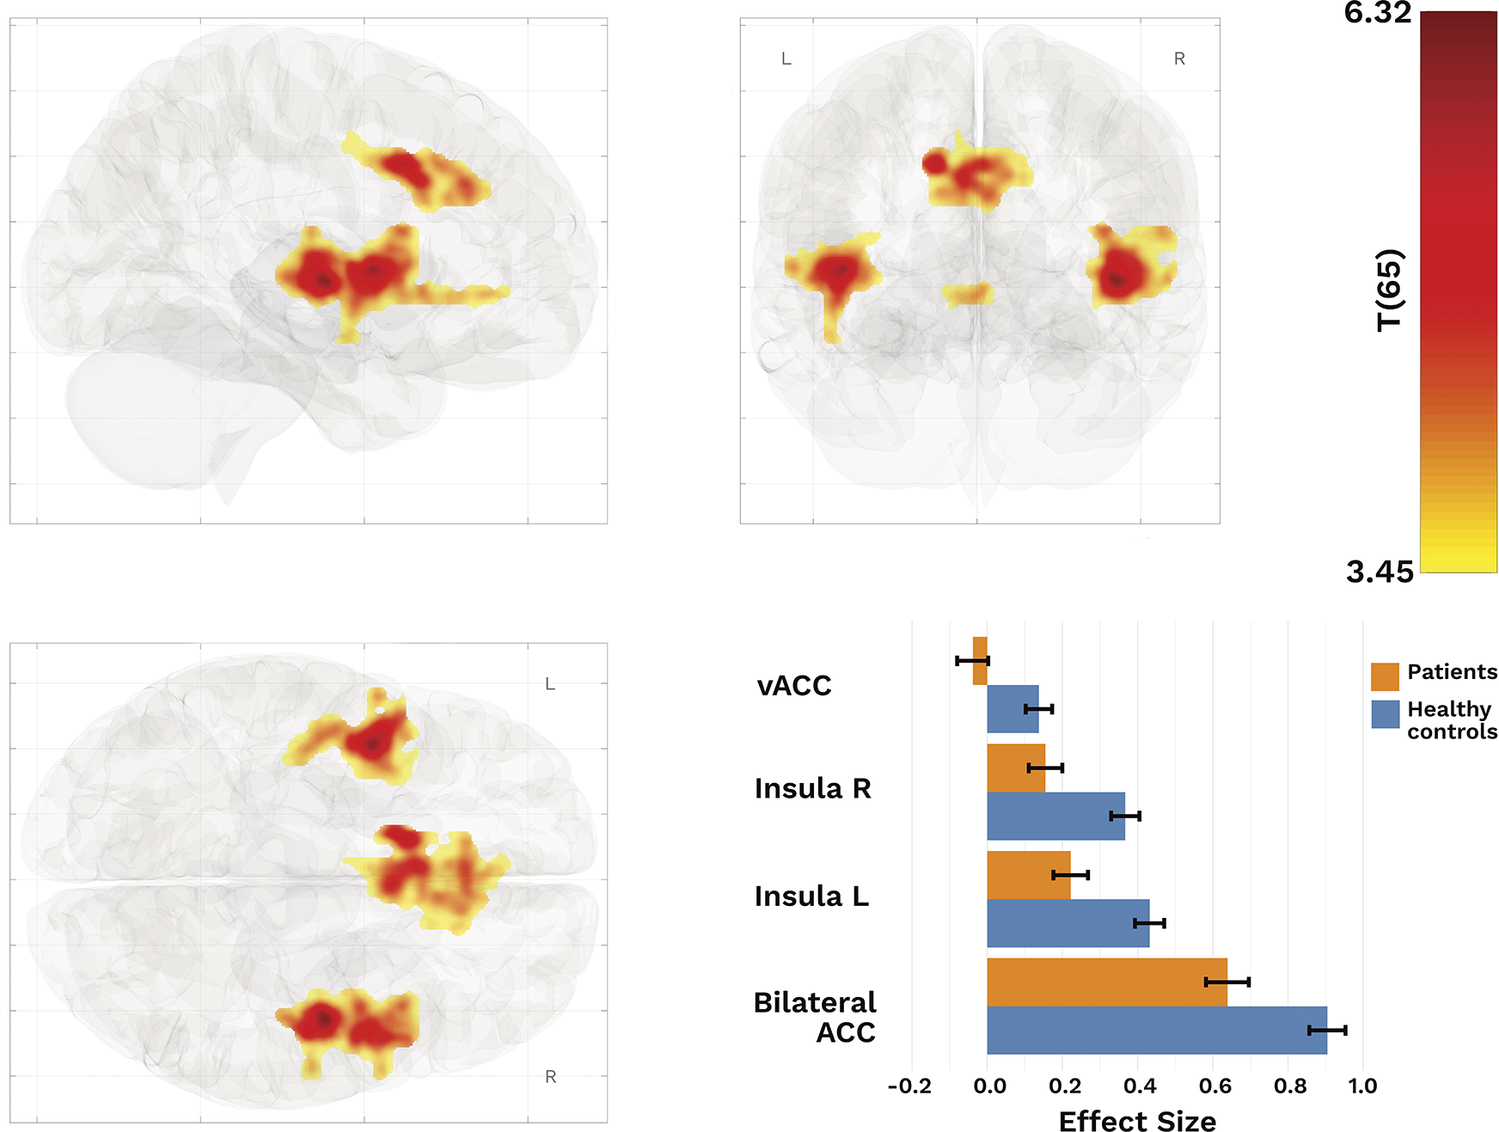
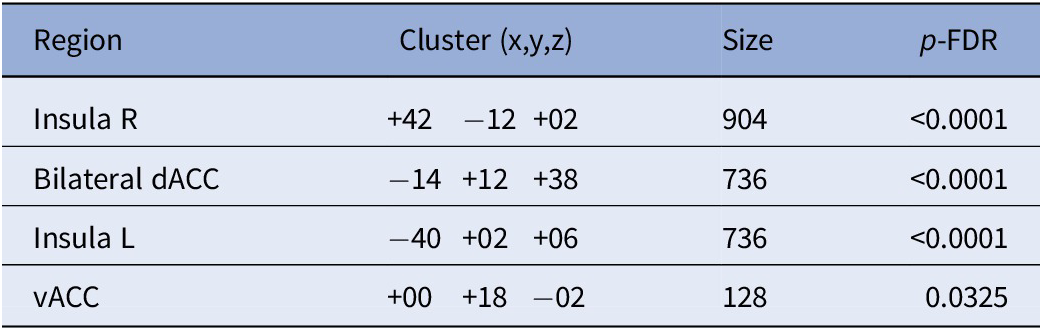
Our SBA revealed significantly lower connectivity between the dACC and right insula, left insula, and bilateral ACC (T(65) > 3.45, k ≥ 128) in patients than in HCs (Figure 2; Table 2).
Resulting clusters from SBA with dACC as seed. Top row and bottom left: Regions with reduced functional connectivity between core salience processing regions in patients. Bottom right: Effect sizes of clusters displaying differences between patients and healthy controls.

Resulting cluster from seed-based analysis using dACC as seed and HC > patients

Abbreviation: vACC, subgenual–anterior cingulate cluster.
dACC-connectivity related to glutamate but not GABA
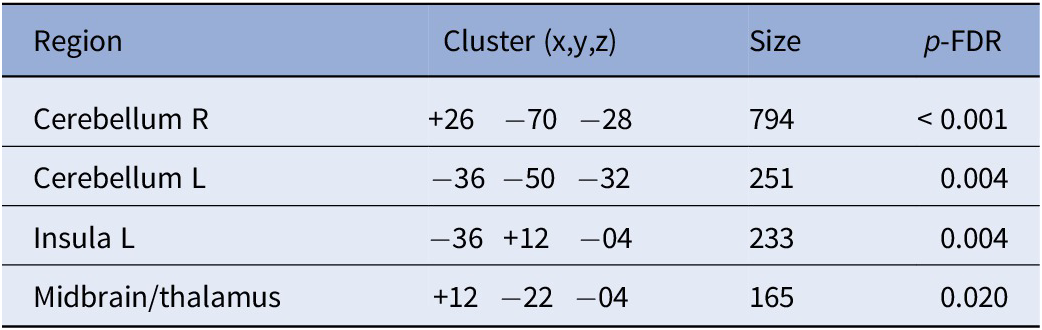
Based on our SBA, we found several clusters where dACC connectivity was related to glutamate level across the sample. Specifically, higher glutamate levels in the dACC were associated with greater connectivity with the cerebellum, left insula, and the thalamus (T(62) > 3.43, k ≥ 165; see Table 3 and Figure 3). In contrast, we found no such associations for GABA in the dACC.
Cluster with glutamate-related connectivity

Top: Clusters with glutamate-related connectivity (see Table 3 for coordinates and regions). Bottom: Plots illustrating the associations between average glutamate-related connectivity and different subscales of symptom burden. Reported P-values are FWER-corrected.

Averaged glutamate-related connectivity and symptom ratings
We found that greater glutamate-associated connectivity was significantly related to higher levels of positive symptoms (ρ = 0.480, pFWER = 0.039; BS 95% CI: 0.13/0.72), but not to negative (ρ = −0.17, pFWER = 0.58; BS 95% CI: −0.48/0.17), or affective symptoms (ρ = −0.21, pFWER = 0.58; BS 95% CI: −0.57/0.18; Figures 3A-C).
Sensitivity analyses
Sensitivity analyses controlling for medication use yielded attenuated results for the group differences in ACC connectivity, with loss of significance for the bilateral clusters in insula and ventral ACC, suggesting that medication may have contributed to the observed effects (Supplementary Material T1). However, the glutamate-related connectivity remained significant (Supplementary Material T1) and the association to positive symptoms also remained significant (ρ = 0.472, pFWER = 0.017; BS 95% CI: 0.13/0.72). Furthermore, the group differences in bilateral insula remained significant after controlling for education, but the effects in dACC and vACC were attenuated (Supplementary Material T2).
Discussion
The current study investigated the contributions of glutamate and GABA levels in dACC on resting-state activity among individuals with schizophrenia-spectrum disorders. Our results add to the literature on altered resting-state functional connectivity in the salience network in SSD. The findings further suggest that glutamate-related connectivity may be specifically related to negative symptoms among patients.
Glutamatergic and GABAergic alterations have long been implicated in the pathophysiology of schizophrenia-spectrum disorders [Reference Goff and Coyle22, Reference Hu, MacDonald, Elswick and Sweet58]. In the present study, we found no significant differences in Glu/tCr or GABA/tCr levels in the dACC between patients and healthy controls. This lack of a difference between our two groups in this particular region is aligned with a growing body of literature emphasizing the heterogeneity of neurochemical alterations across patient subgroups and brain regions (see [Reference Merritt, Egerton, Kempton, Taylor and McGuire24, Reference Egerton, Modinos, Ferrera and McGuire59, Reference Marsman, Van Den Heuvel, Klomp, Kahn, Luijten and Hulshoff Pol60] for reviews and meta-analyses). There is moderate evidence that early stages of illness show more robust glutamate or GABA abnormalities in ACC compared with controls, whereas the differences are less consistent in chronic stages [Reference Merritt, Egerton, Kempton, Taylor and McGuire24, Reference Kumar, Vajawat and Rao61] – such as our patient sample. Moreover, methodological differences such as voxel placement, field strength, and spectral modeling may contribute to variability across studies. In addition, the small sample sizes in most previous studies examining GABA and glutamate levels (typically between 10 and 40 participants) may have limited statistical power and contributed to the inconsistent findings [Reference Merritt, Egerton, Kempton, Taylor and McGuire24, Reference Shukla, Wijtenburg, Chen, Chiappelli, Kochunov and Hong38, Reference Marsman, Van Den Heuvel, Klomp, Kahn, Luijten and Hulshoff Pol60]. Importantly, Nakahara et al. [Reference Nakahara, Tsugawa, Noda, Ueno, Honda and Kinjo26] highlighted that inconsistent findings of glutamate and GABA levels in patients compared to controls may reflect whether ACC or midcingulate cortex (MCC) was investigated. Reports showing group differences in MCC but not in ACC underscore the importance of precise voxel placement and separate analyses of these adjacent regions.
In the present study, we found that patients with SSDs exhibited significantly reduced resting-state functional connectivity within core regions of the salience network compared to healthy controls, as revealed by seed-based connectivity analysis. Our findings are consistent with previous studies emphasizing aberrant salience network integrity in schizophrenia [Reference Li, Wang, Xiong, Bo, He and Li62–Reference White, Joseph, Francis and Liddle64]. The observed hypoconnectivity supports the hypothesis of SN dysfunction as a network-level phenotype in schizophrenia and may reflect an impaired ability to efficiently identify and respond to salient information in the context of a network switching mechanism. Given the suggested role of SN as a switch between activation/deactivation of DMN and CEN [Reference Goulden, Khusnulina, Davis, Bracewell, Bokde and McNulty15, Reference Sridharan, Levitin and Menon16], the hypoconnectivity could thus lead to inefficient allocation of attentional resources, possibly explaining some of the symptoms observed in schizophrenia [Reference Palaniyappan, Simmonite, White, Liddle and Liddle65]. The attenuation of connectivity differences after adjusting for antipsychotic dose suggests that medication exposure may partially account for the observed group-level effects. However, because antipsychotic exposure is intrinsically linked to illness severity and duration, it likely functions as a confounder, being associated with both diagnostic status and functional connectivity patterns. Prior research indicates that antipsychotic medication attenuates group differences in glutamate and GABA levels measured with MRS [Reference de la Fuente-Sandoval, León-Ortiz, Azcárraga, Stephano, Favila and Díaz-Galvis66, Reference Girgis, de la Fuente-Sandoval, Lewis-Fernández, Reyes-Madrigal, Wall and Hua67], which may in turn exert downstream effects on functional connectivity. Still, several clusters remained significant after controlling for medication dose, suggesting that while medication contributes to the observed dysconnectivity pattern, some alterations may represent core, medication-independent features of SSDs.
With regard to the possible underlying mechanisms, we found that ACC connectivity with cerebellar, thalamic, and insular regions was positively associated with glutamate levels within the dACC. This observation of glutamate-related increased activity across groups is consistent with the role of glutamate in generating neural oscillations and, therefore, the hemodynamic response detected with rs-fmri [Reference Uhlhaas and Singer27–Reference Schirner, McIntosh, Jirsa, Deco and Ritter29]. The absence of this association within the patient group is in line with previous research [Reference Shukla, Wijtenburg, Chen, Chiappelli, Kochunov and Hong38] and may reflect abnormal glutamatergic modulation of resting-state brain activity, stemming from alterations in the glutamatergic system in schizophrenia [Reference Hu, MacDonald, Elswick and Sweet58, Reference Wijtenburg, Yang, Fischer and Rowland68]. Similar patterns have been observed in previous studies where ACC glutamate and rs-connectivity relationships observed in controls appeared either weaker or absent in patients with SSDs [Reference Maximo, Briend, Armstrong, Kraguljac and Lahti36, Reference McCutcheon, Pillinger, Rogdaki, Bustillo and Howes69].
Higher glutamate-dependent connectivity was associated with greater severity of the positive symptoms on the BPRS. Beyond our cluster in the right insula, our averaged connectivity also included clusters in the cerebellum and thalamus – two regions involved in the Cerebello-Thalamo-Cortical (CTC) circuit [Reference Faris, Pischedda, Palesi and D’Angelo70–Reference Csukly, Szabó, Polgár, Farkas, Gyebnár and Kozák72]. While dysregulated activity within the SN leads to aberrant salience ascription [Reference Manoliu, Riedl, Zherdin, Mühlau, Schwerthöffer and Scherr63, Reference Jafri, Pearlson, Stevens and Calhoun73], our finding of glutamate-dependent signaling within the SN may contribute to positive symptoms through aberrant connectivity with regions involved in the CTC circuit [Reference Csukly, Szabó, Polgár, Farkas, Gyebnár and Kozák72, Reference Lui, Deng, Huang, Jiang, Ma and Chen74, Reference Wei, Wang, Xue, Niu, Ma and Han75]. Thus, our results are in line with previous work highlighting the disruption of large-scale functional networks that may underlie positive symptoms in SSDs.
The results of this study need to be interpreted in light of its limitations. First, the findings need to be interpreted within the context of a sample with long-term illness, as neurochemical alterations observed in early or untreated psychosis may differ from those observed in later stages of illness (apart from the effect of antipsychotic medication). Furthermore, the sample size may be too small to reliably detect differences in neurotransmitter levels with MRS in both groups. Nevertheless, a strength of our final sample is that it captures a broad clinical spectrum of the SSDs rather than a single symptom domain. Second, we chose to quantify glutamate from difference spectra rather than Glx, as recent validation studies have shown that glutamate measurements from the MEGA-PRESS OFF spectrum correspond closely to those from conventional PRESS scans [Reference Maddock, Caton and Ragland45, Reference Thomson, Hollestein, Goodwin, Fritz, Oakley and Murphy76]. Third, our sample was not antipsychotic-naïve, introducing a potential confound. Antipsychotic exposure and dosage are closely linked to both diagnostic status and neural activity measures, making it difficult to disentangle illness-related effects from those attributable to medication. Moreover, medication use may attenuate group differences, potentially obscuring the full magnitude of illness-related effects.
In conclusion, the present study explored the neurochemical underpinnings of resting-state functional connectivity within the salience network in patients with schizophrenia-spectrum disorders, focusing on the contributions of glutamate and GABA. Together, these findings support the hypothesis that disrupted glutamatergic modulation of large-scale brain networks contributes to the emergence of core clinical features in schizophrenia. Clarifying these neurochemical-connectivity relationships may ultimately help identify new targets for intervention aimed at positive symptoms in psychosis.
Supplementary material
The supplementary material for this article can be found at http://doi.org/10.1192/j.eurpsy.2026.12212.
Data availability statement
Due to ethical and legal constraints, data are not publicly available. Further information can be obtained from the corresponding author.
Acknowledgements
We would like to thank the staff at psychiatric clinic at Uppsala University Hospital for their assistance in conducting the projects. The data handling was enabled by resources in project 2019025 provided by the National Academic Infrastructure for Supercomputing in Sweden (NAISS) at UPPMAX, partially funded by the Swedish Research Council through grant agreement no. 2022-06725.
Author contribution
Conceptualization: J.M., S.C., L.S., J.W., R.B., J.P.; Data Curation: J.M., L.S., J.W., J.P.; Investigation: J.M., J.P.; Formal Analysis: J.M., J.P.; Funding Acquisition: S.C., R.B.; Project Administration: S.C., R.B., J.P.; Writing – Original Draft: J.M.; Writing – Reviewing and Editing: S.C., L.S., J.W., R.B., J.P.
Financial support
This study was supported by unrestricted grants from the Swedish Research Council (grant number 2016–02362) and the Swedish Brain Foundation.
Competing interests
The authors declare that they have no known competing financial interests or personal relationships that could have appeared to influence the work reported in this paper.


 Open access
Comments
No Comments have been published for this article.