


INTRODUCTION
Human respiratory syncytial virus (HRSV) infection results in considerable morbidity, including severe bronchiolitis and pneumonia, especially in infants aged <1 year [Reference Borchers1]. One report estimated that HRSV was associated with 66 000– 199 000 deaths worldwide in young children in 2005 [Reference Nair2]. The incubation period of the virus is 3–5 days after infection through the upper respiratory tract [Reference Simoes3]. HRSV cases occur in early winter in temperate zones, like those in Japan [Reference Tang and Loh4]. However, in subtropical zones, like Okinawa Island, cases appear throughout the year, but HRSV cases occur mainly during the rainy season [Reference Tang and Loh4, Reference Haynes5]. This seasonality in annual HRSV occurrence might be related to meteorological factors [Reference Tang and Loh4–Reference Chen16].
In recent years, early HRSV cases were reported during summer, which is defined as June–August in mainland, Japan [Reference Matsunaga17]. However, no study has clearly identified the meteorological conditions necessary for occurrence of summer HRSV cases in Japan. An understanding of these conditions might help in predicting such cases. This is critically important, especially for young infants with underlying diseases such as congenital cardiopulmonary disease, as it would allow timely prophylaxis with the anti-RSV monoclonal antibody drug palivizumab [Reference Gutfraind, Galvani and Meyers18]. The American Academy of Pediatrics recommends that timing of prophylaxis administration should be determined on the basis of HRSV epidemiology, especially in regions remote from the United States mainland, such as Alaska [19]. The epidemiological characteristics of HRSV might differ in such geographically distant areas, because of variation in meteorological conditions. Similarly, in Japan, the epidemiological trends for HRSV are obviously different in geographically distant areas like Okinawa Island, which is ~800 km south of mainland Japan. In both Okinawa Island and parts of the southwest Japanese mainland, the epidemiological characteristics of summer appear to differ from those in eastern areas, because of differences in climate conditions. However, it is generally believed that HRSV cases occur only in autumn to winter in temperate zones. Nevertheless, it is important to understand that HRSV cases can occur in summer, even in temperate zones, and to identify associations between meteorological conditions and such summer occurrences.
The aims of this study were to explore the seasonality of reported HRSV cases in Japan, to explore the seasonality of reported HRSV cases by climate region in Japan, and to examine the association between reported HRSV cases and meteorological variables in the summer season in Japan.
METHODS
Data sources
We analysed HRSV surveillance and meteorological data for the period 2007–2014, which were obtained from the Infectious Diseases Weekly Report of Japan [20]. The data were collected as part of the National Infectious Disease Surveillance, which is administered by the Ministry of Health, Welfare, and Labour in Japan. HRSV has been a notifiable disease under Japan's Infectious Disease Control Law since 1998. A case is defined as laboratory detection of HRSV, i.e. a positive result from a rapid diagnostic kit or neutralization reaction using serum samples. In recent years, commercial rapid diagnostic test kits have become available in general clinical settings. About 3000 sentinel paediatric clinics and hospitals throughout Japan must report the numbers of patients with HRSV every week. The number of sentinels assigned to each public health service area is determined on the basis of population size: a public health centre with <30 000 individuals has one sentinel, a centre with 30 000–75 000 individuals has two sentinels, and one with >75 000 individuals has ⩾3 sentinels, as determined by the following formula: 3 + (population – 75 000)/50 000. Clinical data from each sentinel are forwarded to public health centres (~500), where the generated data are then electronically reported to about 60 prefectural or municipal governments and, finally, to the Infectious Disease Surveillance Centre at the National Institute of Infectious Diseases (Tokyo), which is administered by the Ministry of Health, Labour and Welfare. The number of sentinels slightly varied by season as follows: 3018 in 2007–2008, 3027 in 2008–2009, 3024 in 2009–2010, 3038 in 2010–2011, 3140 in 2011–2012, 3156 in 2012–2013, and 3153 in 2013–2014. These numbers are calculated in the 21st week of each season.
Meteorological data were obtained from the climate statistics database published by the Japan Meteorological Agency (http://www.data.jma.go.jp/obd/stats/etrn/index.php). Average daily temperature and average daily relative humidity are published on the website and are derived from data collected at local meteorological stations located in each prefectural capital. We calculated average weekly temperature and relative humidity in each climate region. When there was no station in the prefectural capital (two of 47 prefectures), meteorological data from a nearby station located within 50 km of the capital were used.
Reported cases of HRSV in Japan
The national trend in HRSV occurrence for each season was analysed by using weekly numbers of reported HRSV cases per sentinel throughout Japan. The number of HRSV reported cases, as determined by the Infectious Disease Surveillance Centre, was divided by the number of sentinels (~3000) on a weekly basis because the number of sentinels slightly varied by year. Then, the nationwide trend in reported cases of HRSV was evaluated in the seven seasons included in the study period, from the 2007–2008 season to the 2013–2014 season. One season was defined as the period from week 21 to week 20 in the following year (e.g. from week 21 of 2011 to week 20 of 2012), because the number of reported cases of HRSV starts to increase in autumn and usually remains elevated in the following year. Seasonal-trend decomposition using loess was used to evaluate change in the HRSV occurrence trend. The algorithm was developed to help divide a time-series into three components: the trend, seasonality, and remainder [Reference Cleveland21]. The obtained trend component was used to assess change in reported HRSV cases over time between 2007 and 2014.
HRSV seasonality by climate region
We used the Sekiguchi climate classification of Japan to divide Japan into 13 regions according to climate similarity. Then, we modified it so that it included the following 11 regions [Reference Sekiguchi22] (Fig. 1): (a) Japan Sea, Hokkaido; (b) Japan Sea, Tohoku; (c) Japan Sea, Hokuriku; (d) Japan Sea, San-in; (e) Kyushu; (f) Nankai; (g) Setouchi; (h) East Japan, Sanriku-Hitachi; (i) East Japan, Tokai-Kanto; (j) East Japan, Chuo-Kogen; and (k) South Japan (Okinawa). All 47 prefectures of Japan are included in this classification. Although the original Sekiguchi climate classification comprises 13 areas, the present classification includes only 11 regions. Although Hokkaido, the largest prefecture in Japan, is subdivided into three climate regions in the original classification; however, we used only one climate region (Japan Sea, Hokkaido) to represent its prefectural capital because we could only obtain an aggregate number of cases from Hokkaido as a whole. To analyse whether reported cases of HRSV were related to climate conditions, we used the Sekiguchi detailed climatic classification, a common method that uses temperature, rainfall, sunshine, and humidity. The Köppen–Geiger climate classification is more common [Reference Kottek23] but is too coarse for our purposes, as it divides Japan into only three or four regions. The average numbers of HRSV reported cases per sentinel in each climate region were calculated weekly. Then, epidemic curves for each season were compared for the 11 climate regions. Seasonal-trend decomposition analysis was also applied to data from each climate region. Change in trend was evaluated in the 11 climate regions.
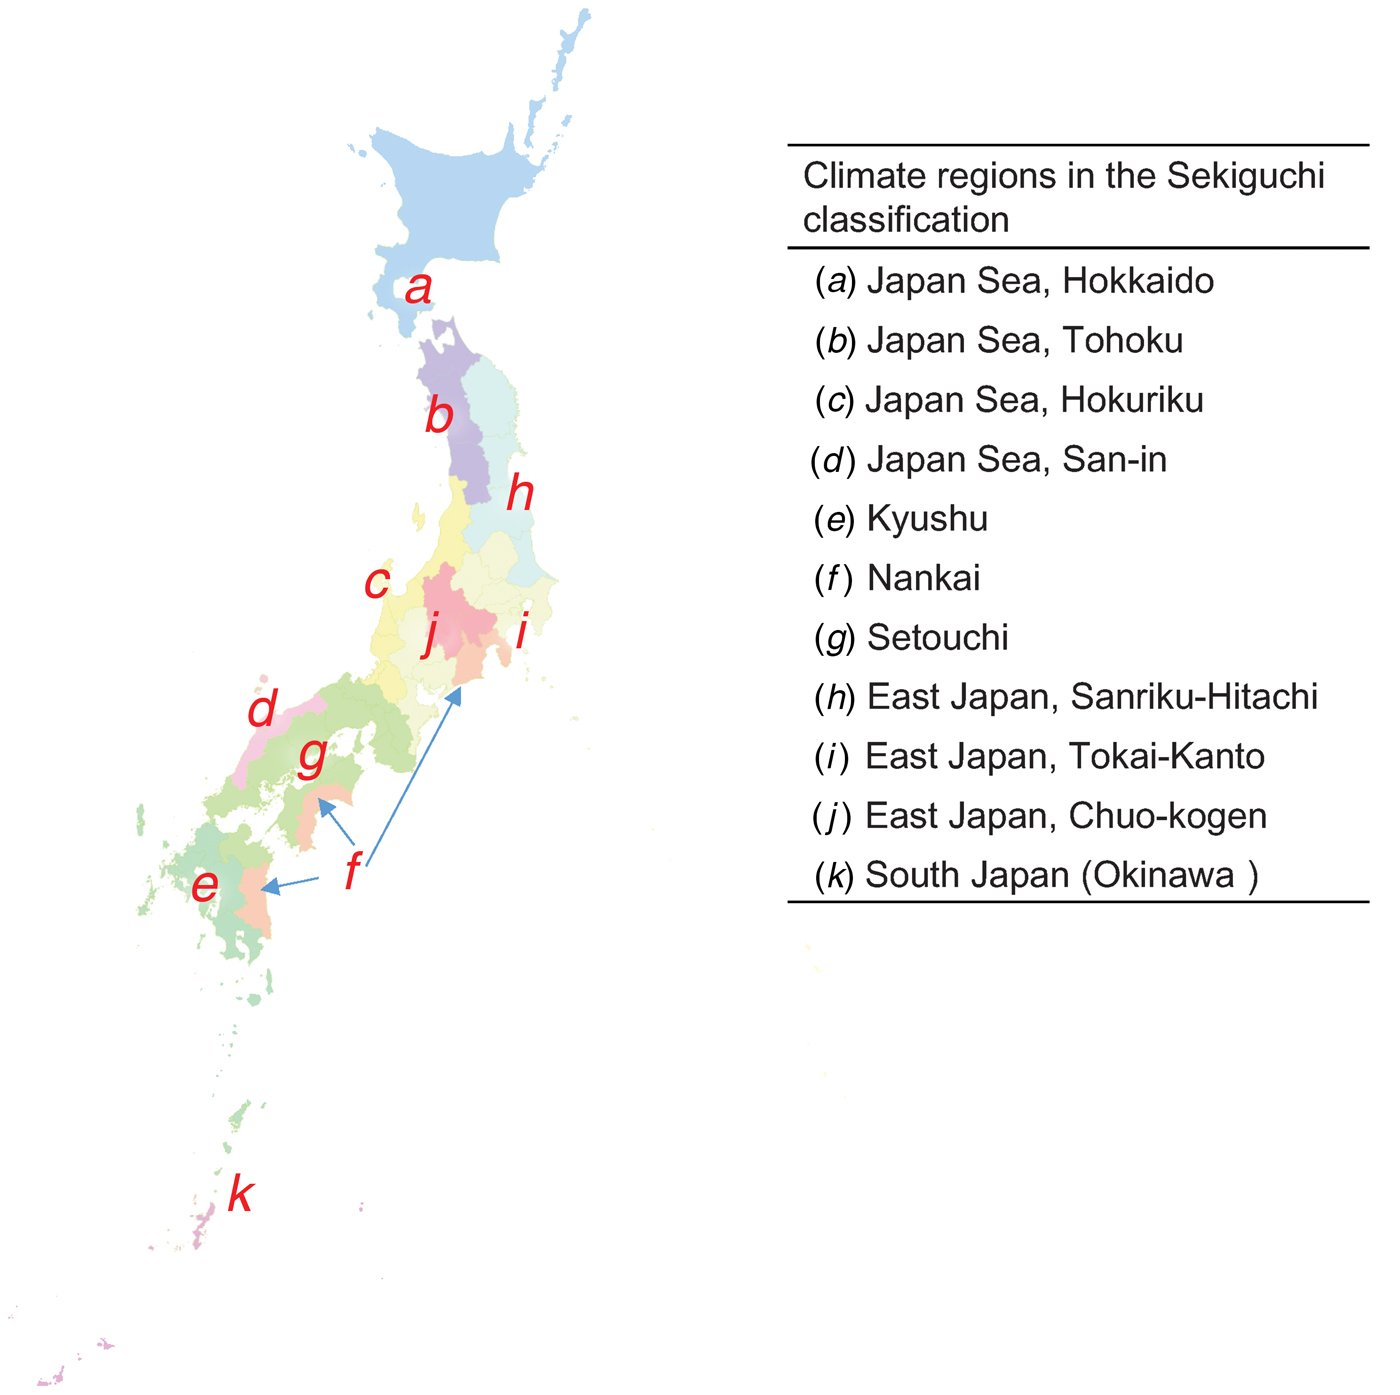
Fig. 1. Climate regions of Japan in the Sekiguchi climate classification. The 11 regions of the Sekiguchi climate classification [Reference Sekiguchi22] are shown.
Associations of meteorological conditions with HRSV occurrence in summer
Focusing on reported cases of HRSV in summer, we constructed a contour plot map [Reference Press24] to visualize the optimal meteorological conditions associated with HRSV occurrence in summer. The plot map shows the meteorological conditions associated with HRSV incidence per sentinel, in all prefectures, during summer for the period between weeks 23 and 35, which corresponds to the June–August period. Weekly average temperature and relative humidity were used as meteorological factors in the analysis.
Using a histogram of the weekly reported cases of HRSV per sentinel (Supplementary Fig. S1), distribution of the reported cases was confirmed. Then, we applied a negative binomial regression model to examine the association between meteorological (temperature and humidity) conditions and HRSV occurrence during the limited summer period between weeks 23 and 35. To fit the model, we used values for weekly reported cases of HRSV multiplied by 1000. The number of HRSV cases/1000 persons per sentinel was used as the dependent variable. Average weekly temperature and relative humidity were classified by quartile because of the absence of linearity between each factor and dependent variable. Temperature was classified into four categories as follows: first quartile, <23·3 °C; second quartile, ⩾23·3 °C and <26·0 °C; third quartile, ⩾26·0 °C and <28·2 °C; and fourth quartile, ⩾28·2 °C. Relative humidity was classified into four categories as follows: first quartile, <69·0%; second quartile, ⩾69·0% and <73·0%; third quartile, ⩾73·0% and <79·0%; and fourth quartile, ⩾79·0%. Then, categorized weekly temperatures and/or relative humidity values were set as explanatory variables in the models. We developed four models, which used meteorological factors to compare and validate negative binomial regression models, as follows: (1) temperature alone, (2) relative humidity alone, (3) both temperature and relative humidity, and (4) temperature, relative humidity, and temperature × relative humidity (interaction term). In all models, the year variable (years 2007, 2008, 2009, 2010, 2011, 2012, and 2013) was used to control seasonal variation. Influential data on outcome variables were checked by using the Cook distance plot. Then, model fit was evaluated by calculating Akaike's Information Criterion (AIC) and Schwarz's Bayesian Information Criterion (BIC). The marginal effects of meteorological conditions were estimated by a model using all the combinations of temperature and relative humidity as the explanatory variable. Then, we determined the temperature and relative humidity conditions associated with HRSV occurrence in summer.
All the statistical analyses were performed with Stata Statistical Software Release 14 (Stata Corp; USA) and R v. 3.3.0 (R Core Team. R Foundation for Statistical Computing, Vienna, Austria).
RESULTS
HRSV case trends: 2007–2008 to 2013–2014
Typically, the number of reported HRSV cases increased in September and peaked in December from 2007–2008 to 2010–2011. In the 2012–2013 and 2013–2014 seasons, however, the reported number of cases substantially increased earlier, at the end of August, and peaked in October. Despite a subsequent decrease, a second peak was observed in December (Fig. 2). During summer, i.e. between June and August (corresponding to weeks 23–35), an early increase in HRSV reports was observed from around week 30 in the 2011–2012, 2012–2013, and 2013–2014 seasons. In the 2009–2010 season, the peak was later (in February) than in the other seasons. In total, 17 155 weeks were evaluated in the study: 365 weeks (the seven seasons from 2007–2008 to 2013–2014) in 47 Japanese prefectures. Seasonal-trend decomposition analysis showed a prominent positive remainder in September and October in 2012 and from September to November in 2013. Irregular remainders were observed from September 2009 to March 2010, a period corresponding to the A(H1N1) influenza pandemic (Fig. 3).
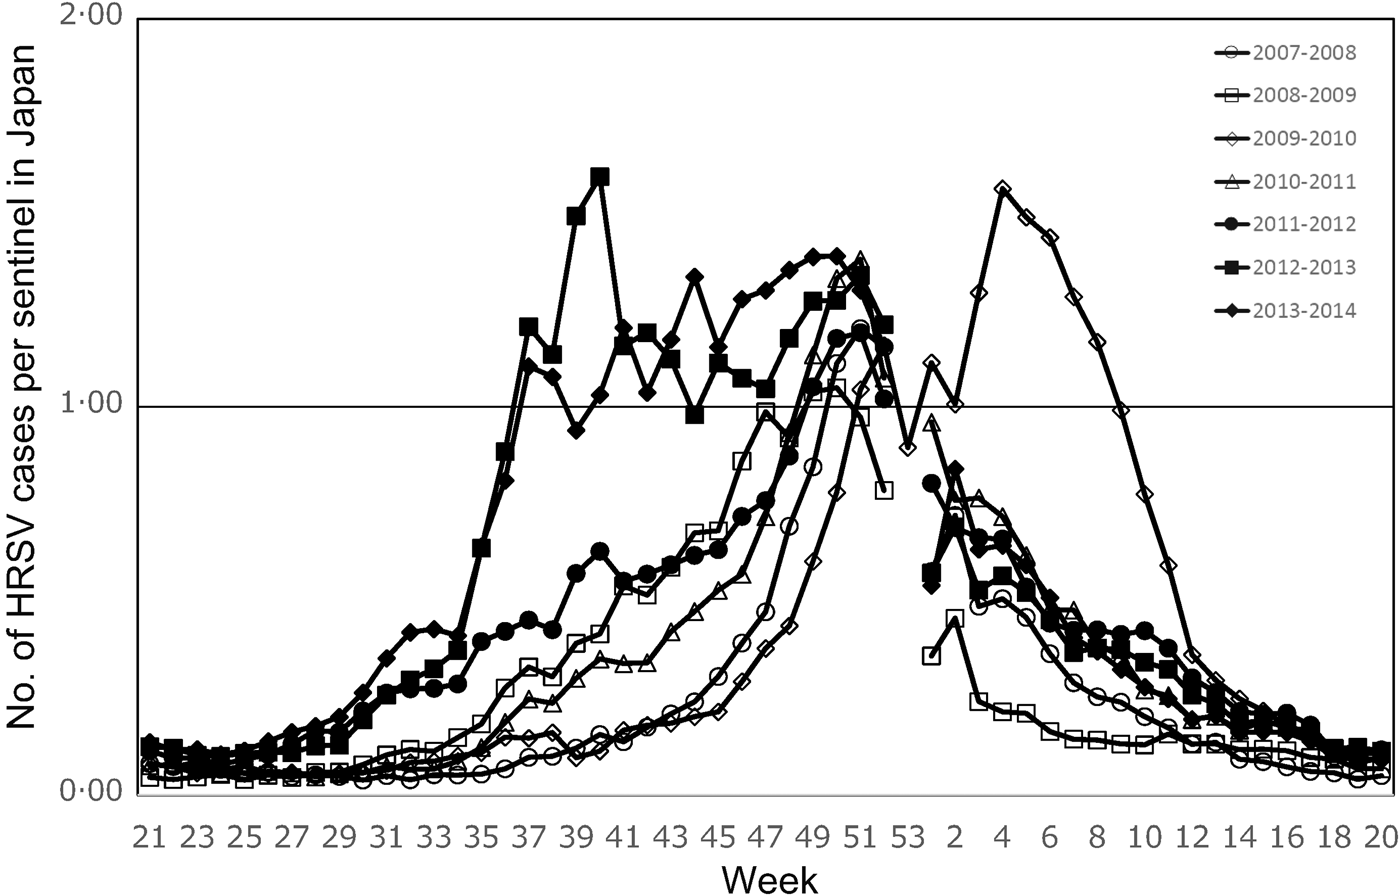
Fig. 2. National trends in human respiratory syncytial virus (HRSV) epidemics in Japan: 2007–2008 to 2013–2014. The weekly number of reported HRSV cases per sentinel in Japan is shown for the study period. One season is defined as the period from week 21 to week 20 in the following year. Year 2009 comprised 53 weeks.
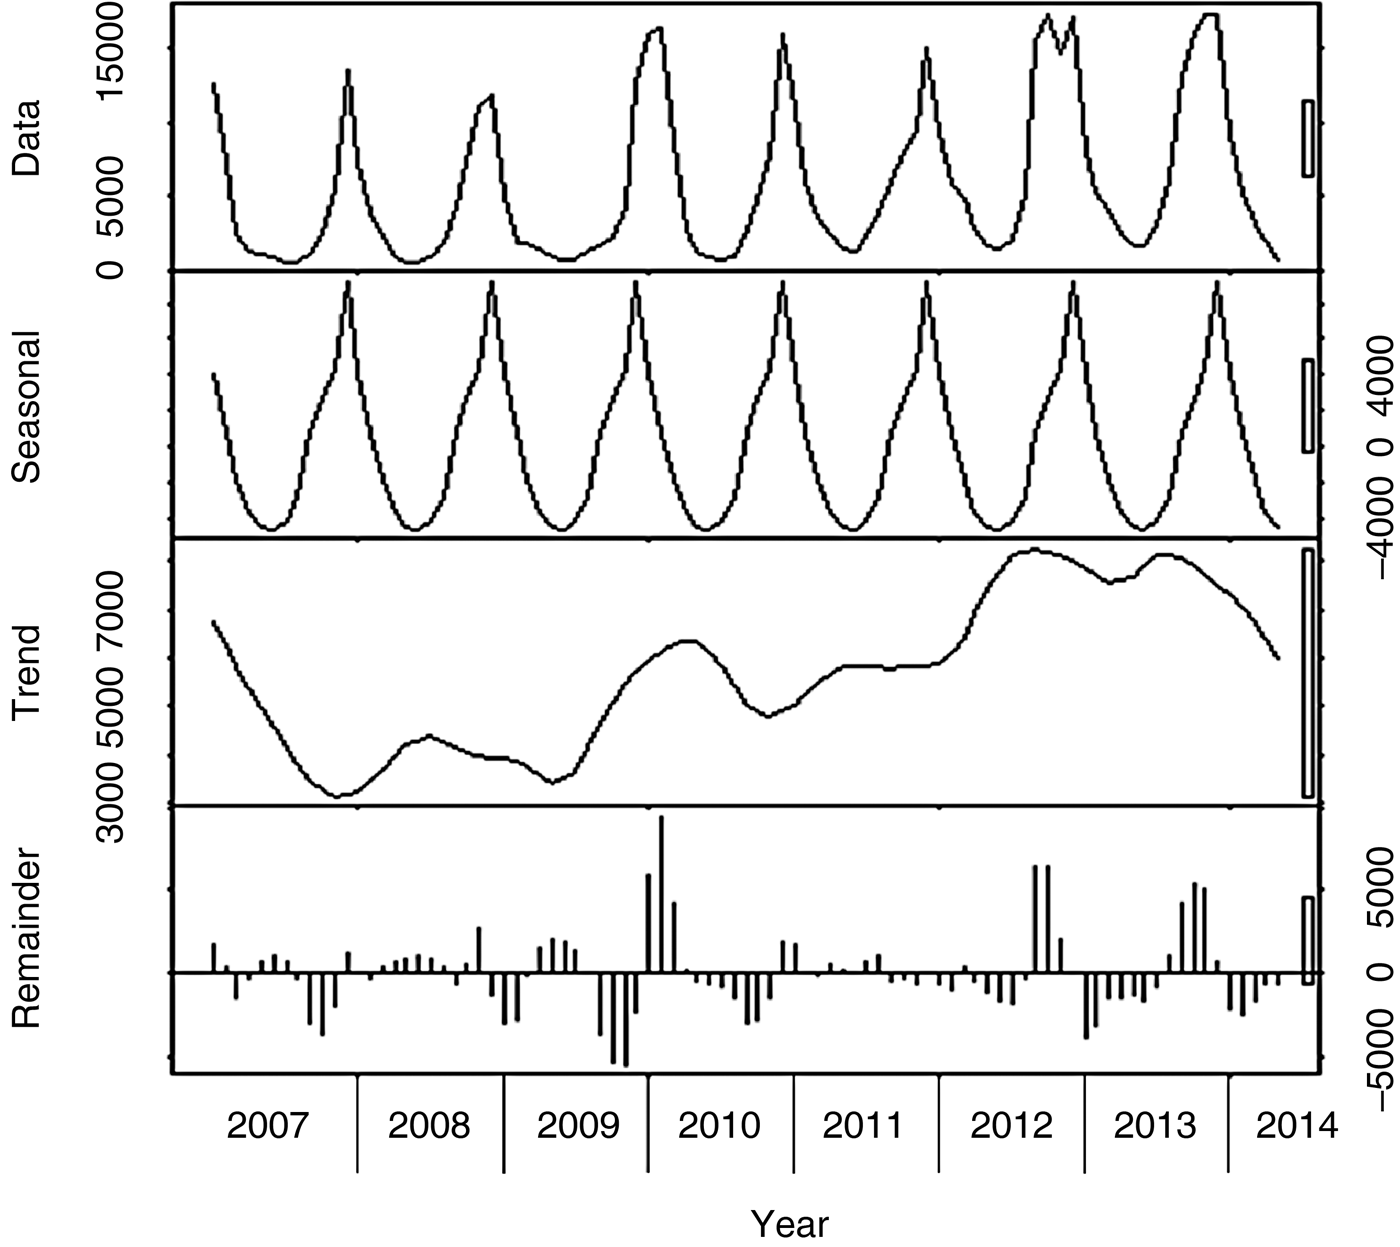
Fig. 3. Results of decomposition analysis of national human respiratory syncytial virus (HRSV) epidemics in Japan between 2007 and 2014. Data on HRSV occurrence were decomposed to three components: seasonal, trend, and remainder.
HRSV occurrence by climate region
The pattern of HRSV occurrence in Okinawa substantially differed from those in other climate regions (Fig. 3). There were summer cases, between June and August, in Okinawa. In other climate regions, HRSV occurrence mostly shifted to early autumn, from the 2011–2012 season, except in the Japan Sea, Hokkaido and East Japan, Chuo-Kogen regions. Obvious summer peaks were observed in Kyushu and Nankai. The 2009–2010 season was exceptional, as the reported cases of HRSV increased later, in February. Regarding summer occurrence between weeks 23 and 35, reported HRSV cases greatly increased in the Kyushu and Nankai climate regions during the period from the 2011–2012 season to the 2013–2014 season (Fig. 4). Seasonal-trend decomposition analysis showed that the positive remainder in September to November in both 2012 and in 2013 was prominent in each climate division. Irregular remainders were observed from September 2009 to March 2010 in most of the divisions. The shape of the seasonal trend in South Japan (Okinawa), Kyushu, and Nankai (dual peaks) differed from those in the other climate divisions (Fig. 5).
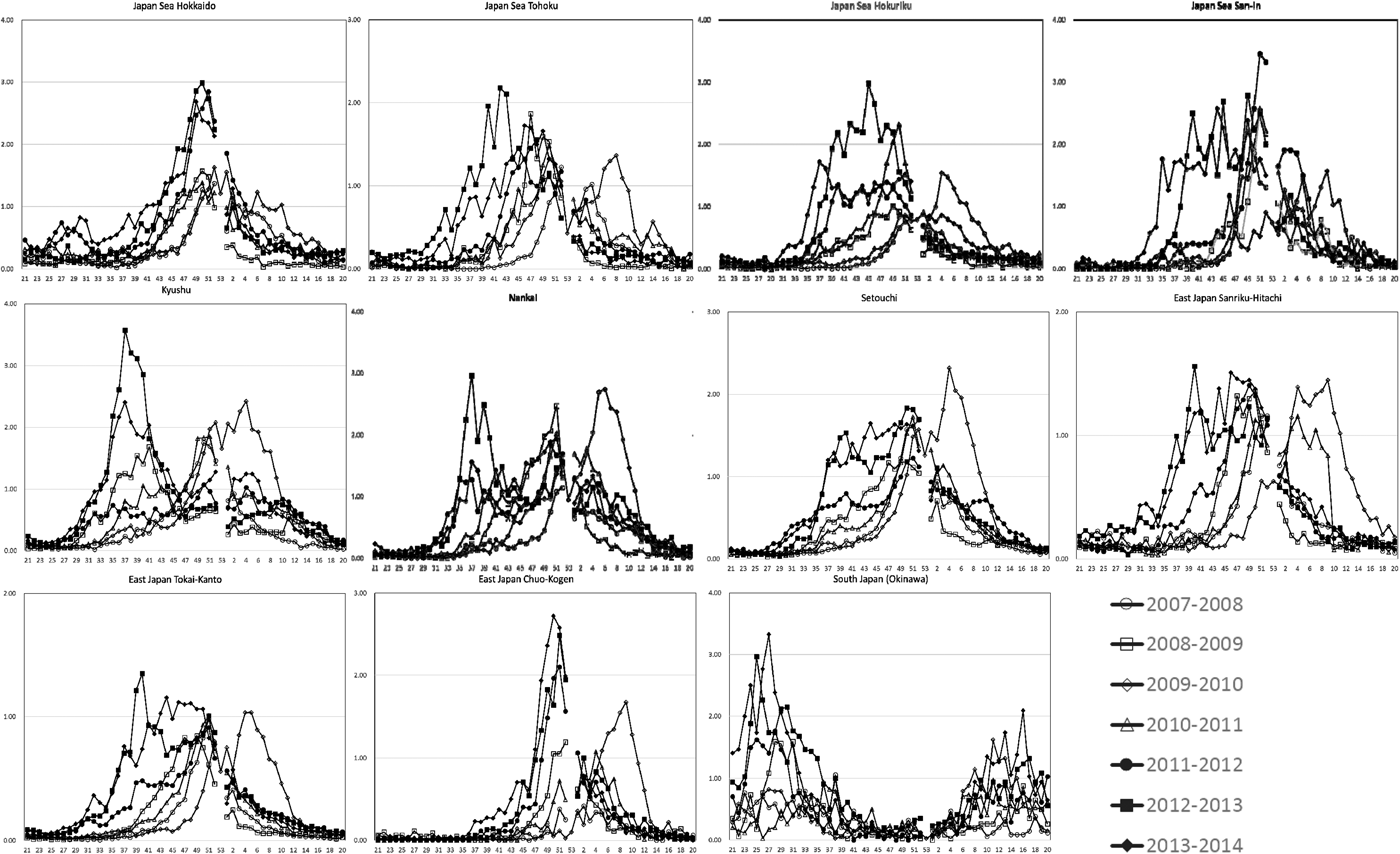
Fig. 4. Trends in human respiratory syncytial virus epidemics for each climate region in Japan: 2007–2008 to 2013–2014. Epidemic curves were divided into 11 regions, using the Sekiguchi climate classification [Reference Sekiguchi22], as shown in Figure 1.

Fig. 5. Results of decomposition analyses for each climate region in Japan: 2007–2014. Data on human respiratory syncytial virus occurrence in 11 climate regions were decomposed to three components: seasonal, trend, and remainder.
Climate factors and HRSV occurrence
In the contour plot map, reported summer HRSV cases were clustered at temperatures higher than 25 °C and relative humidities greater than 50% (Fig. 6). Four models were computed using meteorological factor(s): temperature and/or relative humidity and the interaction term (temperature × relative humidity) (Table 1). Those models showed that higher temperature and higher relative humidity were associated with HRSV occurrence. The best-fit model was the final model (model 4), which included the interaction term and had an AIC value of 11·31 and a BIC value of –20 519·64. No influential data on outcome variables was shown by using the Cook distance plot. All the values of Cook distance were <1·0. In addition, the interaction term was statistically significant when the temperature was highest (>28·2 °C = fourth quartile) at any relative humidity, and when temperature was higher than 26·0 °C but lower than 28·2 °C (third quartile) and relative humidity was highest (>79·0% = fourth quartile). These findings indicate that such temperature and relative humidity conditions increase synergistically the number of the HRSV cases. Coefficients of HRSV cases/1000 persons per sentinel site, in relation to the combination of meteorological conditions, are shown in Figure 7. The marginal effect on HRSV cases/1000 persons per sentinel is shown in Table 2. When temperature was ⩾28·2 °C, coefficients of HRSV occurrence increased gradually as relative humidity increased. When temperature was ⩾26·0 °C and <28·2 °C, coefficients of HRSV occurrence were high when relative humidity was high (⩾79·0%). Regarding the year variable, year was positively associated with the reported cases of HRSV. In particular, significantly higher numbers of HRSV cases were reported in 2011, 2012, and 2013 than in 2007.

Fig. 6. Contour plots of climate conditions associated with summer human respiratory syncytial virus (HRSV) epidemics (weeks 23–35) in Japan. The plot shows optimal meteorological conditions associated with HRSV circulation per sentinel, in all prefectures, during summer (weeks 23–35; corresponding to June–August in the study period). Average temperature and relative humidity are shown on the x and y axes, respectively. Weekly HRSV cases in each prefecture was set as the Z value. On the map, colours indicate HRSV activity, from no or few cases (blue) to many cases (red).
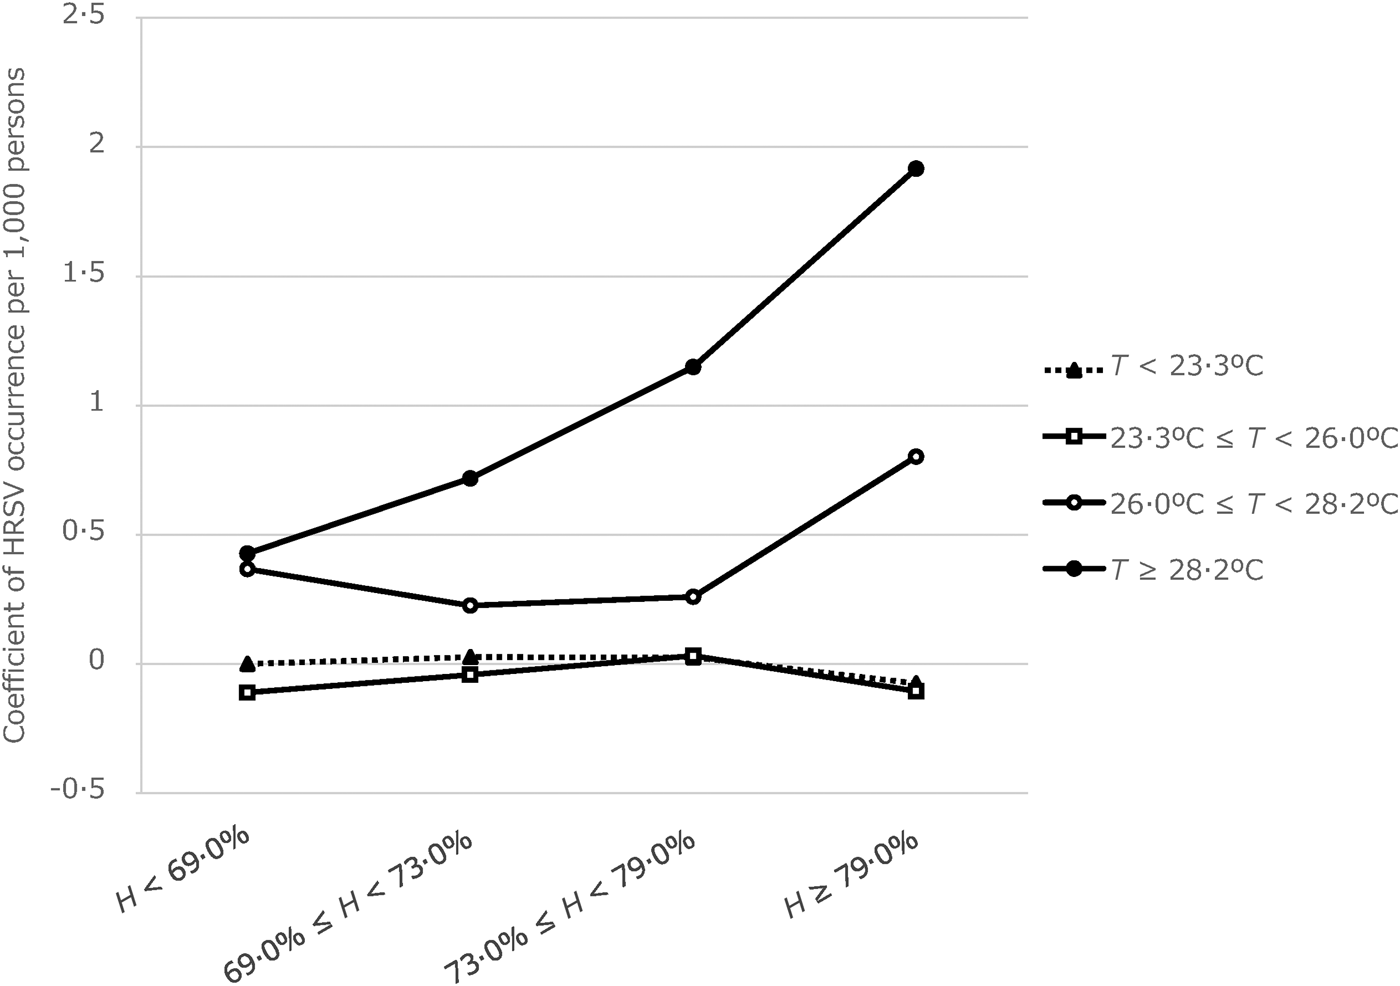
Fig. 7. Marginal effect of meteorological conditions (combinations of temperature and relative humidity) on human respiratory syncytial virus (HRSV) incidence/1000 persons per sentinel site. Differences in meteorological conditions affect the extent of the increase in HRSV occurrence. T, average weekly temperature; H, average relative humidity.
Table 1. Negative binomial regression models used to analyse factors associated with HRSV occurrence in Japan
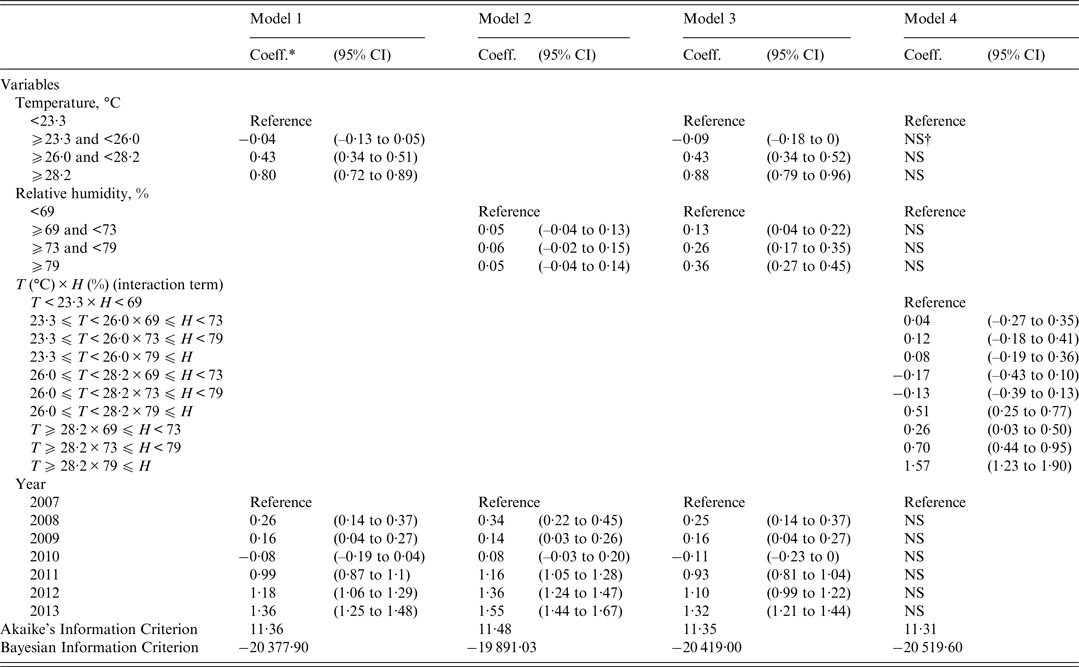
CI, Confidence interval; T, temperature; H, relative humidity.
* Coefficient of the variables.
† NS, data not shown because model used the interaction term.
Table 2. Negative binomial regression model to analyse marginal effect of meteorological conditions on HRSV cases/1000 persons per sentinel in Japan
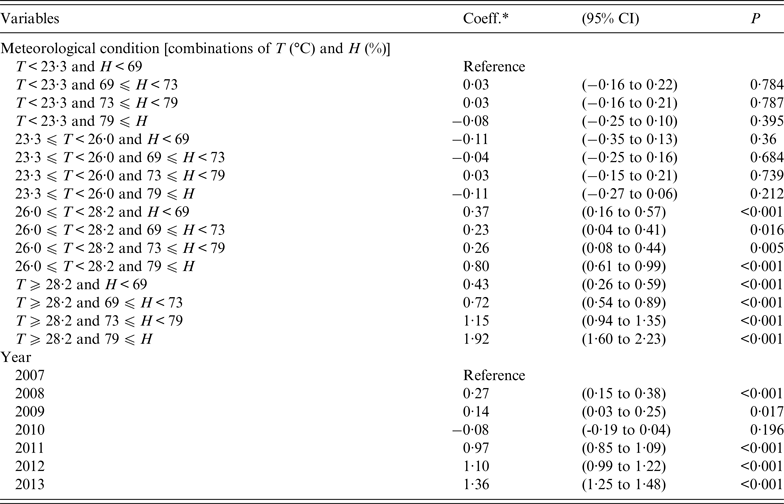
CI, Confidence interval; T, temperature; H, relative humidity.
* Coefficient of the variables.
DISCUSSION
This study confirmed the occurrence of summer HRSV cases in temperate areas of Japan and identified meteorological conditions associated with such occurrences. Previous studies showed that, in temperate zones such as mainland Japan, HRSV cases increased from autumn to winter, but not in summer [Reference Borchers1]. In contrast, tropical or subtropical zones, like Okinawa Island, have multiple and diverse peaks in incidence throughout the year, particularly during the rainy season [Reference Haynes5]. However, current study showed that summer peak was observed in Kyushu and Nankai climate division, which are located in Japan mainland. Paediatricians responsible for infant care need to be aware of the existence of summer cases of HRSV in temperate zones, because children are at higher risk of complications from HRSV infection and may benefit from receiving prophylaxis drugs.
Results of negative binomial regression models indicate that higher temperature and higher relative humidity are positively associated with HRSV occurrence in summer. Previous studies showed that lower temperature and higher relative humidity were consistently associated with HRSV cases in temperate zones [Reference Tang and Loh4]. Because more cases are reported in autumn/winter in temperate zones than in summer, HRSV epidemics were associated with lower overall temperatures in previous studies. Consideration of the interaction term temperature × relative humidity in the present model enabled us to understand synergistic effects of meteorological conditions with HRSV occurrence. Higher relative humidity is consistently associated with summer HRSV trends and in whole-year studies [Reference Chan7, Reference Viegas8, Reference du Prel11]. In addition, our focus on summer cases allowed us to investigate the association between meteorological conditions and HRSV occurrence in summer. A previous epidemiological study showed a bimodal association between temperature and HRSV incidence: activity peaks were observed at temperatures of 24–30 °C and 2–6 °C [Reference Yusuf25]. This indicates that HRSV is active at both high and low temperatures. In conditions of high temperature and high humidity, HRSV is stable enough to be transmitted in large-particle aerosols [Reference Hall and Douglas26, Reference Rechsteiner and Winkler27]. At low temperatures, HRSV is believed to be stable in solutions of human secretions in the environment [Reference Hambling28]. Thus, we conclude that HRSV transmission differs in autumn to winter (at low temperatures) and summer (at high temperatures). Of course, potential unmeasured confounders might be important, such as differences in patterns of human contact in summer and in winter [Reference Murray29]. Detailed studies of such confounders are needed.
Several studies found that global climate change affects geographic and temporal patterns of infectious disease epidemics [Reference Altizer30–Reference Hasnain32]. Ongoing global warming may have created a warmer, more humid summer climate in temperate zones and thus might improve conditions for HRSV transmission in Japan. If so, the number of summer HRSV cases is likely to increase in temperate areas in the near future. Future studies should examine the association between climate change and HRSV transmission in temperate zones in summer.
Previous studies using various methods showed significant associations of HRSV incidence with meteorological factors such as temperature, relative humidity, and amount of rainfall. Most studies used regression, but some utilized an autoregressive integrated moving average (ARIMA) model to predict the occurrence of HRSV cases [Reference du Prel11, Reference Tang13, Reference Chen16]. In this study, we first used a negative binomial regression model to examine the association between HRSV occurrence and meteorological conditions, using number of reported HRSV cases/1000 persons per sentinel in national surveillance data. That analysis revealed the meteorological conditions associated with summer HRSV occurrence. To our knowledge, this study is the first to identify meteorological conditions associated with summer HRSV occurrences. Evaluation of the interaction effect of temperature and relative humidity was challenging, and our results are only valid for summer in Japan. Thus, future studies should attempt to develop and validate our findings in other conditions and countries.
The national surveillance data on reported HRSV cases used in this study are reliable because they are mostly based on diagnoses made using commercial rapid test kits for HRSV infection in Japan. The sensitivity and specificity of these kits are typically >90% [Reference Selvarangan, Abel and Hamilton33]. The rapid test kit for HRSV was first marketed in 2003 but was used only for inpatients aged <3 years. In 2006, health insurance began to cover the cost of use in all paediatric inpatients. In 2011, coverage was extended to outpatients aged <1 year and to children born prematurely or with complications (until age 2 years), for whom palivizumab is indicated. Thus, rapid test kits are now widely used by Japanese paediatricians in clinical settings. HRSV infection is now easily diagnosed, especially suspected cases in summer. The characteristics of the Japanese health care system also increase the reliability of the surveillance data, as almost all patients have access to a doctor when fever or respiratory symptoms develop [Reference Ikegami34].
This study had several limitations. First, we did not consider genetic variation in HRSV circulating during the study period. The appearance of a new HRSV genotype could affect the scale of epidemics [Reference Shobugawa35]. In recent years, a new HRSV type A strain, ON1, has emerged and has begun to circulate worldwide [Reference Eshaghi36, Reference Pierangeli37]. The emergence of such strains could affect the timing of HRSV occurrences. Genetic variation in circulating HRSV should be considered in a future study. Second, the surveillance data could have been affected by the perceived likelihood of diagnosis. Paediatricians do not suspect HRSV infection in older children, because symptoms are mild and self-limiting, but some paediatricians might be diligent in diagnosing HRSV infection. Such discrepancies could lead to reporting bias and may affect surveillance results. In addition, a commercial diagnostic test kit for HRSV began to be used in clinical settings during the study period, which may have resulted in surveillance bias. Although there is a potential for bias, data on national HRSV trends are believed to be reliable because of the large number of medical institutions involved (3000) in national infectious disease surveillance.
In conclusion, using 7 years of national surveillance data on HRSV and detailed meteorological data, we found that summer HRSV cases occurred in the temperate zone in Japan. Higher temperature and higher humidity were associated with HRSV circulation in summer in Japan. As a preventive measure, paediatricians should monitor local HRSV surveillance data in summer. In addition, researchers should investigate the effects of climate change and ongoing global warming on HRSV occurrence.
SUPPLEMENTARY MATERIAL
For supplementary material accompanying this paper visit http://dx.doi.org/10.1017/S095026881600220X.
ACKNOWLEDGEMENTS
The authors thank Naoki Tomita for his help in managing the HRSV and meteorological data. This research is partially supported by the Japan Initiative for Global Research Network on Infectious Diseases (J-GRID) from Ministry of Education, Culture, Sport, Science & Technology in Japan, and Japan Agency for Medical Research and Development (AMED).
All phases of this study were supported by an academic research grant from the Niigata Medical Association and the Japan Foundation for Pediatric Research.
DECLARATION OF INTEREST
None.


