


INTRODUCTION
Attention-deficit/hyperactivity disorder (ADHD) symptoms are common (Pastor, Reuben, Duran, Hawkins, Reference Pastor, Reuben, Duran and Hawkins2015) and often evident early in development (Arnett, MacDonald, Pennington, Reference Arnett, MacDonald and Pennington2013); by age 4 years, as many as 40% of children exhibit parent-reported problems with attention or hyperactivity-impulsivity corresponding to diagnostic criteria for ADHD (Smidts & Oosterlaan, Reference Smidts and Oosterlaan2007). In fact, ADHD is the most commonly diagnosed form of psychopathology during the preschool years (Armstrong & Nettleton, 2004), with onset during early childhood associated with significant long-term health and economic costs (Chorozoglou et al., Reference Chorozoglou, Smith, Koerting, Thompson, Sayal and Sonuga-Barke2015).
ADHD has been associated with widespread structural brain abnormalities in school-aged and adolescent youth, including smaller overall cerebral volumes (Friedman & Rapoport, Reference Friedman and Rapoport2015), reductions in total gray matter volumes (Batty et al., Reference Batty, Liddle, Pitiot, Toro, Groom, Scerif and Liotti2010), and delays in cortical maturation (Shaw et al., Reference Shaw, Eckstrand, Sharp, Blumenthal, Lerch, Greenstein and Rapoport2007). More specific findings have consistently centered on networks important for attentional control, including regional structural anomalies in prefrontal and premotor areas (Dirlikov et al., Reference Dirlikov, Rosch, Crocetti, Denckla, Mahone and Mostofsky2015; Shaw et al., Reference Shaw, Lerch, Greenstein, Sharp, Clasen, Evans and Rapoport2006; Yang, Carrey, Bernier, & MacMaster, Reference Yang, Carrey, Bernier and MacMaster2015), supplementary motor complex (Mahone, Ranta, et al., 2011), and basal ganglia (Nakao, Radua, Rubia, & Mataix-Cols, Reference Nakao, Radua, Rubia and Mataix-Cols2011; Qiu et al., Reference Qiu, Crocetti, Adler, Mahone, Denckla, Miller and Mostofsky2009), with these differences evident into adulthood (Greven et al., Reference Greven, Bralten, Mennes, O’Dwyer, Van Hulzen, Rommelse and Buitelaar2015; Nakao et al., Reference Nakao, Radua, Rubia and Mataix-Cols2011). The rate of cortical maturation in prefrontal cortical regions, including middle, (right) inferior, and orbital frontal gyri (Shaw et al., Reference Shaw, Gilliam, Liverpool, Weddle, Malek, Sharp and Giedd2011), as well as observed reductions in gray matter (e.g., cortical volumes and/or thickness) in right frontoparietal regions (Almeida Montes et al., Reference Almeida Montes, Prado Alcántara, Martínez García, De La Torre, Avila Acosta and Duarte2013), premotor and primary motor cortex (Dirlikov et al., Reference Dirlikov, Rosch, Crocetti, Denckla, Mahone and Mostofsky2015), and supplementary motor complex (Mahone, Ranta, et al., Reference Mahone, Ranta, Crocetti, O’Brien, Kaufmann, Denckla and Mostofsky2011) have been associated with severity of ADHD symptoms in children and/or adolescents.
Most studies examining structural brain anomalies in children with ADHD have examined school-aged samples. Although early anomalous development in regions important for early attentional control may subsequently influence development of key structures in these networks (Limperopoulos, Chilingaryan, Guizard, Robertson, & Du Plessis, Reference Limperopoulos, Chilingaryan, Guizard, Robertson and Du Plessis2010), few studies have examined whether the brain anomalies seen in older children with ADHD are evident closer to symptom onset. The only studies to date in very young children with ADHD have found few differences in cortical thickness (Yang et al., Reference Yang, Carrey, Bernier and MacMaster2015) or volumes (Mahone, Crocetti, et al., Reference Mahone, Crocetti, Ranta, MacNeil, Gaddis, Cataldo and Mostofsky2011); however, both samples were small and closer examination of frontal regions associated with ADHD-related dysfunction noted previously may yield differing results. Given dynamic changes in cortical volumes during the preschool period, particularly within frontal cortices (Brown & Jernigan, Reference Brown and Jernigan2012), further investigation of regions important for development of attentional and response control is needed in well-powered samples of young children.
Given the early onset of ADHD symptoms and developmental nature of the observed brain anomalies, further examination of early brain differences in very young children with ADHD is critical for advancing understanding of the disorder. The present study represents a first step toward more comprehensively examining anatomical differences in brain development between preschoolers with ADHD and typically developing peers. We hypothesized that, consistent with findings in older children with ADHD, cortical, particularly frontal, development would be anomalous in young children with ADHD, relative to their typically developing peers. A preliminary investigation (Mahone, Crocetti et al., Reference Mahone, Crocetti, Ranta, MacNeil, Gaddis, Cataldo and Mostofsky2011) within a subsample (N=26 preschoolers, 13 ADHD) of the present study previously failed to find significant group differences in cortical volumes, which they hypothesized was potentially reflective of lack of power given the small sample size.
Power calculations based upon data from the original pilot sample (n=23) for lobar multivariate analyses of variance (MANOVAs) indicate power estimates of .108 (left hemisphere lobar volumes) and .169 (right hemisphere lobar volumes). Based upon Cohen’s d calculated for each specific lobar group difference in the pilot sample, with assumption of r=.90 reliability for repeated MRI measurements, the sample sizes (per group) needed for power of .80 in the present study range from 13 (right frontal lobe) to 47 (left parietal lobe). The present study sought to more comprehensively investigate these differences in a much larger (and adequately powered) sample of preschoolers with ADHD (N=90). In addition, the present study’s methods took advantage of a sophisticated frontal lobe parcellation technique designed especially to examine frontal regions of interest in youth with ADHD (e.g., the Ranta atlas: Ranta et al., Reference Ranta, Crocetti, Clauss, Kraut, Mostofsky and Kaufmann2009, Reference Ranta, Chen, Crocetti, Prince, Subramaniam, Fischl and Mostofsky2014). The present study investigated differences in regionally specific cerebral volume among 90 medication-naïve preschool children (ages 4–5 years) with and without ADHD, exploring associations between particular regional brain volumes and symptom severity.
METHODS
Study Procedures
Participants were recruited from the community, daycare centers, and pediatricians’ offices. Interested parents were provided with a study description, completed a telephone interview to determine participant eligibility, met in person with a research assistant to answer questions, then signed informed consent; children provided verbal assent. After enrollment, participants completed an assessment battery including measures of cognitive and language functioning, while parents completed behavior rating scales. Mock MRI scan training preceded scans, scheduled in conjunction with the assessment visit. All procedures were approved by the Johns Hopkins Hospital Institutional Review Board.
Participants
Participants were required to be between the ages of 4 years, 0 months and 5 years, 11 months at the study visit.
Inclusion and exclusion procedures
Participants were excluded for any of the following, established via review of medical/developmental history and/or by study assessment: (1) diagnosis of intellectual disability or autism spectrum disorder; (2) known visual impairment; (3) treatment for psychiatric disorder (other than ADHD) with medication; (4) history of DSM-IV diagnosis, other than oppositional defiant disorder or adjustment disorder; (5) neurological disorder (e.g., epilepsy, traumatic brain injury, Tourette syndrome); (6) documented hearing loss ≥ 25 dB; (7) history of physical, sexual, or emotional abuse; (8) medical contraindication to MRI; or (9) Full Scale IQ<80. In addition, children were excluded if developmental language disorder (DLD) was determined either during initial phone screen, based on prior assessment (completed within 1 year of the current assessment), or during study visit. DLD exclusion is in deference to literature suggesting that language impairments may influence development of inhibitory control, response preparation, and working memory–core features of ADHD (Hagberg, Miniscalco, & Gillberg, Reference Hagberg, Miniscalco and Gillberg2010). Children who were unable to complete imaging after repeated mock scan training also were excluded.
Of those initially recruited (N=142), 15 participants were determined to be ineligible for participation at telephone screening or based upon initial behavioral measures. Of those initially considered eligible, one participant elected to withdraw before study completion, leaving an initial enrollment of 129 preschoolers. Of those who successfully completed both behavioral training (n=119) and MR imaging (n=103), five were subsequently determined to be ineligible based upon incidental imaging findings and software registration errors resulted in inability to use imaging data from eight children. The total remaining in the study with useable imaging and behavioral data included 90 preschoolers (38 typically developing, 52 with ADHD).
Diagnostic methods for group assignment were adapted from the NIH Preschoolers with Attention-deficit/Hyperactivity Disorder Treatment (PATS) Study (Kollins et al., Reference Kollins, Greenhill, Swanson, Wigal, Abikoff, McCracken and Bauzo2006; Posner et al., Reference Posner, Melvin, Murray, Gugga, Fisher, Skrobala and Greenhill2007). Diagnosis of ADHD was made using modified DSM-IV-TR criteria, based on parent report on the Diagnostic Interview Schedule for Children-Young Child (YC-DISC; used for 4 year olds) (Lucas, Fisher, & Luby, Reference Lucas, Fisher and Luby1998, Reference Lucas, Fisher and Luby2008) or Diagnostic Interview for Children and Adolescents, Fourth Edition (DICA-IV; used for 5-year-olds) (Reich, Welner, & Herjanic, Reference Reich, Welner and Herjanic1997), and the DSM-IV ADHD Scales (Scales L and M) of the Conners’ Parent Rating Scales-Revised (CPRS) (Conners, Reference Conners1997). The YC-DISC is a highly structured, computer-assisted diagnostic instrument that assesses common psychiatric disorders, as defined by DSM-IV, presenting in young children; the DICA-IV is the parallel version for older children and adolescents. For inclusion in the ADHD group, children had T-scores ≥ 65 on one or both of the CPRS DSM-IV ADHD Scales, presence of symptoms for at least 6 months as documented via structured interview, and evidence of cross-situational impairment (defined as parent report of problems at home and with peers, as not all children were enrolled in school).
Upon meeting eligibility/exclusion criteria, children were included in the control group only if they (1) did not have a sibling diagnosed with ADHD, (2) did not meet categorical diagnostic criteria for any disorder on the YC-DISC or DICA-IV, and (3) had T-scores<65 on the CPRS DSM-IV ADHD scales.
Assessment Methods
Wechsler Preschool and Primary Scale of Intelligence-Third Edition (WPPSI-III) (Wechsler, Reference Wechsler2002)
The WPPSI-III is an individually administered, norm-referenced test of early cognitive abilities used to assess IQ (FSIQ).
Clinical Evaluation of Language Functions-Preschool-2 (CELF-P2) (Wiig, Secord, & Semel, 2004)
The CELF-P2 is an individually administered, norm-referenced test used to identify language disorders in preschool children. Children scoring below -1.5 SD on either the Receptive Language or Expressive Language Index of the CELF-P2, or below -1.0 SD on both indices, were excluded.
Conners’ Parent Rating Scales-Revised, Long Form (CPRS) (Conners, Reference Conners1997)
Dimensional ratings of ADHD symptom severity were obtained using the DSM-IV oriented scales from the CPRS, including Scale L (DSM-IV Inattentive) and Scale M (DSM-IV Hyperactive/Impulsive).
MRI Methods
Preparation of preschoolers for scans
MRI scanning in children is inherently challenging, particularly for young children with behaviors associated with ADHD. Two problems must be overcome: first, getting children to enter the MRI environment willingly, and second, keeping their heads sufficiently still to acquire good data. Head motion is a particular challenge in young children with neurodevelopmental disorders. The present study used a brief (15–30 min) behavioral protocol involving practice with a mock MRI scanner, designed for young children and those with developmental disabilities (Slifer, Cataldo, Gerson, & Tucker, Reference Slifer, Cataldo, Gerson and Tucker1994); a full description of behavioral procedures used can be found in Mahone, Crocetti, et al. (Reference Mahone, Crocetti, Ranta, MacNeil, Gaddis, Cataldo and Mostofsky2011). Scans took place in the afternoon of the second day of study visit, following completion of testing, a lunch break, and successful completion of mock scan procedures. Where a repeat session of mock scan practice was required, the second session and real scan took place in the afternoon of another day, scheduled at family convenience.
Imaging methods
All scanning was completed using a 3.0T Philips GyroscanNT scanner. Magnetization Prepared Rapid Gradient Recalled Echo (MPRAGE) images were used for volumetric assessment. Slice thickness=1.0 mm; field of view=26 cm; Matrix size: 256 × 256. A Sensitivity Encoding (SENSE) coil was used to address geometric distortion artifacts due to macroscopic magnetic susceptibility effects that can cause signal dropout at the air–tissue interface. Cortical reconstruction and volumetric segmentation was performed with the Freesurfer image analysis suite, documented and freely available for download online (http://surfer.nmr.mgh.harvard.edu). To ensure good data quality, a rigorous qualitative assessment of motion was used for each MPRAGE scan in three stages.
First, the MPRAGE was visually inspected for gross motion artifacts (e.g., ringing, blurred gray–white matter boundaries, frame shifts, pixelation) at the scanner and a new MPRAGE was attempted, following corrective feedback to the child, if excessive motion was detected. Additionally, a trained research team member sat with the child as needed to help minimize movement. Second, visual inspection for each MPRAGE was conducted by 2 raters and the quality rating on a scale of 1 (“good”) to 5 (“poor”) was based on their agreement. Images classified as good contained no visible signs of distortion, ringing, ghosting, shifts in subject position, signal-dropout, or blurring (i.e., partial-voluming due to compromised signal-to-noise). Images rated with scores of 2 through 5 present varying degrees of the motion artifact categories listed above; poor quality scans (ratings of 5) were excluded from analyses. Third, if outliers were detected in the Freesurfer cortical statistics, parcellation maps were visually inspected for errors. Quality ratings were evenly distributed across diagnostic groups (χ 2 (4)=2.634, p=.621).
Total cerebral volume and regional measures of cortical volume were obtained using automated methods within Freesurfer. Freesurfer used a fully automated method to perform pre-processing steps including Talairach alignment, intensity normalization, and removal of skull and non-brain tissue with a hybrid watershed/surface deformation procedure, separation of the cerebellum and brainstem from the cerebrum, and splitting of the left and right hemispheres (Dale, Fischl, & Sereno, Reference Dale, Fischl and Sereno1999; Segonne et al., Reference Segonne, Dale, Busa, Glessner, Salat, Hahn and Fischl2004). A deformable surface algorithm was used to define inner (gray–white) and outer (gray-cerebrospinal fluid [CSF]) cortical surfaces (Dale et al., Reference Dale, Fischl and Sereno1999). Automated topological correction, surface inflation and registration to a spherical atlas were also included in the processing stream (Dale et al., Reference Dale, Fischl and Sereno1999; Fischl, Sereno, & Dale, Reference Fischl, Sereno and Dale1999). Total cerebral volume (TCV) including total cerebral gray and white matter for each subject was estimated using the Freesurfer pial surface, excluding CSF.
Frontal lobe sub-regions were generated using an automated protocol developed in Freesurfer (Ranta et al., Reference Ranta, Chen, Crocetti, Prince, Subramaniam, Fischl and Mostofsky2014), which applies a frontal lobe parcellation based on the highly reliable manual method described in Ranta et al. (Reference Ranta, Crocetti, Clauss, Kraut, Mostofsky and Kaufmann2009) in which sulcal-gyral landmarks were used to manually delimit functionally relevant regions within the frontal lobe. Functional subdivisions of the frontal lobe include: primary motor cortex, anterior cingulate, premotor cortex regions (supplementary motor complex [SMC], frontal eye field, and lateral premotor cortex) and prefrontal cortex (PFC) regions (medial PFC, dorsolateral PFC, inferior PFC, lateral orbitofrontal cortex [OFC] and medial OFC). Regional volumes (e.g., premotor and prefrontal volumes) reflect summed raw volumes of parcellated sub-regions as specified above (i.e., left premotor cortex was calculated as the sum of the left SMC, left frontal eye field, and left lateral premotor cortex volumes; left PFC was calculated as the sum of the left medial PFC, left dorsolateral PFC, left inferior PFC, left lateral OFC, and left medial OFC volumes).
Regional and sub-regional volumes were normalized in all analyses to correct for within-group total cerebral volume differences, using the procedure recommended by Kramer et al. (Reference Kramer, Quitania, Dean, Neuhaus, Rosen, Halabi and Miller2007): multiplying the absolute ROI volume by the average total cerebral volume of the analysis group and dividing by the individual’s total cerebral volume (Mahone, Ranta, et al., Reference Mahone, Crocetti, Ranta, MacNeil, Gaddis, Cataldo and Mostofsky2011; Ranta et al., Reference Ranta, Crocetti, Clauss, Kraut, Mostofsky and Kaufmann2009).
Data Analysis
Group differences (ADHD vs. TD) in TCV and adjusted lobar, regional, and sub-regional gray matter volumes were examined using serial multivariate analyses of variance (ANOVAs), and follow-up post hoc comparisons, with Bonferroni correction for multiple comparisons. Hierarchical analyses were conducted as follows: following initial examination of between-group differences in TCV, a MANOVA examined group differences in lobar volumes with two follow-up MANOVAs examining prefrontal and then premotor regions. Follow-up univariate ANOVAs examined specific sub-regions (left and right) within premotor and prefrontal regions for between group differences. Pearson correlations between regional volumes and symptom severity measures within the ADHD group examined brain-behavior relationships for regions and sub-regions previously found to show significant between group differences.
RESULTS
Sample Demographics
Mean participant age was 4.97 years (SD=.58; range=4.05–5.99 years) (see Table 1). There were no differences between groups on sex (χ 2 (1) =.048; p=.827), handedness (χ 2 (2)=.096; p=.953; 85.6% right-handed), racial distribution (χ 2 (4)=5.967; p=.202), or socioeconomic status as estimated by the Hollingshead index (p=.987). Of note, the Hollingshead index, originally developed in the 1970s (Hollingshead, Reference Hollingshead1975) is based solely upon parent education and occupation, thus has limitations as a true measure of social risk. The sample included 58 boys (24 controls, 34 ADHD) and 32 girls (14 controls, 18 ADHD), matched on age, Full-Scale IQ, and overall language abilities. Participants were 83.3% Caucasian, 11.1% African-American, 3.3% Asian, and 1.1% Multiracial (1.1% unknown/not reported). None were prescribed stimulant medication at the time of participation, although several began treatment shortly afterward.
Table 1 Sample demographic and performance summary

Note: ADHD=Attention-deficit/hyperactivity disorder; η2 p=effect size, partial eta-squared; WPPSI-3=Wechsler Preschool and Primary Scale of Intelligence, 3rd Ed.; FSIQ=Full Scale IQ score; CELF-P2=Clinical Evaluation of Language Fundamentals, Preschool, 2nd Ed.; Core Lang=Core Language score; CPRS=Conners’ Parent Rating Scale-Revised, Scale L (DSM-IV Inattentive) T-score; Scale M (DSM-IV Hyperactive/Impulsive) T-score.
Behavioral Training for Scans
The behavioral training protocol was effective for teaching 92.2% (119 of 129) of the study participants to participate in the MR imaging. Of those, 86.6% (103 of 119) were able to remain sufficiently motionless to successfully complete MR image acquisition without sedation. There was no difference between groups in participants’ ability to successfully complete mock scan and MR image acquisition (χ2 (2)=.420; p=.517).
Total Cerebral Volume
There was a significant effect of group (ADHD<TD; p=.011, η2 p=.073) and sex (girls<boys, p=.011; η2 p=.073), but no sex-by-group interaction (p=.859) on TCV. Within the narrow age range of the sample, age was not correlated with TCV (r=.184; p=.082). Given the overall between group differences in TCV, regional and sub-regional volumes were normalized in all subsequent analyses.
Lobar Volumes
After normalization, lobar GM volumes were significantly reduced in children with ADHD, relative to controls, bilaterally in frontal, temporal, and parietal lobes, with largest effect sizes noted for right frontal (η2 p=.213) and left temporal (η2 p=.216) lobe volumes (see Table 2). There was no significant effect of sex, within groups, for any of the lobar volumes (e.g., frontal, temporal, parietal, or occipital; overall multivariate: TD p=.858; ADHD p=.432).
Table 2 Lobar cortical gray matter volumes (mm3) (raw)

Note. ADHD=Attention-deficit/hyperactivity disorder; p: between group significance for normalized volumes; η2 p=effect size, partial eta-squared for between group differences in normalized volumes.
Frontal Lobe Sub-divisions
Premotor and prefrontal regions
Results of MANOVAs examining normalized frontal regions (e.g., prefrontal and premotor regions) revealed that the overall group effect was significant for both models, bilaterally (prefrontal region p=.0004; η2 p=.134; premotor region p<.0001; η2 p=.202; controls>ADHD; see Table 3). Age was not associated with regional volumes (prefrontal: r=−.109; p=.309; premotor: r=.020; p=.855).
Table 3 Sub-regional cortical gray matter volumes (mm3) (raw)

Note. ADHD=Attention-deficit/hyperactivity disorder; η2 p=partial eta-squared for differences in normalized volumes; DLPFC=dorsolateral prefrontal cortex; MPFC=medial prefrontal cortex; ILPFC=inferolateral prefrontal cortex; MOFC=medial orbital prefrontal cortex; LOFC=lateral orbital prefrontal cortex; FEF=frontal eye field; LPM=lateral premotor cortex; SMC=supplemental motor cortex; M1=primary motor cortex; ACC=anterior cingulate cortex.
p*: between group significance for normalized volumes.
a Prefrontal and premotor region volumes calculated as sums of corresponding sub-regions.
Premotor and prefrontal sub-regions
Specific findings suggest multiple areas of significantly reduced GM volumes in children with ADHD within bilateral prefrontal and premotor regions (see Table 3). The largest effect sizes for group differences were observed in left LOFC, η2 p=.116), left primary motor cortex (M1, η2 p=.129), and left SMC (η2 p=.117).
Brain–Behavior Associations
Examining brain–behavior correlations, a pattern of specific associations was observed between GM volumes and symptom severity within the ADHD group (see Table 4). Bilateral frontal and parietal lobe volumes, as well as right temporal lobe volume, were correlated with hyperactive/impulsive symptom severity (CPRS M scale), with specific associations evident within frontal sub-regions. Prefrontal (left: r=−.332; p<.01; right: r=−.292; p<.05) and premotor (left: r=−.318; p<.05; right: r=−.254; p<.05) volumes and specifically right DLPFC (r=−.253; p<.05), left FEF volume (r=−.426; p<.01), left primary motor volume (r=−.279; p<.05), and right SMC (r=−.315; p<.05) were significantly and negatively correlated with symptom ratings, such that higher ratings of hyperactivity (CPRS M scale) were associated with reduced cortical volumes (Figure 1). With regard to inattention ratings, only left parietal lobe volumes (r=−.279; p<.05) were associated with greater inattention severity (CPRS L scale).
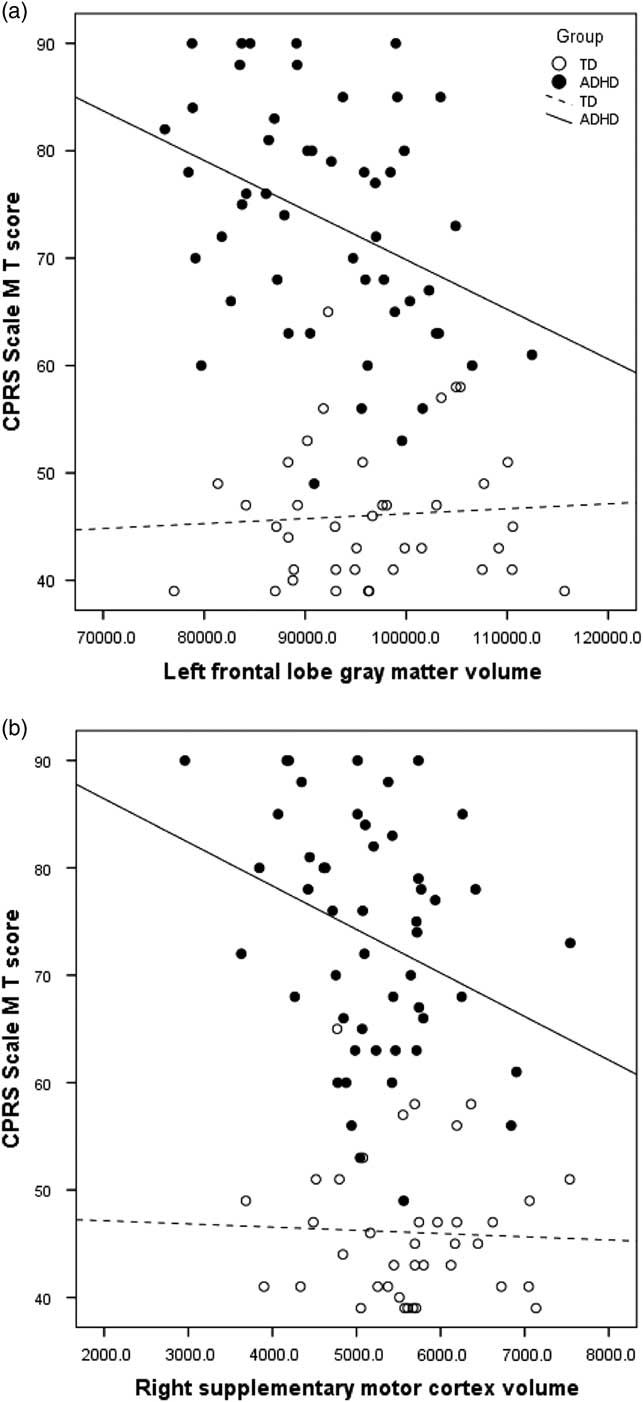
Fig. 1 Correlation between parent ratings of hyperactivity/impulsivity (CPRS Scale M) and a) left frontal gray matter volume (ADHD R 2 =.134) and b) right supplementary motor cortex volume (ADHD R 2 =.099).
Table 4 Correlations between regional gray matter volume (raw) and symptom severity within ADHD group

CPRS=Conners’ Parent Rating Scale-Revised, Scale L (DSM-IV Inattentive) T-score, Scale M (DSM-IV Hyperactive/Impulsive) T-score; ADHD=Attention-deficit/hyperactivity disorder; LH=left hemisphere; RH=right hemisphere; DLPFC=dorsolateral prefrontal cortex; MPFC=medial prefrontal cortex; MOFC=medial orbital prefrontal cortex; LOFC=lateral orbital prefrontal cortex; FEF=frontal eye field; LPM=lateral premotor cortex; SMC=supplemental motor cortex; M1=primary motor cortex;
* p<.05, **p<.01, one-tailed;
DISCUSSION
These findings are among the first to reveal strong evidence for anomalous cortical development as early as the preschool period in a carefully characterized sample of children with ADHD. Results of comparisons between children with ADHD and typically developing peers showed widespread cortical volume reductions in young children with ADHD across frontal, parietal, and temporal cortices, with large regional and medium to large sub-regional effect sizes. Furthermore, the volumetric reductions showing greatest effect size were noted in left temporal and right frontal lobes and specific prefrontal and premotor regions important for response control and execution (e.g., SMC and M1), inhibitory control (lateral OFC), as well as planning and working memory (e.g., DLPFC). Reductions in regional and specific sub-regional volumes were significantly associated with reports of greater symptom severity.
Structural brain differences characteristic of older children with ADHD in total GM volumes (Batty et al., Reference Batty, Liddle, Pitiot, Toro, Groom, Scerif and Liotti2010) and specific prefrontal and premotor regions (Dirlikov et al., Reference Dirlikov, Rosch, Crocetti, Denckla, Mahone and Mostofsky2015; Yang et al., Reference Yang, Carrey, Bernier and MacMaster2015), including SMC (Mahone, Ranta, et al., Reference Mahone, Crocetti, Ranta, MacNeil, Gaddis, Cataldo and Mostofsky2011), also appear evident in preschoolers with the disorder, with potentially larger effect sizes in preschoolers relative to those observed in these older samples. Furthermore, early anomalous brain development is associated with ADHD symptoms. Notably, however, volumetric differences in anterior cingulate cortex reported in older children with ADHD (Dirlikov et al., Reference Dirlikov, Rosch, Crocetti, Denckla, Mahone and Mostofsky2015; Villemonteix et al., Reference Villemonteix, De Brito, Slama, Kavec, Baleriaux, Metens and Massat2015) were not observed in this sample. Additionally, although between-group differences in SMC were found bilaterally, only the right SMC and left FEF showed consistent associations with ADHD symptomatology; together, these findings suggest a dynamic unfolding of functional associations over time.
Developmental studies suggest a pattern of emerging functional asymmetries from the first year of life, with a right to left gradient of development of cerebral hemispheres and a further shift over time from right to left functional dominance. Lateralization of function in children appears more variable than in adults, but the evidence suggests earlier emergence of right motor and premotor regions and later maturation of left frontal and premotor regions (Best, Reference Best1988). There is more specific evidence that orbital frontal regions develop earlier than DLPFC (e.g., Orzhekhovskaya, Reference Orzhekhovskaya1981), with right OFC integrity more strongly associated with social-behavioral functioning than left OFC (Bechara, Reference Bechara2004) and with global skills such as self-awareness (Happaney, Zelazo & Stuss, Reference Happaney, Zelazo and Stuss2004), skills known to be affected in ADHD. It may also be that specificity of premotor function develops over time such that preschoolers have yet to fully “grow into the deficits” associated with ADHD. Findings of largest between group effects in the left temporal lobe, SMC and M1, and lateral OFC may suggest the important role of developing language underlying working memory and inhibitory control in young children (e.g., internalization of self-speech, Barkley, Reference Barkley1997).
Furthermore, the variability in brain development at this point in development may help to explain the inconsistencies between the current findings and prior work in a smaller, and potentially underpowered, sample (Mahone, Crocetti, et al., Reference Mahone, Crocetti, Ranta, MacNeil, Gaddis, Cataldo and Mostofsky2011). Given the notable changes in PFC development occurring in all children during preschool (Brown & Jernigan, Reference Brown and Jernigan2012), the present study provides a window into prefrontal structural differences between very young children with ADHD and their typical peers.
The identification of early biomarkers of ADHD is critical to developing more targeted interventions, both pharmacological and behavioral, to reduce the lifetime morbidity associated with the condition. Longitudinal studies of children with ADHD symptoms paint a concerning picture of functional outcomes and long-term risks associated with early onset of hyperactivity. Even when treated during preschool, children continue to have symptoms and functional impairment in elementary school (Riddle et al., Reference Riddle, Yershova, Lazzaretto, Paykina, Yenokyan, Greenhill and Posner2013). Moreover, children identified as “hyperactive” at age 3 years show increased rates of functional impairment and psychopathology in adolescence relative to typical peers (Smith et al., Reference Smith, Meyer, Koerting, Laver-Bradbury, Lee, Jefferson and Sonuga-Barke2016). Even as adults, those who were identified as “hyperactive” in preschool are reported to have 17 times higher annual healthcare costs (Chorozoglou et al., Reference Chorozoglou, Smith, Koerting, Thompson, Sayal and Sonuga-Barke2015).
Findings of the present study suggest that some neuroimaging biomarkers of ADHD may be age-dependent and set the stage for atypical behavioral development throughout childhood and adolescence. To this end, the continued longitudinal study of early biomarkers of ADHD may help researchers determine how early patterns of anomalous development (brain and behavior) affect later presentation of symptoms to identify what aspects of early brain development are associated with continued severity of symptoms, and which are associated with “recovery” from symptoms, incorporating knowledge gained from studying the patterns of “normalization” of structure and function in certain subgroups of children with ADHD (e.g., girls).
Strengths of the study include the careful group assignment/diagnostic strategy, modeled after the PATS studies (Kollins et al., Reference Kollins, Greenhill, Swanson, Wigal, Abikoff, McCracken and Bauzo2006); matching of groups on age, sex, IQ, and language ability; and exclusion of common comorbidities to provide a clearer interpretation of findings specific to ADHD. At the same time, several limitations exist. Most notably, young children are quite variable in their day-to-day presentation with a large range of “normal” behavior at this age (Blackman, Reference Blackman1999; Byrne, Bawden, Beattie, & De Wolfe, Reference Byrne, Bawden, Beattie and De Wolfe2000), a fact that is reflected in wide standard deviations and reduced reliability of performance measures (Baron & Anderson, Reference Baron and Anderson2012). As such, there is also a lack of stability in diagnostic classification over the preschool to early school-age time period (Chacko, Wakschlag, Hill, Danis, & Espy, Reference Chacko, Wakschlag, Hill, Danis and Espy2009); given that data were collected at one point in time, we do not know how many of those within the ADHD group will still meet diagnostic criteria at later assessments and thus prove “true positives” in terms of early diagnostic accuracy.
Given the sample age range and variability in school experience, teacher ratings were not available for some participants, limiting the ability to identify cross-setting impairment per DSM-5. Additionally, given the challenges of effectively scanning preschoolers without sedation, results may reflect only the degree of brain differences evident in children with only moderate symptom severity, for example, a degree of symptomatology that permitted them to lie still in the scanner long enough to yield useable imaging. It may be that greater between group differences would be evident if we were also able to include those children who were unable to successfully participate in MRI scanning. Furthermore, exclusion of common comorbidities, to the degree possible in children this age, may limit generalization to samples of children presenting with ADHD plus comorbidities. Exclusion of common comorbidities may also contribute to the high average IQ observed in the sample (Waber et al., Reference Waber, De Moor, Forbes, Almli, Botteron, Leonard and Rumsey2007). Finally, the study did not include enough girls to permit well-powered between sex comparisons. Future work should examine the consistency of these early structural brain differences between sexes, to clarify the degree to which the pattern of sex differences evident in older children is present in preschoolers.
In summary, widespread reductions in cortical brain volumes are already evident in preschoolers with ADHD, with evidence for specific prefrontal and premotor regional anomalies. These data provide initial evidence that brain differences are evident at least as early as symptom onset, and add to earlier data suggesting subcortical anomalies as well (Mahone, Crocetti, et al., Reference Mahone, Crocetti, Ranta, MacNeil, Gaddis, Cataldo and Mostofsky2011). Furthermore, these findings provide groundwork for future work examining the developmental trajectory of cortical and subcortical development in preschoolers with ADHD, including analysis of structural and functional changes in white matter development, which will greatly expand our understanding of brain–behavior relationships in the disorder.
ACKNOWLEDGMENTS
This work was supported by NIH R01 HD068425, U54 HD079123, UL1 RR025005 and the Johns Hopkins Brain Sciences Institute; none of the authors have any biomedical financial interests or potential conflicts of interest to report.


