


Pregnancy is a critical period during which the diet of pregnant women reflects not only on her own health but also on the health of the fetus. There is evidence to suggest that inadequate nutrition during pregnancy might have unfavourable long-term effects on the developing fetus(Reference Harding1). It may be associated with increased risk of CVD, type 2 diabetes and hypertension in the later life of the child(Reference Barker2). It is therefore important to identify particular groups with poor nutritional status among pregnant women in order to give nutrition education for improving their dietary quality.
Nutritional assessment has traditionally been focused on a detailed examination of energy and nutrient intakes. Many previous studies examined the nutritional quality (i.e. adequacy or inadequacy) of each nutrient intake during pregnancy by comparison with country-specific nutrient recommendations(Reference Seshadri3–Reference Petrakos, Panagopoulos and Koutras6). If nutrient intake is inadequate or excessive, however, it is necessary to know which foods are mediating the nutrient supply so that food supply and nutrition education programmes can be directed effectively towards changing the dietary pattern(Reference Tucker, Dallal and Rush7). Recently, the dietary pattern approach, namely the measurement of overall diet assessed a posteriori using data-driven techniques such as factor analysis and cluster analysis, has become an important alternative to the traditional single-nutrient approach(Reference Newby and Tucker8). The use of the dietary pattern approach may help to capture some of the complexity of the diet that is often lost in nutrient-based analyses. It is probably able to provide additional information on formulating evidence-based dietary recommendations(Reference Moeller, Reedy and Millen9). Cluster analysis, which is as popular as factor analysis, is useful in nutritional studies to identify groups with good or poor nutritional status because it can create groups of people with relatively homogeneous dietary patterns. To our knowledge, however, no study has examined the nutritional adequacy of the dietary patterns identified by cluster analysis among pregnant women.
Here, using the baseline data from the Osaka Maternal and Child Health Study (OMCHS), we evaluated the nutritional adequacy of the dietary patterns identified by cluster analysis in a group of pregnant Japanese women by comparison with the Dietary Reference Intakes (DRI) for Japanese(10).
Subjects and methods
Subjects and study procedure
The participants were pregnant women who took part in the baseline survey of the OMCHS, a prospective cohort study investigating preventive and risk factors for maternal and child health problems. Details of the baseline survey of the OMCHS have been published elsewhere(Reference Miyake, Miyamoto and Ohya11, Reference Tanaka, Miyake and Sasaki12). Briefly, all pregnant women in Neyagawa City, one of the forty-three municipalities in Osaka Prefecture, were recruited between November 2001 and March 2003. Of the 3639 eligible women in Neyagawa City, 627 (17·2 %) participated in the present survey. In order to increase the sample size, an additional 375 pregnant women living in other municipalities were also enrolled between December 2001 and November 2003. Baseline assessment of the OMCHS was primarily conducted using a set of two self-administered questionnaires. The participants mailed the answered questionnaire to the data management centre. Research technicians completed missing or illogical data by telephone interview. A total of 1002 pregnant women completed the baseline survey.
For the present analysis, the participants aged <18 years were excluded (n 5) because indicators of DRI used for assessments of adequacy were different from those for participants aged ≥18 years. Thus, data from 997 pregnant women aged 18–43 years (gestational age: 5–39 weeks) were included in the analysis.
The OMCHS was approved by the Ethics Committee of the Osaka City University School of Medicine. Written informed consent was obtained from each participant.
Dietary assessment
Dietary habits during the previous month were assessed using a self-administered diet history questionnaire (DHQ)(Reference Sasaki, Yanagibori and Amano13–Reference Sasaki, Yanagibori and Amano15). This is a 16-page structured questionnaire that consists of the following seven sections: (i) general dietary behaviours; (ii) major cooking methods; (iii) consumption frequency and amount of six alcoholic beverages; (iv) consumption frequency and semi-quantitative portion size of 118 selected food and non-alcoholic beverage items; (v) dietary supplements; (vi) consumption frequency and semi-quantitative portion size of eight staple foods (rice, bread, noodles and other wheat foods) and miso soup (fermented soyabean paste soup), with questions on the size of cups (bowls) usually used for rice and miso soup; and (vii) open-ended items for local foods consumed regularly (one or more times per week) but not appearing in the DHQ. The food and beverage items selected were those commonly consumed in Japan, mainly from a food list used in the National Nutrition Survey of Japan, and standard portion sizes of cups (bowls) for rice and miso soup were derived mainly from several recipe books for Japanese dishes(Reference Sasaki, Yanagibori and Amano15).
Estimates of dietary intake for foods (150 items in total), energy and nutrients were calculated using an ad hoc computer algorithm for the DHQ, which was based on the Standard Tables of Food Composition in Japan (16). Information on dietary supplements and data from the open-ended questionnaire items were not used in the calculation of dietary intake because of the lack of a reliable composition table for such items in Japan. A more detailed description of the methods used to calculate dietary intake and the validity of the DHQ have been published elsewhere(Reference Sasaki, Yanagibori and Amano13–Reference Sasaki, Yanagibori and Amano15). Nutrient and food intake values were energy-adjusted using the energy-density model, i.e. the percentage of energy intake for macronutrients except for protein, and amount per 4184 kJ for protein, micronutrients and foods, both to reduce the measurement error common with dietary assessment questionnaires(Reference Murakami, Sasaki and Takahashi17, Reference Willett, Howe and Kushi18) and to avoid biased grouping due to variation in body size and energy requirement(Reference Murakami, Sasaki and Takahashi17).
Determination of nutritional adequacy
To assess the adequacy of nutrient intake, we compared the nutrient intake estimated by the DHQ to the corresponding dietary reference value according to the DRI(10). We show a brief comparison of the DRI for the USA and Canada(19) and Japan(10), for reference, in Appendix 1. Of the total thirty-four nutrients presented in the DRI, five nutrients (biotin, chromium, molybdenum, selenium and iodine) were excluded from the present study because of lack of food composition tables for such items in Japan. In the DRI for pregnant women, nutrient recommendations are set for some nutrients as increments of the non-pregnant period because of the many unique changes in physiology and nutrition needs that occur during pregnancy and lactation(10). The detailed reference values for pregnant women are shown in Appendix 2.
As the DRI for most nutrients are expressed as amounts per day(10), each reference value was energy-adjusted using the density model (i.e. percentage of energy intake for macronutrients except for protein and amount per 4184 kJ for protein and micronutrients) in accordance with the units of nutrient intake estimated by the DHQ. The energy-adjusted reference values for protein and micronutrients were calculated as follows: energy-adjusted reference value (amount per 4184 kJ) = reference value (amount/d)/estimated energy requirement (EER, kJ/d) × 4184 (kJ).
For nutrients with an Estimated Average Requirement (EAR), namely protein, vitamin A expressed as retinol equivalent (RE), vitamins B1 and B2, niacin expressed as niacin equivalent (computed as niacin (mg) + protein (mg)/6000), vitamins B6 and B12, folate, vitamin C, calcium, magnesium, iron, zinc and copper(10), observed energy-adjusted intake levels below the energy-adjusted EAR, used as a cut-off value, were considered as inadequate. For iron, the EAR cut-point method cannot be used because of the seriously skewed distribution of the requirement for menstruating women(19, 20). However, as pregnant women are not menstruating, the distribution of their iron requirements approaches symmetry according to previous reports(20, Reference Cockell, Miller and Lowell21). In accordance with previous studies(Reference Cockell, Miller and Lowell21, Reference Pinto, Barros and dos Santos Silva22), we also used the EAR cut-point method for iron.
In the Japanese DRI(10), the Tentative Dietary Goal for Preventing Lifestyle-related Disease (DG) is defined as the average daily nutrient intake level (or ranges) that Japanese should currently aim to consume primarily to prevent chronic diseases (e.g. CVD (hypertension, hyperlipidaemia, stroke and myocardial infarction) and cancer (especially, stomach cancer)), which basically corresponds to the Acceptable Macronutrient Distribution Ranges (AMDR) of the US and Canadian DRI(19) (Appendix 1). The DG is given for total fat, SFA, cholesterol, carbohydrate, dietary fibre and sodium expressed as salt equivalent (salt (g/d) = sodium (g/d) × 58·5/23) (Appendix 2). For these nutrients, energy-adjusted intake levels outside the range of the corresponding DG were considered inadequate(10).
For nutrients with Adequate Intake (AI) such as n-6 PUFA, n-3 PUFA, vitamin D, vitamin E expressed as α-tocopherol, vitamin K, pantothenic acid, potassium, phosphate and manganese, inadequacy of intake cannot be determined even if their intake levels are less than the AI(10, 19). Therefore, for these nutrients only, the energy-adjusted intake levels at or above AI were exceptionally considered as adequate(10).
Assessment of lifestyle variables
Lifestyle variables such as age, gestation, parity, cigarette smoking, dietary change in the past 1 month, current occupation, education and household income were obtained from another questionnaire designed for the present survey. Age was classified into two categories (<30 and ≥30 years); gestation into three categories (<16, 16–27 and ≥28 weeks) following the DRI(10). Parity (0 and ≥1), cigarette smoking (never, former and current), dietary change in the previous 1 month compared with non-pregnancy (none or seldom, slight and substantial), occupation (housewife and outside work), participant’s and partner’s education (<13, 13–14 and ≥15 years) and household income (<4 000 000, 4 000 000–5 999 999 and ≥6 000 000 Japanese yen/year) were assessed.
Physical activity level was obtained from the DHQ, which queried participants about their occupation and leisure-time activity. One answer was chosen from four categories (low, relatively low, moderate and heavy physical activity level), which reference to the Recommended Dietary Allowance for Japanese (23). This classification was revised from four to three categorizations by combining the heavy and moderate levels according to the DRI(Reference Sasaki24). In accordance with the revision, the categories were considered to be level I (low), level II (moderate) or level III (high), and were then used to obtain the EER for the individual(10, Reference Sasaki24). Current supplement use was also obtained from the DHQ.
Statistical analysis
Before analysis, food items were grouped together to reduce complexity. The grouping scheme was generally based on the principles of similarity of nutrient profiles and culinary usage of the foods, mainly according to the food composition tables of Japanese foods(16), and classification of food groups used in the National Nutrition Survey in Japan(25). Of the total 150 food items included in the DHQ, three items (nutritional supplement bars, soup of the noodle and drinking water) were difficult to group or rarely eaten. They were therefore omitted from the study. Finally, 147 food items included in the DHQ were classified into thirty-three food groups (Table 1). To remove the extraneous effect of variables with large variances, we standardized intake of energy-adjusted food group to a mean of zero and standard deviation of one.
Table 1 The thirty-three food groups used in the present study for dietary pattern analysis

*Foods listed were from a self-administered diet history questionnaire.
Cluster analysis was performed using the FASTCLUS procedure in the SAS statistical software package version 9·1 (SAS Institute Inc., Cary, NC, USA)(26). This procedure applies the K-means method to classify participants into a predetermined number of mutually exclusive groups by comparing Euclidean distances between each participant and each cluster centre in an interactive process until no further changes occur. To identify the optimal number of clusters, several runs were conducted varying the number of clusters from two to six. The final cluster solution was selected by comparing the ratio of between-cluster variance to within-cluster variance divided by the number of clusters. Based on these determinations and on the nutritional meaningfulness of clusters, we selected the three-cluster solution as the most appropriate number.
The median differences in the intake of energy-adjusted food groups and nutrients across clusters were examined by the Kruskal–Wallis test. To examine the nutritional inadequacy of nutrient intake of each dietary pattern, we estimated the percentage of participants whose intake was below the EAR or outside the DG. The nutrients with a set AI were excluded from the calculation of the prevalence of inadequacy because no firm conclusion could be drawn on inadequacy if usual intake was less than AI(10, 19). The χ 2 test was used to examine differences between variables expressed as a proportion, such as lifestyle variables and the prevalence of inadequacy.
To assess the overall nutritional inadequacy of each participant, we counted the number of nutrients that did not meet the DRI among fourteen and six nutrients with an EAR and a DG, respectively, in accordance with previous studies(Reference Serra-Majem, Bes-Rastrollo and Roman-Vinas27, Reference Beaudry, Galibois and Chaumette28). The nutrients with an AI were excluded from this analysis because of the reason mentioned above. Therefore, this number ranged from 0 (meeting all twenty DRI recommendations) to 20 (meeting none of the twenty DRI recommendations).
All statistical analyses were performed using SAS statistical software version 9·1 (SAS Institute Inc.). A two-sided P value of 0·05 was considered significant.
Results
Three clusters of dietary pattern were identified (Table 2). We descriptively labelled them (i) ‘meat and eggs’ (n 423; 42·4 %); (ii) ‘wheat products’ (n 371; 37·2 %); and (iii) ‘rice, fish and vegetables’ (n 203; 20·4 %) patterns, based on the food groups predominant in each cluster. The ‘meat and eggs’ pattern was characterized by significantly higher median intakes of beef and pork, processed meat, eggs, coffee and cocoa and dairy products. The ‘wheat products’ pattern was characterized by significantly higher median intakes of bread, noodles, confectioneries, fruit and vegetable juice and soft drinks. The ‘rice, fish and vegetables’ pattern was characterized by significantly higher median intakes of rice, potatoes, pulses, fruit, green and yellow vegetables, white vegetables, pickled vegetables, mushrooms, seaweeds, Japanese and Chinese tea, fish, shellfish, sea products, chicken, miso soup and salt-containing seasonings.
Table 2 Daily energy-adjusted intakes of thirty-three food groups (g/4184 kJ) assessed with a self-administered diet history questionnaire across the three dietary patterns identified among 997 pregnant Japanese women aged 18–43 years

IQR, interquartile range.
*Cluster names were basically based on the food groups with high intakes.
†Kruskal–Wallis test was used to test the median differences across clusters. The highest median values are underlined.
Table 3 shows participant characteristics for non-dietary variables across the three dietary patterns. Participants with the ‘rice, fish and vegetables’ pattern were more likely to be current non-smokers, supplement users and had an older gestational age, higher own education and a partner with higher education than those with other dietary patterns. In contrast, participants with the ‘wheat products’ pattern were more likely to be current smokers, few supplement users and had younger gestational age, lower own education and a partner with lower education. Participants with the ‘meat and eggs’ pattern had intermediate characteristics between those with the ‘rice, fish and vegetables’ and ‘wheat products’ patterns. Age, parity, dietary change, physical activity level, occupation and household income did not differ across the three dietary patterns.
Table 3 Subject characteristics for non-dietary variables across the three dietary patterns identified among 997 pregnant Japanese women aged 18–43 years
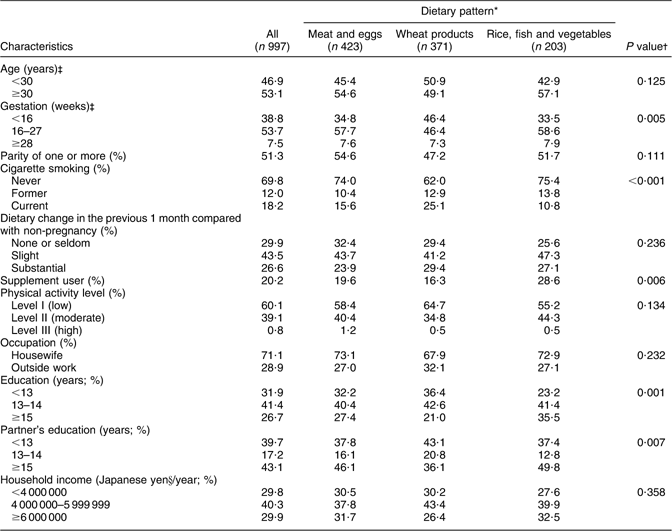
*Cluster names were basically based on the food groups with high intakes.
†χ 2 test was used to test differences between categorical variables.
‡Categorizations were according to the Dietary Reference Intakes for Japanese, 2010(10).
§Japanese yen = 0·0074 Euros = 0·0067 UK pound = 0·0110 US dollars in November 2009.
Table 4 shows the median energy-adjusted nutrient intakes and the prevalences of participants who did not meet the DRI recommendations across the three dietary patterns (Table 4). The ‘meat and eggs’ pattern had significantly higher median intakes of energy, total fat, SFA, cholesterol and n-3 PUFA, but significantly the lowest median intake of carbohydrates. However, the ‘meat and eggs’ pattern showed significantly higher prevalence of inadequacy in these nutrients except for n-3 PUFA among the three dietary patterns. The ‘wheat products’ pattern had significantly higher median intake of carbohydrates, but had significantly lower median intakes of energy and all the nutrients examined. The ‘wheat products’ pattern showed the highest prevalence of inadequacy in dietary fibre and all nutrients with an EAR. In contrast, the ‘rice, fish and vegetables’ pattern had significantly higher intakes of dietary fibre, sodium and all nutrients with an EAR and AI except for n-3 PUFA. The ‘rice, fish and vegetables’ pattern showed significantly lower prevalence of inadequacy in total fat, SFA, dietary fibre and nutrients with an EAR except for vitamin B2 and calcium, but the highest prevalence of inadequacy in sodium. For nutrients with an AI, the median intakes of eight nutrients except vitamin D in the ‘meat and eggs’ pattern, five nutrients (n-6 and n-3 PUFA, vitamin E, vitamin K and manganese) in the ‘wheat products’ pattern and all nine nutrients in the ‘rice, fish and vegetables’ patterns exceeded the recommended levels.
Table 4 Daily energy-adjusted nutrient intakes (unit/4184 kJ) assessed with a self-administered DHQ and prevalence of participants with inadequate nutrient intakes compared with the DRI for Japanese, 2010, using the cut-point method across three dietary patterns identified among 997 pregnant Japanese women aged 18–43 years

DHQ, diet history questionnaire; DRI, Dietary Reference Intakes; IQR, interquartile range; DG, Tentative Dietary Goal for Preventing Lifestyle-related Disease; EAR, Estimated Average Requirement; AI, Adequate Intake; RE, retinol equivalents; NE, niacin equivalents.
*Intakes of energy and all nutrients were significantly different between clusters (P = 0·014 for energy and P < 0·001 for all nutrients; Kruskal–Wallis test). The highest median values are underlined.
†Percentage of participants with values outside the DG or below the EAR. Each energy-adjusted nutrient intake (unit/4184 kJ) estimated by the DHQ was compared with each corresponding energy-adjusted DRI value (unit/4184 kJ), using the cut-point method according to the Japanese DRI, 2010(10). Nutrients with an AI were not examined.
‡χ 2 test was used to examine the difference of prevalence of inadequacy across the three dietary patterns.
§Considering the convenience of the use, the DG of Na is expressed as salt-equivalent [salt (g) = 58·5/23 × Na (g)](10).
||1 μgRE = retinol (μg) + β-carotene (μg) × 1/12 + α-carotene (μg) × 1/24 + β-cryptoxanthin (μg) × 1/24 + other provitamin A carotenoids (μg) × 1/24(10).
¶Niacin equivalents were computed as niacin (mg) + protein (mg)/6000(10).
**Computation was made on α-tocopherol. Vitamin E other than α-tocopherol was not included.
To examine the overall nutritional inadequacy of each dietary pattern, we counted the number of nutrients that did not meet the EAR or DG. A significant difference in overall inadequacy was observed among the three dietary patterns: the median numbers (interquartile ranges) of nutrients not meeting EAR or DG were 10·0 (8·0, 11·0) in the ‘meat and eggs’ pattern, 11·0 (10·0, 12·0) in the ‘wheat products’ pattern and 8·0 (6·0, 9·0) in the ‘rice, fish and vegetables’ pattern (P < 0·001).
Discussion
Nearly all the studies on the identification of dietary patterns of pregnant women have been conducted primarily by using factor analysis(Reference Northstone, Emmett and Rogers29–Reference Cuco, Fernandez-Ballart and Sala33). To the best our knowledge, the present study is the first one to identify the dietary patterns of pregnant women using cluster analysis. We identified three dietary patterns, labelled as the ‘meat and eggs’, ‘wheat products’ and ‘rice, fish and vegetables’ patterns, from a validated dietary assessment questionnaire among 997 pregnant Japanese women aged 18–43 years. We evaluated the nutritional adequacy of each derived dietary pattern by comparison with the DRI. Our main finding was that participants with the ‘rice, fish and vegetables’ pattern had a better nutritional profile with lower prevalence of inadequacy for many essential micronutrients than participants with the other two dietary patterns.
Cluster analysis explores the categorization of participants into groups on the basis of similarity in food intake. It is a useful method for focusing attention on groups with good or poor nutritional status. The participants with the ‘rice, fish and vegetables’ pattern had the lowest prevalence of inadequacy for the intake of many nutrients compared with participants with the other dietary patterns but, owing to higher intake of pickled vegetables, salty fish and salt-containing seasonings, they had a significantly higher prevalence of inadequacy for sodium (97·0 %; Table 4). The participants with the ‘meat and eggs’ pattern had the highest prevalence of inadequacy for total fat and SFA v. the other dietary patterns, whereas those with the ‘wheat products’ pattern had the highest prevalence of inadequacy for almost all nutrients except for carbohydrates. The food items of the ‘rice, fish and vegetables’, ‘meat and eggs’ and ‘wheat products’ patterns identified by cluster analysis in the present study were comparable with those of ‘health-conscious’, ‘processed’ and ‘confectionery’ patterns, respectively, identified by principal component analysis among pregnant women from South-West England(Reference Northstone, Emmett and Rogers29). The nutrients related to each dietary pattern were also similar between the patterns in the present and the previous study(Reference Northstone, Emmett and Rogers29). Similarity was also seen for the above-mentioned three dietary patterns in the present study with ‘healthy’, ‘traditional meat’ and ‘fast foods’ patterns, respectively, in pregnant Finnish women(Reference Arkkola, Uusitalo and Kronberg-Kippila31). These results suggest that the dietary pattern high in vegetables, fruit, pulses, fish and dairy products is associated with high intake of protein and several key vitamins and minerals regardless of the analytic methods for identifying dietary patterns.
Several previous studies have reported that the ‘healthy’ or ‘health-conscious’ pattern in pregnant women is positively associated with higher educational levels, owner-occupied housing, fewer financial difficulties, older age and less smoking(Reference Northstone, Emmett and Rogers30–Reference Brantsaeter, Haugen and Samuelsen32). In contrast, the ‘fast food’ dietary pattern shows a positive association with smoking(Reference Arkkola, Uusitalo and Kronberg-Kippila31). Consistent with the previous studies(Reference Northstone, Emmett and Rogers30–Reference Brantsaeter, Haugen and Samuelsen32), the participants with the ‘rice, fish and vegetables’ pattern had higher own and partner education levels, used more dietary supplements and smoked less, whereas those with the ‘wheat products’ pattern had the opposite characteristics (Table 3). These results suggest that participants with higher sociodemographic status and favourable health-related characteristics tend to choose healthy foods.
Although the assessment of nutritional adequacy was focused on the dietary pattern, we should also give attention to specific fundamental nutrients during pregnancy such as folate, B vitamins, iron and zinc. More than half of all participants were at risk of inadequate intake of several nutrients such as dietary fibre, vitamin B1, vitamin B6, folate, magnesium, iron, zinc, total fat, SFA and sodium (Table 4). Similar results have been observed in other studies focusing on nutrient intake level conducted in Portugal(Reference Pinto, Barros and dos Santos Silva22), South-East Asia(Reference Seshadri3), rural China(Reference Cheng, Dibley and Zhang4) and Japan(Reference Takimoto, Mito and Umegaki5, Reference Mito, Takimoto and Umegaki34), but not in Greece(Reference Petrakos, Panagopoulos and Koutras6). Dietary education is therefore needed, not only for specified participants with an unfavourable dietary pattern but for all pregnant women.
In the present study, nutritional adequacy was examined using the DRI for Japanese as a temporal gold standard. The basic concept of the Japanese DRI is similar to the US and Canadian DRI(19), especially for the definition of each DRI such as EAR, RDA, AI, Tolerable Upper Intake Level and EER (Appendix 1). However, some nutrients were set for different DRI between the two (US/Canadian and Japanese) recommendations. In addition, the DG was defined for the prevention of chronic disease in the Japanese DRI instead of the AMDR defined by the US and Canadian DRI, which is the most remarkable difference between the two DRI. Therefore, data on nutritional adequacy with different nutrient recommendations should be compared cautiously.
Several limitations of the present study warrant mention. First, the response rate for the 627 women living in Neyagawa City was only 17·2 %, whereas that for the remaining 375 living in other municipalities could not be calculated because of the unavailable exact number of eligible participants. Moreover, the survey area was restricted to a single prefecture in Japan. Therefore, the participants were likely not representative of pregnant Japanese women. Second, although we used a validated dietary assessment questionnaire, its ability to estimate dietary intake remains a serious concern. In addition, we might not capture the within-person variation of intake because of only one measurement of diet. Incompleteness of assessment could not be ruled out. Therefore, the results should be interpreted with caution. Furthermore, misreporting of self-reported food intake is a source of measurement error, particularly under-reporting rather than over-reporting(Reference Livingstone and Black35). To minimize the influence of under-reporting(Reference Murakami, Sasaki and Takahashi17), we used energy-adjusted values. Third, we did not include nutrient intake from dietary supplements in the analysis because of the lack of a reliable composition table for such items in Japan. Fourth, because body weight before pregnancy was not obtained, we could not evaluate dietary quality from the standpoint of energy requirement during pregnancy by BMI or body weight gain. Fifth, the study included participants with various gestational ages (5–39 weeks). However, some previous longitudinal studies reported a relative consistency of dietary habits throughout the pregnancy period(Reference Cuco, Fernandez-Ballart and Sala33, Reference Crozier, Robinson and Godfrey36). Sixth, the number of nutrients that did not meet the DRI was counted equally to evaluate the overall inadequacy of nutrient intake of each dietary pattern. Although the contribution to overall nutritional quality might be different across nutrients, the evidence to determine the weighting coefficients of each nutrient was insufficient at the present time. The results should therefore be interpreted very cautiously. Finally, because the reliability of the DRI for individual nutrients is dependent on the state of the science for each nutrient(10), misclassification of participants by nutrients might therefore have been unavoidable.
In conclusion, we examined the nutritional adequacy of dietary patterns identified by cluster analysis in pregnant Japanese women. A diet high in rice, vegetables, potatoes, pulses, fruit, mushrooms, seaweed, fish, shellfish and miso soup showed a better profile of overall nutrient intake. Further studies in various populations are required to confirm these results.
Acknowledgements
The present study was supported by a Grant-in-aid (13770206 and 16790351) for Scientific Research from the Ministry of Education, Culture, Sports, Science and Technology; Health and Labour Sciences Research grants; Research on Allergic Disease and Immunology from the Ministry of Health, Labour and Welfare; and a Grant-in-aid for JSPS Fellows (21-3370) from the Japan Society for the Promotion of Science. None of the authors had any personal or financial conflict of interest to declare. H.O. conducted the statistical analyses and wrote the manuscript. Y.M. and S.S. contributed to the planning of the OMCHS and data collection and assisted in manuscript preparation. K.T. contributed to data collection. K.M. assisted in manuscript preparation. Y.H. supervised the design and execution of the OMCHS. All authors contributed to and approved the final manuscript. The authors thank the Neyagawa City Government, Hirakata City Government, Katano City Government, Shijonawate City Government, Kaizuka City Government, Takaishi City Government, Hannan City Government, Neyagawa City Medical Association, Hirakata City Medical Association and Kadoma City Medical Association for their valuable support.
Appendix 1
Brief comparison of DRI between the USA/Canada and JapanFootnote *

DRI, Dietary Reference Intake; EAR, Estimated Average Requirement; AI, Adequate Intake; UL, Tolerable Upper Intake Level; AMDR, Acceptable Macronutrient Distribution Range; DG, Tentative Dietary Goal for Preventing Lifestyle-related Disease; EER, estimated energy requirement; PAL, physical activity level.
* Nutrients set for DRI presented in this table are for ≥1-year-olds(10,19).
† Nutrients set only for the US and Canadian DRI; nutrients set for different DRI between the USA and Canada and Japan are underlined.
‡ UL for folate and Mg were defined as intake from other than normal foods.
§ Considering the convenience of the use, the values are expressed as salt-equivalent [salt (g) = 58·5/23 × Na (g)].
The basic concept is similar between Japanese and the US and Canadian DRI, especially for definition of each dietary reference index such as EAR, RDA, AI, UL and EER. However, AMDR was not defined in the Japanese DRI. Instead of AMDR, DG was defined for the prevention of chronic disease.
Appendix 2
DRI for pregnant Japanese women aged 18–49 years

DRI, Dietary Reference Intake; EER, estimated energy requirement; PAL, physical activity level; DG, Tentative Dietary Goal for Preventing Lifestyle-related Disease; EAR, Estimated Average Requirement; RE, retinol equivalent; NE, niacin equivalent; AI, Adequate Intake.
*The reference values of each nutrient for pregnant women are calculated by adding the increment of each nutrient during pregnancy to the corresponding reference values for non-pregnant women.
†Gestational age was classified into three categories according to the DRI for Japanese(10).
‡The values in parentheses are given in kcal. 1 kcal = 4·184 kJ.
§1 μgRE = retinol (μg) + β-carotene (μg) × 1/12 + α-carotene (μg) × 1/24 + β-cryptoxanthin (μg) × 1/24 + other provitamin A carotenoids (μg) × 1/24(10).
||Niacin equivalents were computed as niacin (mg)+protein (mg)/6000(10).


