


A substantial part of the foodstuffs we now consume have been industrially processed( Reference Slimani, Deharveng and Southgate 1 – Reference Moubarac, Claro and Baraldi 3 ). The concept of industrial food processing refers to all methods and techniques used by the food and drink industry to turn whole foods into food products( Reference Moubarac, Claro and Baraldi 3 , Reference Monteiro, Levy and Claro 4 ). Industrial processing aims to increase shelf-life, palatability and transportability of foods, and often lowers the nutritional quality while also increasing energy density( Reference Stuckler and Nestle 2 ). Industrially produced foods referred to as ultra-processed products include ready-made snacks and sweets, soft drinks, ready-to-eat/heat products and junk food( Reference Moubarac, Claro and Baraldi 3 – Reference Moubarac, Parra and Cannon 5 ).
Industrially processed products currently make up 75 % of world food sales( Reference Stuckler and Nestle 2 , Reference Moodie, Stuckler and Monteiro 6 ). Ultra-processed foodstuffs dominate the food supply of high-income countries( Reference Monteiro, Moubarac and Cannon 7 ), with relative growth being highest in the emerging markets of low- and middle-income countries( Reference Moodie, Stuckler and Monteiro 6 , Reference Monteiro and Cannon 8 ). Important drivers of this development are big transnational food and drink corporations, aggressive marketing, demographic shifts including increased female labour-force participation and delayed marriage, and changes in food behaviours such as less frequent family meals and increased snacking( Reference Moodie, Stuckler and Monteiro 6 , Reference Monteiro and Cannon 8 , Reference Smith, Ng and Popkin 9 ).
The health impact of the recent dominance of industrially processed foods in the diet remains uncertain as not enough epidemiological and intervention studies specifically designed for this purpose have been carried out( Reference Slimani, Deharveng and Southgate 1 ). Nevertheless, conclusive evidence does exist for some specific processed foods: sugar-sweetened beverages are a major contributor to childhood obesity, weight gain, CVD and type 2 diabetes; industrially produced trans fats present in processed foods negatively affect cardiovascular health; and processed meats are associated with increased risk of mortality (CVD and cancer related) and some types of cancers( Reference Hu 10 – Reference Bendsen, Christensen and Bartels 24 ). Furthermore, observational studies have found processed junk food to be positively associated with energy intake, weight gain and insulin resistance( Reference Pereira, Kartashov and Ebbeling 25 – Reference Bowman and Vinyard 27 ).
The current study aimed to investigate the consumption of ultra-processed products in Sweden from 1960 onwards and to see whether such changes were reflected in the national obesity statistics for the same time period.
Methods
Data overview
To clarify trends in processed food intake and obesity in Sweden, we pooled data from several sources; see Table 1 for an overview of data sources.
Table 1 Overview of data sources on food consumption and purchases and prevalence of overweight and obesity in Sweden

Food consumption
Data concerning direct food consumption in Sweden from 1960 onwards were obtained from the Swedish Board of Agriculture. The most recent data available at the time of latest data extraction (November 2013) were for 2010. The statistics of direct consumption presented by the Board of Agriculture are based on availability data and refer to the total quantity of food that reaches private households, restaurants and catering establishments, including those of public facilities such as schools and hospitals. Amounts consumed directly by producers are also included( Reference Eidstedt and Christina 28 ).
Calculation and estimation methods vary for different food groups but are based mainly on national production and trade, with adjustments made for produce that is processed into other foods (e.g. meat that is used in the production of sausages, canned beef, etc.). Waste during storage and retail is accounted for, while household waste is not. Food is considered as consumed in the same calendar year it reaches consumers. Foods consumed are displayed in kilograms or litres per capita and reported in the form delivered to consumers, e.g. as fresh produce, frozen products or ready-made meals( Reference Eidstedt and Christina 28 ).
Data are classified according to the food’s original nature (i.e. as vegetables, meats, fats and oils, etc.) and each group is further divided into subgroups (e.g. the category of fats and oils is separated into butter, margarine, spreads, low-fat spreads and oils). Based on estimated consumption, the Swedish National Food Agency calculates per capita intake of energy, macronutrients and selected micronutrients. Data on the nutritional value of the per capita intake of foods are available only at the aggregation level of the food’s original nature, and not separately for the different subgroups. Before 1993 calculations were performed by the Swedish Board of Agriculture( Reference Eidstedt and Christina 28 ).
There are no data on consumption of legumes such as beans and lentils. Also, consumption of fresh fish and seafood is not reported from the year 2000 onwards as estimates were considered too unreliable by the Swedish Board of Agriculture (reasons not reported).
Household food spending
Information regarding household spending on food consumed within and outside the home was retrieved from Statistics Sweden’s official database. The data are collected within the national Household Budget Surveys carried out by Statistics Sweden every third year. The survey includes 4000 randomly selected households representative of the Swedish population with regard to geographical living area, income groups, household size and age groups. Data collection includes three interviews and registration of all expenses for a two-week period, and is performed throughout the entire year to avoid seasonal bias( 29 , 30 ). Data in the current paper refer to the mean spending of all households. Data on expenditures on food consumed within and outside the household were available for years 1978–2009. Data collected in 2003–2009 specify spending according to type of food while data for previous years distinguish only between foods consumed within and outside the home.
Obesity and overweight
In order to present a comprehensive and complete picture of overweight and obesity in Sweden, we pooled data from the peer-reviewed literature, the nationwide database of Statistics Sweden and the WHO Global Health Observatory Data Repository( Reference Berg, Rosengren and Aires 31 – Reference Kark and Rasmussen 37 ). Data of interest were mean BMI, as well as prevalence of overweight (BMI≥25·0 kg/m2) and obesity (BMI≥30·0 kg/m2). We were not able to find any data on BMI or obesity before the year 1969.
Data analysis
The data set was classified according to the NOVA system, which is based on the extent and purpose of applied industrial food processing(5). Characteristics of the NOVA classification system are provided in Table 2.
Table 2 Food classification according to extent and purpose of industrial food processing. Characteristics of each food group and examples of included foodstuffs
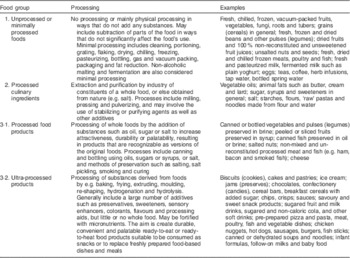
The original food groups and subgroups were coded as group 1 (unprocessed or minimally processed foods), group 2 (processed culinary ingredients), group 3·1 (processed food products) or group 3·2 (ultra-processed products) items. Group 3·1 and 3·2 combined are referred to as group 3 items (ready-to-consume products). A list of the foods included in each category is provided in the online supplementary material, Supplemental Table 1. The reclassified data were thereafter analysed to describe relative and absolute changes in consumption. For comparative purposes we also performed analyses with groups 3·1 and 3·2 combined, as several previous publication have used an earlier version of the NOVA system that does not separate between these groups( Reference Moubarac, Claro and Baraldi 3 , Reference Moubarac, Martins and Claro 38 , Reference Tavares, Fonseca and Garcia Rosa 39 ). Alcoholic beverages were analysed separately.
Correct classification according to degree of processing was not possible when subgroups in the original data contained a mix of group 1, 2 and 3 foods. The category of fermented dairy products includes both natural (group 1) and flavoured products (group 3). As Swedes traditionally consume unflavoured fermented dairy products, in particular buttermilk (filmjölk), this category was assigned to group 1. Mustard (group 3·2) is reported in the category of spices (group 2) and was therefore classified as a processed culinary ingredient. Natural fruit and vegetable juices (group 1) could not be separated from sweetened juices or fruit punches (group 3·2), for which all were classified as ultra-processed food products. Finally, the category of almonds and nuts was allocated to group 1 although it includes both natural (group 1) and toasted and salted varieties (group 3·1).
Furthermore, trends in energy and macronutrient intakes as well as in household expenses on food for home consumption and eating outside the home were investigated. Data on mean BMI, overweight and obesity from different sources were compiled into charts according to sex and age.
Results
Trends in food consumption according to degree of industrial processing
Trends in per capita consumption of group 1, 2, 3·1 and 3·2 foods in Sweden from 1960 to 2010 are shown in Fig. 1. During this period consumption of unprocessed and minimally processed foods (group 1) decreased by 2 % (397 v. 387 kg/capita per annum) and consumption of processed culinary ingredients (group 2) decreased by 34 % (69 v. 45 kg/capita per annum). In contrast, the consumption of processed food products (group 3·1) increased by 116 % (23 v. 51 kg/capita per annum) and the consumption of ultra-processed products (group 3·2) rose by 142 % (125 v. 302 kg/capita per annum). The relative increase of group 3 foods combined was 138 % (148 v. 352 kg/capita per annum).

Fig. 1 Annual per capita consumption (kilograms or litres) of food and non-alcoholic beverages in Sweden, 1960–2010, according to degree of industrial food processing by the NOVA framework
The largest relative increase among ultra-processed products occurred for ready-made soups and sauces (1147 %), with an annual per capita consumption of 21 litres in 2010 compared with 1·8 litres in 1960 (Fig. 2(a)). Intake of carbonated sugar- or artificially sweetened sodas and ciders rose by 315 %, from 22 to 92 litres/capita per annum. Thus, the increase of soft drinks alone accounted for 40 % of the absolute increase in consumption of ultra-processed products between 1960 and 2010. Simultaneously, the consumption of juices and other non-carbonated sweet fruit drinks rose by 342 %, from 3·7 to 16·2 litres/capita per annum. Consumption of all sweet drinks combined peaked in 2002 at 119 litres/capita and declined slightly thereafter, reaching 109 litres/capita in 2010 (Fig. 3(a)).

Fig. 2 Annual per capita consumption (kilograms or litres) of selected group 1, 2, 3·1 and 3·2 foods in Sweden for years 1960–2010. (a) Ultra-processed products (group 3·2): ‘breads and baked goods’ include all types of breads, pizza, pastries, cookies, cakes and biscuits; ‘potato products/dishes’ include refrigerated, frozen and dehydrated products such as ready-made potato-salad, frozen French fries and instant mashed potato mixes; ‘soda’ refers to caloric and non-caloric flavoured carbonated beverages such as colas, diet sodas and ciders; ‘soups and sauces’ refer to ready-made refrigerated, frozen, canned and dehydrated soups and sauces; ‘sweet and savoury snack foods’ include potato and corn crisps, popcorn, candies, chocolate, ice cream and chocolate milk. (b) Processed food products (group 3·2): ‘cheese’ includes hard and soft varieties, both fresh and cured; ‘canned/pickled vegetables’ refer to vegetables that have been pickled or canned in brine; ‘canned fruits’ refer to fruits canned in syrup; ‘canned/pickled fish’ refer to fish and seafood that have been pickled and/or canned, salted or smoked; ‘non-mixed cold cuts/canned meats’ refer to items such as ham and canned meats. (c) Unprocessed and minimally processed foods (group 1): data refer to fresh and frozen meat, fish, vegetables, fruits and berries; fresh milk including whole-fat, semi-skimmed and skimmed varieties; fresh eggs; fresh potatoes; minimally processed grains including rice, oatmeal and other cereals. (d) Processed culinary ingredients: ‘starches’ include uncooked pasta and noodles, flours, cake and bread mixes, cereal-based formula mixes and potato starch; cream and sour cream; ‘fats and oils’ include butter and plant oils; ‘sugar and treacle’ include brown sugar

Fig. 3 (a) Annual per capita consumption (litres) of alcohol and caloric/non-caloric sweet beverages in Sweden, 1960–2010. (b) Mean daily per capita energy intake (kJ) in Sweden, 1960–2010. (c) Relative contribution of macronutrients to total energy intake (E%) in Sweden, 1960–2010. (d) Average annual household expenditure (Swedish krona, SEK) on food products and away-from-home eating in Sweden, 1978–2009
Furthermore, the consumption of sweet and savoury snack foods such as candies, chocolate and crisps/potato chips increased by 367 % during the study period, from 7·4 kg to 34·5 kg/capita per annum. Intake of ready-made potato dishes such as frozen French fries and instant mashed potatoes also increased substantially (374 %; 0·2 v. 9·6 kg/capita per annum). Consumption of breads and baked goods including pizza, cookies and biscuits rose by 38 % (67 v. 78 kg/capita per annum; Fig. 2(a)). Ultra-processed meat products and ready-made dishes containing meat increased by 66 %, from 17 to 28 kg/capita per annum (data not shown). Intake of ultra-processed fruit products such as jams and jellies increased by 158 %, from 3·0 to 7·8 kg/capita per annum (data not shown).
Intake of all processed food products (group 3·1) increased during the study period (Fig. 2(b)). The largest increases in this group were seen for consumption of canned and/or pickled vegetables (246 %; 4·5 v. 11·7 kg/capita per annum) and cheese (159 %; 7·4 v. 19 kg/capita per annum). Consumption of canned fruits increased by 65 % (2·2 v. 3·6 kg/capita per annum) and intake of canned, pickled and smoked fish and seafood increased by 53 % (4·5 v. 6·8 kg/capita per annum). The lowest relative increase was seen for non-mixed cold cuts such as ham and canned meats (13 %; 4·8 v. 5·5 kg/capita per annum).
Consumption of fresh/frozen fruits, berries and vegetables, minimally processed cereals and fresh/frozen meat and fish all increased during the study period (Fig. 2(c)). There was an increased annual consumption of fermented dairy products (325 %; 7·7 v. 32·7 litres/capita) and nuts (140 %; 1·1 v. 2·7 kg/capita; data not shown). In contrast, intake of fresh potatoes decreased by 50 % (from 86·8 to 43·3 kg/capita per annum) and milk consumption declined by 41 % (from 158·3 to 93·7 litres/capita per annum). Egg consumption decreased minimally, from 10·8 to 10·6 kg/capita per annum (−2 %), while consumption increased for honey (133 %; 0·3 v. 0·7 kg/capita per annum) and coffee and tea (14·5 %; 8·3 v. 9·5 kg/capita per annum).
Among processed culinary ingredients (Fig. 2(d)) the most significant decline in consumption occurred for sugar and treacle (−76 %; 29·0 v. 6·9 kg/capita per annum). Intake of fats and oils decreased by 60 % and consumption of starches including flours and pastas declined by 6 %. In contrast, consumption of cream and sour cream increased by 90 %, reaching 10·6 litres/capita in 2010. Consumption of salt and spices increased by 13 %, from 3·1 kg to 3·5 kg/capita per annum (data not shown).
Intake of alcoholic beverages (Fig. 3(a)) rose by 67 % between 1960 and 2010 (46·3 v. 77·3 litres/capita) mostly due to greater consumption of wine (623 %; 3·3 v. 23·7 litres/capita). Beer consumption rose by 36 % (37·2 v. 50·7 litres/capita) while liquor consumption fell by 50 % (5·7 v. 2·9 litres/capita).
Trends in energy intake
Daily per capita energy intake, as estimated from the direct consumption of food, increased by 15 % from 11 800 MJ (2820 kcal) in 1960 to 13 600 MJ (3250 kcal) in 2010 (Fig. 3(b)). Relative energy from carbohydrates decreased from 55 % to 46 % of total energy, while percentage of energy from protein and fat increased (from 12 % and 33 % to 14 % and 36 %, respectively; Fig. 3(c)). Alcohol provided 3 % of daily energy from 1985 onwards.
Trends in household food expenses
Total average annual household food expenses increased between 1978 and 2010 (Fig. 3(d)). However, the relative spending on food decreased from 20 % of total household expenditures in 1985 to 13 % in 2009. In parallel, the spending on meals outside the home (e.g. at restaurants, cafeterias and fast-food establishments) increased from 10 % of total food expenses in 1985 to 23 % in 2009( 29 ).
Trends in overweight and obesity
Figure 4(a)–(f) describes overweight (BMI≥25·0 kg/m2) and obesity (BMI≥30·0 kg/m2) prevalence and mean BMI for Swedish adults from 1980 to 2010. In 1980, 35 % of Swedish men had a BMI≥25·0 kg/m2 and 4·5 % were obese( 35 ). In 2008 the corresponding figures were 54–56 % and 11 %, respectively( Reference Neovius, Johansson and Kark 33 , 35 ). During the same period prevalence of overweight among females increased from 26 % to 39 % while obesity among women rose from 5 % to 10 %( 35 ). In parallel, mean BMI increased from 24·8 to 26·7 kg/m2 for men and from 24·6 to 25·5 kg/m2 for women( 35 ).

Fig. 4 Overweight and obesity in Sweden. (a) Prevalence of overweight (BMI≥25·0 kg/m2) among adult men in Sweden, 1980–2010. (b) Prevalence of overweight (BMI≥25·0 kg/m2) among adult women in Sweden, 1980–2010. (c) Prevalence of obesity (BMI ≥30·0 kg/m2) among adult men in Sweden, 1980–2010. (d) Prevalence of obesity (BMI≥30·0 kg/m2) among adult women in Sweden, 1980–2010. (e) Mean BMI of adult men in Sweden, 1980–2010. (f) Mean BMI of adult women in Sweden, 1980–2010. (g) Mean BMI of male conscripts in Sweden, 1969–2005. (h) Prevalence of overweight and obesity among male conscripts in Sweden, 1969–2005
From 1970 to 2000, the prevalence of overweight (BMI=25·0–29·9 kg/m2) among Swedish conscripts more than doubled (6·6 % v. 13·6 %) while obesity prevalence increased from 1·0 % to 3·5 % (Fig. 4(g) and (h))( Reference Kark and Rasmussen 37 ). Moreover, between 1970 and 2000 average BMI rose from 20·9 to 22·5 kg/m2, and there was a tenfold increase in morbid obesity (BMI≥35·0 kg/m2) from 1969 to 2005 (0·1 % v. 1·3 %)( Reference Neovius, Teixeira-Pinto and Rasmussen 34 , Reference Kark and Rasmussen 37 ).
Discussion
Main findings
The current study provides a unique description of changes in industrially processed food consumption in Sweden from 1960 until 2010. While consumption of minimally processed foods was unchanged during the study period, consumption of ready-to-consume products (group 3) rose considerably. In particular, there was a remarkable increase in the intake of ultra-processed products (group 3·2), clearly showing the transition from eating freshly prepared meals from nutritious foods to ready-to-consume ultra-processed products that are nutritionally imbalanced.
In parallel, adult overweight and obesity rates rose significantly, with notable increases in severe obesity. While causation cannot be proven through ecological time-trend data, the current study nevertheless supports a link between the much-increased intake of ultra-processed products and the obesity epidemic.
Previous studies
Previous reports have documented the increased presence of ready-to-consume products (group 3 items) in the global food system and diet, particularly in the form of ultra-processed products. By analysing data from nationally representative food expenditure surveys Moubarac et al. found that ready-to-consume products on average contributed 61·7 % of daily energy in Canada, with ultra-processed products accounting for 54·9 % of daily energy( Reference Moubarac, Batal and Martins 40 ). In Brazil, mean energy percentage from ultra-processed products increased from 18·7 % in 1987 to 29·6 % in 2009, according to national household survey data( Reference Martins, Levy and Claro 41 ). In Northern and Central Europe, 50–56 % of daily energy is consumed in the form of highly processed foodstuffs (using a slightly different definition than the current paper: ‘Foods that have been industrially prepared, including those from bakeries and catering outlets, and which require no or minimal domestic preparation apart from heating and cooking’)( Reference Slimani, Deharveng and Southgate 1 ).
Due to the low price of vegetable oils, fats, starches, sugars and salt, ultra-processed products are highly profitable for food producers and available to consumers at a low cost, which, along with aggressive marketing, including to children, contributes to the high consumption( Reference Monteiro 42 ). Over time, price disparity between healthy unprocessed or minimally processed whole foods and ultra-processed products has increased, making a diet of fruit, vegetables, fish and meat more expensive than one high in refined grains, added sugar and added fats( Reference Drewnowski 43 , Reference Monsivais and Drewnowski 44 ).
Implications for public health
Ultra-processed products and diets based on such items tend to be unhealthy and unbalanced: excessive in fat (including saturated and trans fat), free sugars and sodium while low in dietary fibre, micronutrients and phytochemicals( Reference Monteiro, Levy and Claro 4 , Reference Moubarac, Martins and Claro 38 , Reference Astrup, Dyerberg and Selleck 45 , Reference Ludwig 46 ). Moubarac et al. found that compared with the population quintile with the lowest consumption of group 3 items (33·2 % of total energy), the diet of those in the highest quintile (84·5 % of total energy) was significantly lower in protein (11·6 v. 14·9 %) and fibre (8·0 v. 11·2 g/4184 kJ (1000 kcal)), higher in fat (38·2 v. 35 %), free sugars (9·2 v. 15 %) and sodium (1·1 v. 1·6 g/4184 kJ), and more energy dense (7·5 v. 9·6 kJ/g (1·8 v. 2·3 kcal/g))( Reference Moubarac, Martins and Claro 38 ).
Likewise, consumption of foods from outside-the-home sources is associated with higher energy intakes, lower nutritional quality and weight gain( Reference Nielsen, Siega-Riz and Popkin 47 – Reference Thompson, Ballew and Resnicow 51 ). A study in Guatemala found that each 10 % increase in the share of the household food budget spent on highly processed foods was associated with a 4·3 % higher BMI of family members and greater risk of overweight and obesity( Reference Asfaw 52 ). In a cross-sectional study of 210 Brazilian adolescents, intake of ready-to-consume products (group 3) was significantly associated with presence of the metabolic syndrome( Reference Tavares, Fonseca and Garcia Rosa 39 ). More recent studies differentiating between processed food products (group 3·1) and ultra-processed products (group 3·2) suggest that it may in particular be the consumption of the latter that is associated with negative health effects. In a nationally representative sample of the Brazilian population, Canella et al.( Reference Canella, Levy and Martins 53 ) observed significant and positive associations between household availability of ultra-processed products (group 3·2), expressed as quartiles of dietary energy availability, and average BMI and prevalence of excess weight and obesity. Processed food products (group 3·1) availability, on the other hand, was not associated with obesity outcomes( Reference Canella, Levy and Martins 53 ). Similarly, increased consumption of ultra-processed products such as sugar-sweetened beverages, potato chips, French fries, processed meats and refined grains was strongly and positively associated with weight gain in a large US prospective study. In contrast, there was an inverse association between weight gain and increased intake of vegetables, fruits, nuts, yoghurt and whole grains( Reference Mozaffarian, Hao and Rimm 54 ).
Studies have found Western-style dietary patterns, high in refined and ultra-processed products such as soft drinks, processed meat products, fast food including hamburgers, pizza and French fries, refined breads and pastries, and sweet and savoury snack foods, to be associated with inferior quality of life, depression and anxiety, and with mental health problems in adolescents( Reference Ruano, Henriquez and Martinez-Gonzalez 55 – Reference Jacka, Kremer and Berk 59 ). Some authors argue that foods highly refined by industrial processing may be addictive and cause substance abuse-like conditions( Reference Larson, Perry and Story 60 ). In contrast, observational studies link cooking and eating meals prepared from whole foods with higher intakes of fruit, vegetables and whole grains, increased survival, better overall health and lower BMI( Reference Larson, Perry and Story 61 – Reference Chen, Lee and Chang 66 ).
Potential mechanisms behind increased consumption of ultra-processed foods and obesity
Ultra-processed products are omnipresent, convenient and aggressively marketed, which has been shown to increase frequent snacking, eating while watching television or working and intake of liquid energy in large quantities (e.g. sodas)( Reference de Graaf 67 – Reference Mattes 70 ). Presumably, the high energy density and palatability of ultra-processed products( Reference Monteiro, Levy and Claro 4 , Reference Moubarac, Martins and Claro 38 , Reference Astrup, Dyerberg and Selleck 45 ), in combination with associated eating behaviours, undermine normal energy homeostasis and appetite control, resulting in overconsumption and increasing the likelihood of obesity( Reference Ludwig 46 , Reference Monteiro, Levy and Claro 70 ).
Processing allows foods to be eaten faster, which leads to lower satiation and higher energy intakes as the short oral sensory exposure time provides insufficient cues for satiation( Reference de Graaf 67 ). Furthermore, diets high in ultra-processed products may reduce total energy expenditure due to lower diet-induced thermogenesis. In an experimental study average postprandial energy expenditure was 50 % lower after eating highly processed foods, compared with isoenergetic whole foods. The low fibre and nutrient density and high content of simple carbohydrates of ultra-processed products are believed to account for this discrepancy( Reference Barr and Wright 71 ).
An additional concern is the increased cumulative intake of artificial ingredients and additives such as preservatives, colorants, chemical flavorings and non-caloric sweeteners. Consumption of industrially produced trans fats, common in ultra-processed products such as cookies and fried foods, is associated with weight gain and abdominal obesity, and increase the risk of CHD and type 2 diabetes( Reference Astrup, Dyerberg and Selleck 45 ).
Furthermore, observational data link daily intake of artificially sweetened soda with incident metabolic syndrome including obesity, type 2 diabetes, stroke and kidney function decline( Reference Bernstein, de Koning and Flint 72 – Reference Nettleton, Lutsey and Wang 74 ). A recent review suggests that sugar alcohols, artificial sweeteners and fructose may contribute to obesity and metabolic abnormalities by modulating the gut microbiota, leading to enhanced energy extraction, intestinal inflammation and endotoxaemia( Reference Payne, Chassard and Lacroix 75 ).
Research also indicates that monoacylglycerides (preservatives), saccharin (artificial sweetener) and bisphenol A (common in food and beverage containers) may contribute to weight gain by stimulating basal insulin secretion, thereby increasing food intake and insulin resistance( Reference Corkey 76 ). Furthermore, in vitro studies suggest that the food additives sodium sulfite, sodium benzoate and curcumin may promote obesity by decreasing leptin secretion( Reference Ciardi, Jenny and Tschoner 77 ).
Meaning for policy makers
The association between increased consumption of ultra-processed products and obesity warrants further research. Well-designed studies are needed to determine causality and identify potential mechanisms. Given the much-increased consumption of non-natural chemical additives present in ultra-processed products, there is an urgent need to clarify the safety of consuming such products.
Given what is now known about the harms of ultra-processed products, combined with the alarming increase in consumption, national dietary guidelines should dissuade consumption of nutritionally deficient ultra-processed products and emphasize the benefits of nutrient-dense whole foods prepared from scratch. Public food programmes and catering establishments at schools, hospitals and workplaces for example may likewise benefit from minimizing ultra-processed products, which are nutritionally imbalanced and promote unhealthy eating behaviours and overconsumption, in favour of meals and dishes based on freshly prepared foods.
Finally, taxation of ultra-processed products such as sodas, as well as subsidies for healthy whole foods, may contribute to reversing the trend of ever-increasing dependence on ultra-processed products. The marketing of ultra-processed products should also be scrutinized and more strictly regulated.
Strengths and limitations
Strengths of the current investigation include the use of systematically collected, nationwide and long-term trend data. This enabled a unique assessment of secular trends in ultra-processed product consumption in Sweden from a time point before the obesity epidemic started. As data were based on statistics of production and trade there was no recall or report bias. The NOVA framework for food classification according to degree of industrial processing was another advantage as it permitted identification of important changes in consumption patterns that are not evident using traditional food classifications of macronutrients( Reference Monteiro, Levy and Claro 4 ).
However, there are several limitations to the study. An important limitation is that our data refer to food availability and not actual consumption. In consequence, they may not provide a completely accurate reflection of the Swedish diet. In particular, total food consumption was likely overestimated, as spoilage at household level is not accounted for. Because unprocessed and minimally processed foods are more perishable than most processed culinary ingredients, processed food products and ultra-processed products, group 1 foods may account for a larger proportion of household waste and likely more overestimated in relation to group 2, 3·1 and 3·2 items.
Moreover, secular data of per capita intake do not provide information on the diet of individuals or of different population segments. Neither do they allow differentiation of consumption between private households and private and public food outlets. Hence, potential differences in amounts and types of food consumed at home and elsewhere, and among different population groups, cannot be known. In addition, our data were limited to large-scale production sectors and do not include food production from caterers.
Furthermore, data were restricted to weight and volume of foods. Importantly, the energetic and nutritional contribution of foods was specified only according to the major food groups based on food’s original nature. Due to this limitation of the data we were unable to perform analysis regarding the energetic and nutritional contribution of each food group of the NOVA system over time, which would have been preferable. Likewise, data on household spending on food did not distinguish between different types of foods for the majority of the study period. Trends in food expenses for each group of the NOVA system could therefore not be analysed.
Fresh fish and seafood were not reported for the years 2000–2010. Changes in the consumption of these foods can therefore not be determined, which affects the longitudinal comparability of consumption of group 1 foods. Furthermore, the entry of Sweden into the European Union in 1995 affected consumption estimates for some food groups due to changes in the statistics of production and trade and in nomenclature. Other revisions of nomenclature and methodology have also occurred, hampering year-to-year comparability of specific food groups. However, changed allocation of a food from one subgroup to another should not materially affect the current analysis as long as the food remains within the same level of processing, which is likely the case.
Finally, since we did not have access to individual-level data on food and obesity, we were not able to perform an analysis of association with appropriate adjustment for confounding variables.
Conclusion
Consumption of ultra-processed products increased dramatically in Sweden from 1960 to 2010, which closely tracked the increased prevalence of obesity. Of special note is the considerably increased intake of energy-dense and nutritionally empty snack foods such as candies and crisps, and of sodas and other sweet beverages. Future research is needed to clarify the potential role of ultra-processed products in obesity and public health.
Acknowledgements
Financial support: This research received no specific grant from any funding agency in the public, commercial or not-for-profit sector. Conflict of interest: None. Authorship: F.J. was responsible for study conception, data acquisition, analysis and interpretation of the data, drafting of the manuscript, statistical analysis, critical revision of the manuscript for important intellectual content, and had primary responsibility for the final content. E.H. was responsible for analysis and interpretation of the data, statistical analysis, critical revision of the manuscript for important intellectual content, and study supervision. Ethics of human subject participation: Not applicable.
Supplementary material
To view supplementary material for this article, please visit http://dx.doi.org/10.1017/S1368980015000506


