


Childhood overweight and obesity are associated with high prevalence of a number of co-morbidities and psychosocial disadvantages, representing one of the major public health concerns worldwide( Reference Ng, Fleming and Robinson 1 ). While obesity prevalence seems to be levelling off in some countries( Reference Stamatakis, Wardle and Cole 2 , Reference Ogden, Carroll and Kit 3 ), developing countries are experiencing concurrent rapid shifts in diet and activity levels and rising overweight prevalence( Reference Popkin, Adair and Ng 4 ). In addition, population groups with lower education and income levels present a higher obesity burden( Reference Ahrens, Pigeot and Pohlabeln 5 ). As childhood overweight and obesity track into adulthood, the increasing prevalence will entail future community health consequences further increasing the risk of developing non-communicable diseases at younger ages( Reference Park, Falconer and Viner 6 , Reference Reilly and Kelly 7 ).
The childhood overweight epidemic is largely determined by global changes in lifestyle behaviours leading to an imbalance between energy intake (dietary habits) and energy expenditure (BMR and physical activity). Previous research described the most relevant energy balance-related behaviours in children and adolescents, showing that among them, poor dietary habits are linked to worse body composition indicators, especially for specific items such as sugared drinks( Reference Hu 8 ) and fast foods( Reference Rosenheck 9 ). However, examining multiple dietary factors in the context of dietary patterns may better explain the risk of developing overweight and obesity than examining single foods or nutrients.
Dietary pattern analysis has been increasingly applied to assess the relationship between overall diet and the risk of chronic diseases, including obesity( Reference Hu 10 , Reference Ambrosini 11 ). It allows to evaluate the impact of the whole diet, given that foods are consumed in combination. In a previous study, we analysed the prospective associations between socio-economic status and dietary patterns in the IDEFICS (Identification and prevention of Dietary- and lifestyle-induced health EFfects In Children and infantS) study, applying cluster analysis at two points in time( Reference Fernandez-Alvira, Bornhorst and Bammann 12 ). Cluster analysis, one of the most commonly applied methods to derive dietary patterns, clusters individuals into non-overlapping groups that reflect relatively homogeneous dietary patterns within groups and distinct dietary patterns between groups.
Exploring changes in children’s diet over time may help to identify changes in dietary patterns and/or children changing their dietary patterns, thus allowing a better understanding of the impact of diet on body composition. Changes in diet over time and the associations with overweight markers have been previously explored using principal components analysis (PCA)( Reference Mikkila, Rasanen and Raitakari 13 – Reference Oellingrath, Svendsen and Brantsaeter 16 ) and reduced rank regression (RRR)( Reference Johnson, Mander and Jones 17 , Reference Ambrosini, Emmett and Northstone 18 ), but to the best of our knowledge, few studies have examined children’s dietary patterns over time using cluster analysis( Reference Fernandez-Alvira, Bornhorst and Bammann 12 , Reference Northstone, Smith and Newby 19 ) and none of them explored the association with changes in body composition. PCA provides linear combinations of foods instead of referring to identifiable groups of individuals. Applying cluster analysis to describe dietary patterns throughout time allows identifying groups of children with consistently healthy/unhealthy diets, providing further insight into dietary impact on body composition changes.
The present study aims to investigate the associations of dietary patterns obtained by applying cluster analysis to children participating in the baseline and follow-up surveys of the IDEFICS study with changes in body composition including BMI, waist circumference (WC), fat mass index (FMI) and fat-free mass index (FFMI).
Participants and methods
The IDEFICS study is a large multi-centre population-based study of children aged 2–9 years in selected regions of eight European countries (Belgium, Cyprus, Estonia, Germany, Hungary, Italy, Spain and Sweden) including an embedded intervention( Reference Ahrens, Bammann and Siani 20 , Reference Bammann, Peplies and Sjöström 21 ). Two main surveys (baseline (T0) and follow-up (T1)) were conducted in pre-schools and primary school classes (first and second grades at baseline). The baseline survey (September 2007–May 2008) included 16 228 children aged 2–9 years (median age=6·3 years). The follow-up survey (September 2009–May 2010) reached a 68 % overall response and included 11 038 children aged 4–11 years. The follow-up survey was synchronized with the baseline to account for seasonal variation. Details of the general design, instruments and survey characteristics can be found elsewhere( Reference Ahrens, Bammann and Siani 20 , Reference Bammann, Peplies and Sjöström 21 ). The present study includes only children with less than 50 % of missing values in the food frequency data at baseline and follow-up and for whom complete anthropometric information was available (n 8341 children; 49·9 % boys). Excluded participants presented a slightly higher proportion of overweight/obesity and a higher percentage of lower educated parents (see online supplementary material, Supplemental Table 1). The study was conducted according to the Declaration of Helsinki. Each participating centre obtained ethical approval from its health research ethics authority. All children provided oral consent and their parents provided written informed consent for all examinations and for the collection of samples, subsequent analysis and storage of personal data and collected samples.
Measurements
Dietary data
Dietary data were obtained at baseline and follow-up surveys applying the food frequency section of the Children’s Eating Habits Questionnaire–Food Frequency Questionnaire (CEHQ-FFQ)( Reference Huybrechts, Bornhorst and Pala 22 ), a validated screening tool in which the parents report the frequency of the child’s consumption of selected food items during the preceding 4 weeks. The questionnaire referred to meals outside the school canteen or childcare meal provision settings only (i.e. under parental control)( Reference Huybrechts, Bornhorst and Pala 22 , Reference Lanfer, Hebestreit and Ahrens 23 ). The CEHQ-FFQ includes forty-three food items from food groups and was designed as a screening instrument to investigate the consumption of foods shown to be related, either positively or negatively, to overweight and obesity in children, but not to provide an estimate of total energy intake or total food intake( Reference Lanfer, Hebestreit and Ahrens 23 ). Response options displayed from left to right were as follows: ‘Never/less than once a week’; ‘1–3 times a week’; ‘4–6 times a week’; ‘1 time per day’; ‘2 times per day’; ‘3 times per day’; ‘4 or more times per day’; ‘I have no idea’. Only children with <50 % of missing values were taken into account (92·6 % of participants at baseline and 90·2 % at follow-up). Multiple imputation was applied using sex, age, BMI and country as predictors for the remaining missing values.
Anthropometric measurements
Although BMI has been widely reported as an indicator of overweight and obesity due to its simplicity, it is not a perfect indicator of excess body fat( Reference Freedman and Sherry 24 , Reference Javed, Jumean and Murad 25 ). Therefore, other body composition indicators, such as WC for assessing abdominal fat, and FMI and FFMI as indicators of overall fat/lean tissue in relation to total mass, might help to complement BMI when assessing dietary impact on body composition. Trained staff carried out anthropometric measurements at baseline and follow-up following a standardized procedure. Body height was measured without shoes and all plaits undone using a portable stadiometer (model: telescopic height measuring instrument SECA 225) to the nearest 0·1 cm. Weight was measured to the nearest 0·1 kg by means of a child-adapted version of the electronic scale Tanita BC 420 SMA, with the children in fasting status (more than 8 h since last meal) and wearing only underwear( Reference Stomfai, Ahrens and Bammann 26 ). For each child, BMI, BMI categories and Z-scores of BMI and of BMI change over the 2-year follow-up were determined according to age- and gender-specific BMI reference standards according to the criteria proposed by the International Obesity Task Force( Reference Cole and Lobstein 27 ).
WC was measured using a non-elastic tape (Seca 200) at the midpoint between the iliac crest and the lower border of the tenth rib in a standing position to the nearest 0·1 cm. For each child, Z-scores of WC and of WC change over the 2-year follow up were also determined according to age- and gender specific reference standards of the International Obesity Task Force( Reference Cole and Lobstein 27 ).
Skinfold measurements were taken on the right side of the body at the triceps (halfway between the acromion and the olecranon process at the back of the arm) and the subscapular site (about 2 cm below the tip of the scapula at an angle of 45° to the lateral side of the body) with a skinfold calliper (Holtain, range 0–40 mm) to the nearest 0·2 mm. For each child, body fat mass was calculated using the gender-specific Slaughter’s equations. FMI was calculated by dividing body fat mass in kilograms by the square of height in metres. FFMI was calculated by dividing lean mass in kilograms by the square of height in metres. Finally, FMI and FFMI age- and gender-specific Z-scores were derived.
Parental questionnaire variables
During the baseline and follow-up surveys, parents completed a self-administered questionnaire on parental attitudes, children’s behaviour and social environment. Parental education and income were self-reported. Parental education level was categorized according to the International Standard Classification of Education (ISCED-97)( 28 ). Household income was assessed using nine country-specific categories based on the median equivalent income. The gained amount was then equalized to the number of household members using the Organisation for Economic Co-operation and Development’s square root scale( 29 ). Additionally, a migrant background was assumed if one or both of the parents were born in another country. For the purposes of the present analysis, an additive socio-economic status indicator constructed by Bammann et al.( Reference Bammann, Gwozdz and Lanfer 30 ) was used.
To assess physical activity, parents reported how many hours and minutes their child spent playing outdoors on a typical weekday and weekend day during the previous month. In addition, parents reported how many hours and minutes per week the child spent doing sport in a sports club. Finally, total physical activity time was calculated and expressed as h/week.
Statistical methods
In a previous IDEFICS report, k-means cluster analysis was performed to identify clusters of children with similar dietary patterns at baseline and follow-up. The complete procedure and the derived dietary patterns have been described in a previous paper( Reference Fernandez-Alvira, Bornhorst and Bammann 12 ) and are taken into account for the purposes of the present study. Briefly, the authors described three persistent dietary patterns in children (see online supplementary material, Supplemental Tables 2 and 3): (i) ‘processed’ (higher frequency of takeaway and high-fat foods, such as savoury pastries, fritters, pizza as main dish, fried potatoes, hamburger, hot dog, kebab and wraps, and lowest scores for products such as wholemeal bread, cooked vegetables, raw vegetables, and fresh fruits without added sugar); (ii) ‘sweet’ (higher frequency of consumption of sugar-rich products, like chocolate- or nut-based spread, sweetened drinks, fruit juices, diet drinks, candies, loose candies, marshmallows, and biscuits, packaged cakes, pastries and puddings, with the lowest scores for water, porridge, oatmeal, gruel, unsweetened cereals, muesli, raw vegetables, plain unsweetened milk and plain unsweetened yoghurt); and (iii) ‘healthy’ (higher frequency of consumption of low-fat foods, foods rich in vitamins and wholegrain foods, e.g. raw vegetables, fresh fruits without added sugar, porridge, oatmeal, gruel, unsweetened cereals, muesli and plain unsweetened milk, and the lowest values for high-fat, high-sugar products, such as fried potatoes, sweetened drinks, sweetened milk, mayonnaise and mayonnaise-based products, chocolate- or nut-based spread, crisps, corn crisps, popcorn, and biscuits, packaged cakes, pastries and puddings). To assess the changes in dietary patterns over time, children’s cluster memberships at baseline and follow-up were cross-tabulated, showing the proportion of children being allocated to the same or different clusters.
The associations of body composition changes with dietary patterns at baseline (T0) and follow-up (T1) were estimated based on mixed models with random effects for country and setting (school) to account for the clustered study design. Dietary patterns at baseline and follow-up were the predictor variables and gender, age, intervention v. control, socioeconomic status score, physical activity and baseline predictor levels were the covariates. Analogous models were applied for estimating body composition changes according to different dietary pattern combinations (i.e. ‘healthy’, ‘sweet’ or ‘processed’ at both times; ‘processed’ at T0 and ‘healthy’ at T1 (‘processed’–‘healthy’); ‘sweet’ at T0 and ‘processed’ at T1 (‘sweet’–‘processed’); etc.). The statistical significance level was set at P≤0·05. The analyses were performed using the statistical software package IBM SPSS Statistics version 20.0.
Results
Table 1 shows the characteristics of the study sample. Among the total sample, 6·5 % was classified as obese and 12·3 % as overweight, while 10·4 % was classified as underweight. Based on forty-two food items and their relative frequency of consumption, the most prevalent dietary pattern was the ‘processed’ cluster at baseline (n 4076 at T0, n 2360 at T1) while the ‘healthy’ cluster was the most prevalent at follow-up (n 2558 at T0, n 4256 at T1). The ‘sweet’ cluster showed similar numbers at baseline and follow-up (n 1707 at T0, n 1725 at T1). Regarding gender differences, the ‘healthy’ pattern was significantly more prevalent in girls compared with boys. Table 2 presents the mean values of body composition indicators and their standard deviations in the three clusters at baseline and follow-up. The highest BMI Z-score and WC Z-score means were found in the ‘processed’ cluster both at baseline and follow-up. Likewise, the highest FFMI Z-score and FMI Z-score means were found in the ‘processed’ cluster. The lowest values in all four indicators were found in the ‘sweet’ cluster.
Table 1 Characteristics of the study sample: children (n 8341) aged 2–9 years from eight European countries, baseline survey of the IDEFICS (Identification and prevention of Dietary- and lifestyle-induced health EFfects In Children and infantS) study, September 2007–May 2008
P value from χ 2 test and Student t test.
Table 2 Body composition indicators by dietary patterns at baseline (T0, September 2007–May 2008) and follow-up (T1, September 2009–May 2010) among children (n 8341) aged 2–9 years from eight European countries, IDEFICS (Identification and prevention of Dietary- and lifestyle-induced health EFfects In Children and infantS) Study
WC, waist circumference; FFMI, fat-free mass index; FMI, fat mass index.
P value from ANOVA.
Table 3 shows the associations of body composition changes at follow-up with dietary patterns at baseline and follow-up. Taking the ‘healthy’ cluster as reference, being allocated to the ‘processed’ cluster at baseline was associated with larger WC Z-score change (β=0·079; 95 % CI 0·022, 0·135) at follow-up. Being allocated to the ‘processed’ cluster at follow-up was also associated with larger BMI Z-score change (β=0·039; 95 % CI 0·006, 0·071) and larger FMI Z-score change (β=0·045; 95 % CI 0·016, 0·073) at follow-up. Taking again the ‘healthy’ cluster as reference, being allocated to the ‘sweet’ cluster at baseline was associated with larger WC Z-score gain (β=0·078; 95 % CI 0·006, 0·151) at follow-up, while being allocated to the ‘sweet’ cluster at follow-up was associated with larger BMI Z-score gain (β=0·053; 95 % CI 0·014, 0·091), larger WC Z-score gain (β=0·098; 95 % CI 0·034, 0·161) and larger FMI Z-score gain (β=0·041; 95 % CI 0·006, 0·075) at follow-up.
Table 3 Body composition change estimates by dietary patterns at baseline (T0, September 2007–May 2008) and follow-up (T1, September 2009–May 2010) among children (n 8341) aged 2–9 years from eight European countries, IDEFICS (Identification and prevention of Dietary- and lifestyle-induced health EFfects In Children and infantS) Study
IOTF, International Obesity Task Force; WC, waist circumference; FFMI, fat-free mass index; FMI, fat mass index; Ref., reference category.
Mixed models with body composition parameters as the outcome with random effects for country and setting, dietary pattern at T0, T1 or both as predictor variables, and gender, age, intervention v. control, socio-economic status score, physical activity level and baseline predictor levels as covariates.
Table 4 and Fig. 1 display the estimated associations between body composition changes and the different prospective cluster combinations. Taking the ‘healthy’–‘healthy’ combination as reference, children allocated to the ‘processed’–‘processed’ combination presented a larger increase in BMI Z-score (β=0·050; 95 % CI 0·006, 0·093), larger WC Z-score gain (β=0·071; 95 % CI 0·001, 0·141) and larger FMI Z-score increase (β=0·052; 95 % CI 0·014, 0·090) at follow-up. Being allocated to the ‘processed’–‘sweet’ combination was also associated with larger BMI Z-score increase (β=0·079; 95 % CI 0·015, 0·143), larger WC Z-score increase (β=0·172; 95 % CI 0·069, 0·275) and larger FMI Z-score gain (β=0·076; 95 % CI 0·019, 0·133) at follow-up. Finally, children allocated to the ‘sweet’–‘sweet’ combination presented also a larger WC Z-score gain (β=0·127; 95 % CI 0·038, 0·216) at follow-up.
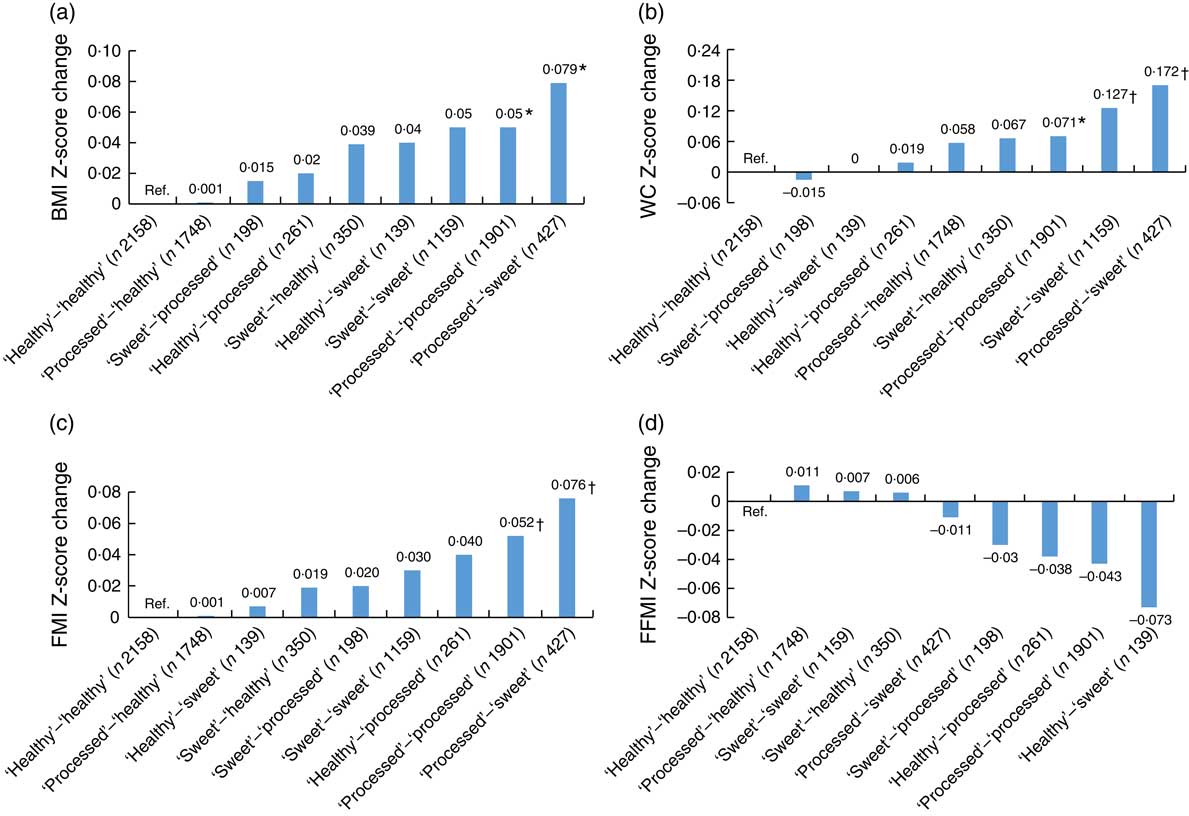
Fig. 1 (a) BMI Z-score change estimates, (b) waist circumference (WC) Z-score change estimates, (c) fat mass index (FMI) Z-score change estimates and (d) fat-free mass index (FFMI) Z-score change estimates by prospective dietary pattern combinations among children (n 8341) aged 2–9 years at baseline (T0, September 2007–May 2008) and 4–11 years at follow-up (T1, September 2009–May 2010) from eight European countries, IDEFICS (Identification and prevention of Dietary- and lifestyle-induced health EFfects In Children and infantS) study. Mixed models with body composition parameters as the outcome, dietary pattern combinations at T0 and T1 as predictor variables, random effects for country and setting, and gender, age, intervention v. control, socio-economic status score, physical activity level and baseline predictor levels as covariates. *P<0·05; †P<0·001; Ref., reference category
Table 4 Body composition change estimates by prospective dietary pattern combinations at baseline (T0, September 2007–May 2008) and follow-up (T1, September 2009–May 2010) among children (n 8341) aged 2–9 years from eight European countries, IDEFICS (Identification and prevention of Dietary- and lifestyle-induced health EFfects In Children and infantS) Study
IOTF, International Obesity Task Force; WC, waist circumference; FFMI, fat-free mass index; FMI, fat mass index; Ref., reference category.
Mixed models with body composition parameters as the outcome with random effects for country and setting, dietary pattern at T0, T1 or both as predictor variables, and gender, age, intervention v. control, socio-economic status score, physical activity level and baseline predictor levels as covariates.
Discussion
The present study describes associations between dietary patterns and body composition changes in European children applying cross-sectional and prospective models. A dietary pattern characterized by higher frequency of consumption of snacks and fast foods (‘processed’) was associated with increased BMI, increased WC and fat mass gain compared with a dietary pattern rich in fruits, vegetables and wholemeal products (‘healthy’). The ‘sweet’ pattern (higher frequency of consumption of sweet foods and sweetened drinks) was also linked to increased BMI, WC and fat mass gain compared with the ‘healthy’ pattern. All the described associations were observed accounting for country, setting (school), gender, age, intervention v. control groups, socio-economic status score, physical activity level and baseline predictor levels.
The current paper is based on dietary patterns derived by cluster analysis at two different points in time in 2- to 9-year-old children participating in the IDEFICS study. These patterns presented similar profiles of relative frequencies of food consumption at each point in time, allowing us to describe changes in body composition in those children consistently presenting unhealthier dietary patterns and to compare their body composition changes with the changes in children consistently showing healthier dietary profiles. Among all combinations, the persistent ‘processed’ pattern (children allocated to the ‘processed’ cluster at baseline and follow-up) and the ‘processed’–‘sweet’ pattern showed the largest differences in body composition compared with the persistent ‘healthy’ pattern, with larger increases in body mass and fat gain indicators.
Interestingly, the cross-sectional models at baseline and follow-up showed lower mean BMI, WC and FMI Z-score values and higher mean FFMI Z-score for the ‘sweet’ cluster compared with the ‘healthy’ cluster, suggesting that children with more favourable body composition indicators were more likely to report higher consumption of sugar-rich products. However, the prospective associations showed that body composition changes were more unfavourable for children allocated to the ‘sweet’ cluster over time (or a combination of ‘processed’–‘sweet’ clustering) compared with children allocated to the ‘healthy’ cluster over time, regardless of their initial body composition. These results suggest that associations reported in the cross-sectional models may reflect reverse causation, while prospective models might better reflect the true aetiological associations.
Even if dietary patterns are dependent on the population studied and/or the technique applied (cluster analysis, PCA, RRR) and thus not fully comparable between cohorts, previous studies found similar results. Briefly, several reports described ‘processed’ and ‘healthy’ dietary patterns in children across different studies. Moreover, some studies explored diet longitudinally and found evidence of tracking of the dietary patterns over time, especially the ‘healthy’ and ‘processed’ patterns( Reference Northstone, Smith and Newby 19 , Reference Walthouwer, Oenema and Soetens 31 – Reference Pala, Lissner and Hebestreit 33 ).
Concerning the associations of dietary patterns and later body composition, on the one hand, some studies found associations between ‘energy-dense, high-fat, high-sugar’ or ‘snacking’ dietary patterns and increased BMI( Reference Shroff, Perng and Baylin 15 ) and adiposity measured using FMI( Reference Johnson, Mander and Jones 17 , Reference Ambrosini, Emmett and Northstone 18 ) over time. On the other hand, a ‘health-aware’ pattern at age 10 years, characterized by higher consumption of fruits and vegetables and wholegrain products and lower consumption of processed foods and soft drinks, was linked to lower fat mass at age 11 years( Reference Smith, Emmett and Newby 34 ). In Norway, a ‘varied Norwegian’ pattern rich in vegetables, fruits, unrefined cereal products and fish was related to lower risk of remaining overweight over time from middle childhood (9 to 10 years old) to early adolescence (12 to 13 years old)( Reference Oellingrath, Svendsen and Brantsaeter 16 ).
The results of the present study add value to the main conclusion of a recent review by Ambrosini( Reference Ambrosini 11 ), where the balance of evidence shows that a posteriori dietary patterns defined as high in energy-dense, high-fat and low-fibre foods predispose children and adolescents to later overweight and obesity. Our results are in line with previous findings( Reference Mikkila, Rasanen and Raitakari 13 – Reference Ambrosini, Emmett and Northstone 18 ) applying an alternative technique (cluster analyses v. PCA/RRR) and taking several body composition indices into account.
Unlike PCA, cluster analysis assigns participants to mutually exclusive clusters and does not create continuous dietary pattern Z-scores. One advantage of the latter is the ability to track children and their classification over time if equivalent clusters can be derived, while one of the main limitations is the lack of a continuous indicator quantifying the degree to which the individuals’ dietary data reflect the described dietary patterns. A common limitation to both methods is their exploratory nature, relying on data covariance and thus dependent on the study sample. Another limitation is that dietary patterns do not provide information about meeting food/nutrient intake recommendations as such. A third method, RRR, combining a priori and a posteriori information may provide a better prediction of the outcome than PCA and cluster analysis, relying to a lesser extent on the study population and thus allowing greater replication of the associations.
The present study is subject to a number of limitations. First, the IDEFICS study was not designed to be representative at national level. Participation in the study was voluntary, thus some population groups, e.g. lower educated families or individuals presenting worse body composition, may have been less willing to take part in the study( Reference Regber, Novak and Eiben 35 ). As no systematic information on non-participants was available, the direction of a possible bias cannot be predicted. In addition, 43 % of the initial baseline cohort did not participate at follow-up and/or did not provide complete data. Excluded participants showed a higher prevalence of overweight/obesity and a higher proportion of lower educated parents (see Supplemental Table 2). Consequently, a selection bias cannot be ruled out. Concerning the dietary information, the CEHQ-FFQ was designed for capturing information on parent-supervised meals but not for recording total food intake. Nevertheless, the data allowed us to describe prospective body composition differences in relation to dietary patterns, as the main inter-individual variation in dietary patterns takes place in the family setting, rather than at school.
To the best of our knowledge, the present report is the first on a multi-centre European study assessing dietary patterns over time in relation to prospective body composition changes in children. Another strength is the large sample size, including a wide variety of dietary habits and cultural backgrounds across eight European countries. The use of a validated dietary instrument shown to provide reproducible estimates of consumption frequencies is also one of the main strengths of the study. Deriving dietary patterns by applying cluster analyses at two points in time allowed us to identify children with consistently healthier or unhealthier dietary profiles and to relate them to prospective body composition changes.
Children consistently showing a ‘processed’ dietary pattern or changing from a ‘processed’ pattern to a ‘sweet’ pattern presented the most unfavourable changes in fat mass and abdominal fat. These results support the need of promoting overall healthier dietary patterns in children to prevent overweight and obesity later in life. Examining dietary patterns as a whole may facilitate the explanation of overweight development compared with individual foods or nutrients. Prospective studies provide a clearer picture of the true associations than cross-sectional designs, and therefore more prospective studies are needed to evaluate the generalizability of these results. The use of a combination of techniques, including a priori data-driven techniques (RRR), would allow us to confirm the current findings and to better define public health recommendations.
Acknowledgements
Acknowledgements: The authors gratefully acknowledge the children and parents who participated in the IDEFICS Project. Financial support: Part of the IDEFICS Project, this study is published on behalf of the IDEFICS European Consortium (idefics.eu). This project was supported by the European Community’s Sixth RTD Framework Programme Contract No. 016181 (FOOD). The funder had no role in the design, analysis or writing of this article. Conflict of interest: None. Authorship: J.M.F.-A. carried out the statistical analyses with the help of C.B. and drafted the manuscript. K.B. supervised the quality control study protocol. A.H., G.E., T.V., Y.A.K., E.K. and L.A.M. supervised the national data collection procedures. All authors helped in data collection, read and critically reviewed the manuscript. Ethics of human subject participation: The study was conducted according to the declaration of Helsinki. Each participating centre obtained ethical approval from its health research ethics authority. All children provided oral consent and their parents provided written informed consent for all examinations and for the collection of samples, subsequent analysis and storage of personal data and collected samples.
Supplementary material
To view supplementary material for this article, please visit https://doi.org/10.1017/S1368980017002361


