


The burden of disease from inadequate consumption of fruits and vegetables is a global public health concern, accounting for 10 % of the global disease burden and 6·7 million associated deaths in 2010, with substantial personal, community and economic costs( 1 – Reference Lim, Vos and Flaxman 4 ). Higher fruit and vegetable intake is associated with decreased risk of child and adult obesity and CVD( Reference Hung, Joshipura and Jiang 5 , Reference Mazarello Paes, Ong and Lakshman 6 ). Internationally, children in developed countries consume insufficient fruits and vegetables to meet the WHO guideline of at least 400 g of fruits and vegetables combined per day( Reference Krølner, Rasmussen and Brug 7 ). In Australia, dietary guidelines recommend that 4–8-year-olds consume 1·5 servings of fruits and 4·5 servings of vegetables daily( 8 ). However, only 5·1 % of children and adolescents (aged 2–18 years) are meeting the national recommended guidelines for both fruit and vegetable intake( 9 ). The consumption of adequate amounts of fruits and vegetables by children is essential as it allows for the provision of vital nutrients necessary for healthy growth and development( 10 ).
Energy-dense, nutrient-poor foods are categorised as ‘discretionary’ foods in the Australian Dietary Guidelines (also known as ‘non-core’) and are typically high in fat, sugar and/or salt( Reference Magarey, Golley and Spurrier 11 ). Australian guidelines recommend 4–8-year-olds consume no more than 2·5 servings daily. The excessive consumption of such foods is linked to the development of childhood overweight and obesity, diabetes, CVD and cancer( Reference Craigie, Lake and Kelly 12 , 13 ). In the 2007 Australian National Child Nutrition and Physical Activity Survey, children aged 2–7 years were reported to consume 33–35 % of their daily energy intake from non-core foods( Reference Duncanson, Burrows and Collins 14 ) despite recommendations that these foods should account for only 5–20 %( Reference Rangan, Randall and Hector 15 ). Given that food habits established in childhood track into adulthood( Reference Hall, Collins and Morgan 16 ) and are associated with the risk of developing chronic disease, introducing interventions to increase consumption of fruits and vegetables and decrease consumption of non-core foods in childhood may have the potential to reduce morbidity and associated burden in adulthood( 17 ).
During childhood there is reliance on parents and carers for the provision of children’s food( Reference Vaughn, Tabak and Bryant 18 ), with previous research reporting a positive association between children’s consumption of fruits and vegetables and the extent to which parents provide children with these foods( Reference Wyse, Campbell and Nathan 19 , Reference Spurrier, Magarey and Golley 20 ). The provision of food process is a cycle recognised in the literature and comprises five steps, including (i) acquisition, (ii) preparation and (iii) cooking, all of which are precursors to (iv) eating and (v) disposal( Reference Bava, Jaeger and Park 21 ). Any disruption or barriers in the three steps of acquisition, preparation and cooking can potentially disrupt or affect food consumption through influencing the availability and access to food items. The literature has previously identified a number of barriers faced by parents in the process of food provision for their children( Reference Bava, Jaeger and Park 21 ). Common barriers to the provision of healthy foods include the time and costs involved in food acquisition, preparation and cooking( Reference Mazarello Paes, Ong and Lakshman 6 , Reference Ling, B Robbins and Hines-Martin 22 – Reference Carroll, Demment and Stiles 24 ).
A 2015 systematic review of obesogenic dietary factors of children aged 0–6 years identified that parents perceive healthy foods as more expensive than unhealthy foods( Reference Mazarello Paes, Ong and Lakshman 6 ). A number of qualitative studies with parents of children of pre-school age similarly report that parents perceive time and cost issues as key constraints to provision of healthier foods for their children( Reference Mazarello Paes, Ong and Lakshman 6 , Reference Ling, B Robbins and Hines-Martin 22 , Reference Dwyer, Needham and Simpson 25 ). Furthermore, a cross-sectional study of 550 parents and children (aged 6–11 years) found lower child consumption of fruits and vegetables in families with the lowest household grocery expenditure relative to those with the highest grocery expenditure( Reference Mushi-Brunt, Haire-Joshu and Elliott 26 ). The issue of affordability of healthier foods might be more substantial for those in remote locations( Reference Cafer and Kaiser 27 ). In addition, the issue of perceived cost may lead to some parents buying increased amounts of cheaper convenience foods despite being aware of the benefits of healthy eating( Reference Ling, B Robbins and Hines-Martin 22 ).
Time scarcity is also an issue of increasing salience as more parents join the workforce( 28 ), reducing the time available for the preparing and cooking steps within the provisioning process and increasing reliance on eating out and convenience foods (e.g. fast-food outlets) to save time( Reference Mazarello Paes, Ong and Lakshman 6 , Reference Ling, B Robbins and Hines-Martin 22 ). A survey of 600 American adults in 2014 reported that participants perceived purchasing and preparing of fruits (18 %) and vegetables (22 %) to be time-consuming( 29 ). Meanwhile, cross-sectional studies of American and New Zealand adults suggest that more time spent on home food preparation is associated with higher consumption of fruits and vegetables and lower consumption of non-core foods( Reference Bava, Jaeger and Park 21 , Reference Monsivais, Aggarwal and Drewnowski 30 – Reference McLaughlin, Tarasuk and Kreiger 32 ).
The literature to date regarding the impact of time and cost on healthier food consumption has primarily been focused on the dietary intake of adults, with few studies assessing associations between time and cost of food procurement and dietary intake in young children. The Healthy Habits Trial was a cluster-randomised controlled trial testing the efficacy of a telephone-based intervention targeting parents to increase the fruit and vegetable consumption of their pre-school children (3–5 years)( Reference Wyse, Wolfenden and Campbell 33 ). Almost 400 parents were recruited to this trial, providing an opportunity to address additional identified gaps in the literature( Reference Wyse, Wolfenden and Campbell 34 ). Therefore, using baseline data collected from the Healthy Habits Trial, the aim of the present study was to assess whether parent-reported time and cost to procure and prepare foods is associated with the consumption of fruits, vegetables and non-core foods in children of pre-school age (i.e. 3–5 years old). It was hypothesised that more investment in time and cost of food preparation would be associated with higher fruit and vegetable intake and lower non-core food intake.
Methods
Study design
The study design was cross-sectional and utilised baseline data collected from the Healthy Habits cluster-randomised controlled trial. The methods herein describe the relevant processes for collecting baseline data as part of the Healthy Habits Trial( Reference Wyse, Wolfenden and Campbell 33 ).
Ethical approval
Study procedures were approved by the Hunter New England Human Research Ethics Committee (reference number 08/10/15/5.09) and the University of Newcastle Human Research Ethics Committee. Written informed consent to participate in the Healthy Habits Trial was obtained from all parents.
Participants and recruitment
Parents were recruited from thirty non-government pre-schools (i.e. private) in the Hunter Region of New South Wales (NSW), Australia, in 2010. These non-Department of Education schools comprise the majority of pre-schools in the Hunter Region (~90 %). A list of pre-schools in the Hunter Region (n 57) was obtained from a database maintained by the NSW Department of Community Services (the licensing agency for the sector) and assessed by researchers for eligibility. Pre-schools were ineligible (n 19) if they: provided any meals to children; catered exclusively to children with special needs (children who require specialist care); or had participated in any child healthy eating research projects within the previous six months. Supervisors from eligible pre-schools were mailed study information and consent forms. Approximately two weeks later, the supervisors received a telephone call from a research assistant who answered any questions they may have had, confirmed pre-school eligibility and prompted supervisors to return the consent form.
Supervisors at consenting pre-schools were given flyers to distribute to parents to encourage recruitment. In most cases, a research assistant was on site at the pre-school for a minimum of one hour per day during either parent drop off or pick up, every day for one week, to answer any enquiries about the research and distribute the recruitment packs to parents. Recruitment packs for parents contained an information sheet, a consent form and a return envelope. Two weeks following the dissemination of the recruitment packs, parents were given reminder letters by the pre-schools to encourage the return of their consent forms. Consent forms were returned to a drop-box at each of the pre-schools and were collected by the researchers three weeks after recruitment commenced. Parents were eligible to participate if they: had a child aged 3–5 years who attended a participating pre-school; resided with that child at least four days per week; had some responsibility (i.e. at least half the time) in providing meals and snacks to their child; and were able to comprehend written and spoken English. Parents were ineligible if their child had dietary restrictions or allergies which were deemed by an independent Accredited Practising Dietitian to be in conflict with the Australian dietary predictor for fruit and vegetable consumption (e.g. fructose intolerance).
Data collection
Data were collected from parents by trained interviewers adhering to a survey script using a computer-assisted telephone interview. The survey took approximately 30 min to complete and was administered from April to October 2010. Parents were asked to answer with respect to their pre-school-aged child. If they had more than one child aged 3–5 years, they were instructed to answer all questions based on the child who would be having the next birthday. Parents were able to complete the telephone survey in a time that was convenient for them.
Measures
Participant characteristics
The survey included questions assessing the sociodemographic characteristics of both the parents and children. Parents reported their age, gender, highest education level, annual household income, and whether they identified as Indigenous, from fixed responses, as well as their child’s age and gender. Items used to assess these demographics were sourced from the NSW Health Survey( 35 ). Questions regarding number of days per week living in the same residence as the child and how often they were responsible for providing meals and snacks to the child were also included, to assess eligibility.
Children’s fruit and vegetable consumption
Child consumption of fruits and vegetables was assessed via the fruit and vegetable subscale (eight items) from the Children’s Dietary Questionnaire (CDQ)( Reference Magarey, Golley and Spurrier 11 ). Parents were required to report the frequency and variety of fruits and vegetables their child had consumed: (i) in the past 7d; and (ii) in the last 24 h. Frequency was assessed by asking how often the child ate fruits and/or vegetables (e.g. salad in sandwich and vegetables on the side, both eaten at lunch=twice) within the past 24 h (nil, once, twice, 3 times, 4 times, 5+ times) and the number of days within the past 7d where the child had eaten fruit and/or vegetables (none, 1, 2, 3, 4, 5, 6, every day). To assess the variety of fruits and vegetables consumed, a list of twenty-five vegetables (including potato, but not hot chips) and nineteen fruits was read out to parents via telephone, and parents indicated which, if any, their child had consumed within: (i) the past 7d; and (ii) the previous 24 h. An ‘other’ option was also provided to account for fruits or vegetables that were consumed but not already mentioned in the lists. The eight-item subscale was scored on a continuous scale from 0 to 28, with a score of 14 or more representing meeting the national dietary guideline for fruit and vegetable consumption (based on dietary guidelines for children and adolescents from the Australian Guide to Healthy Eating)( Reference Magarey, Golley and Spurrier 11 ). A higher score indicates greater consumption; an increase of 1 point could be equivalent to consuming an additional type of fruit or vegetable or consuming a fruit or vegetable at an additional occasion. Validity (Spearman’s correlation coefficient=0·58) and reliability (intraclass correlation coefficient=0·75) of the fruit and vegetable subscale have been previously established in a sample of Australian children( Reference Magarey, Golley and Spurrier 11 ).
Children’s non-core food consumption
Child consumption of non-core foods was assessed via the non-core foods subscale (twelve items) from the CDQ( Reference Magarey, Golley and Spurrier 11 ). Parents were asked to report the frequency with which their child consumed each of twelve different categories of common non-core foods (‘Takeaway, e.g. McDonalds, KFC, fish and chips/chicken shop’, ‘Lollies, muesli bars or fruit bars’ and ‘Chocolate – bar, block, coated biscuits’) in the past 7d (nil, once, twice, 3 times, 4 times, 5 times, 6+ times). The subscale is scored on a continuous scale from 0 to 10·3, with a score of ≥2 established as exceeding the recommended amount of non-core foods based on the national dietary guidelines( Reference Magarey, Golley and Spurrier 11 ). The higher the score, the greater the amount of non-core foods consumed. Validity (Spearman’s correlation coefficient=0·31) and reliability (intraclass correlation coefficient=0·90) of the subscale have also been established( Reference Magarey, Golley and Spurrier 11 ).
Time and cost of the provision of food
Data were collected regarding the time (in minutes) that parents spent grocery shopping, the time (in minutes) spent preparing food for the household and the expenditure (in $AU) on household groceries. Items were constructed by the research team for the purpose of the present study. Parents were required to report on: the average amount of time in minutes spent on grocery shopping for their household each week; the average amount of time in minutes spent preparing food for the household each day; and the approximate amount of money spent on food for the household (including takeaways and eating out) each week.
Analysis
Data were checked for normality and descriptive statistics were used to describe the sample. Parental education and annual household income were dichotomised based on cut-off points used in a previous study based on this data set( Reference Wyse, Campbell and Nathan 19 ). CDQ scores were dichotomised into ‘meeting dietary guidelines’ and ‘not meeting dietary guidelines’ (i.e. fruit and vegetables subscale <14; non-core foods subscale ≥2). Analysis was conducted using the statistical software program JMP® version 11.0 (SAS Institute Inc., 1989–2007). To investigate associations between diet and the provision of food variables, simple linear regression models were generated. The input variables were parental investment of time and cost for the provision of food, while the outcome variables were the CDQ subscale scores for (i) fruit and vegetable consumption and (ii) non-core food consumption. Given evidence suggesting associations between children’s fruit and vegetable consumption and parental factors including income, education and the number of children (less than 16 years of age) in the household, the final multiple linear regression models were generated using the ‘Fit Model’ function with a personality of ‘Standard Least Squares’ and adjusted for these confounders( Reference Sausenthaler, Kompauer and Mielck 36 – 38 ). Six models were generated comparing the two measures of parental investment of time (time shopping and time taken to prepare foods) and the measure of cost against the CDQ subscale scores for: (i) fruits and vegetables; and (ii) non-core foods. The data were cleaned and checked for implausible results, and such data were excluded from analysis. For time spent on food preparation each day, values greater than 240 min (i.e. 4 h spent preparing food every day) were regarded as implausible and excluded from analysis (n 4). A screening criterion of P<0·05 was determined as a significant association.
Results
Of the thirty-eight pre-schools contacted, seven pre-schools declined participation and one could not be contacted, with the thirty remaining pre-school supervisors consenting to participate. A total of 417 parents consented to the study from the thirty consenting pre-schools in the Hunter Region. Of the 417 parents who initially consented, ten refused to participate when contacted to complete the telephone survey, six did not meet the eligibility criteria and five could not be contacted, leaving 396 parents with completed survey data for analysis. The parent and child characteristics of the sample are described in Table 1. In total, 380 females (96 %) and sixteen males completed the survey, with a mean age of 35·45 (sd 5·35) years. A total of 47 % of parents had completed a university degree. Seventeen parents refused to disclose or did not know their annual household income, while among the 379 parents who answered this question, 41 % had an annual household income of $AU 100 000 or more. The child subject of the survey was female in 49 % of cases and the mean age was 4·29 (sd 0·61) years. The mean number of children per household was 2·29 (sd 0·75). Among those surveyed, 2 and 3 % of parents and children, respectively, identified as Aboriginal or Torres Strait Islander.
Table 1 Parent and child characteristics within the study sample; parents (n 396) with a child aged 3–5 years attending a pre-school participating in the Healthy Habits Trial, Hunter Region of New South Wales, Australia, April–October 2010 (baseline data)
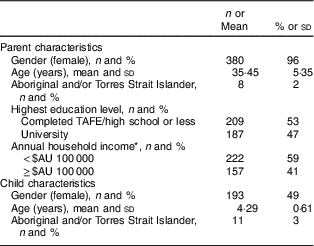
* n 17 excluded (don’t know or refused).
Input variables
The mean time parents spent each day preparing food for the household was 108 (sd 44·27) min (range 30–240 min). The median time spent preparing food was 120 min. The mean time parents spent each week shopping for groceries for the household was 124 (sd 54·35) min (range 30–420 min). The median time spent shopping for groceries was 120 min. The mean expenditure for food each week including takeaways and eating out was $AU 238 (sd 80·91; range $AU 80–700). There was no significant difference between male or female parents in reporting the time spent on food preparation (P=0·119), time spent on grocery shopping (P=0·167) or cost (P=0·190) spent.
Outcome variables
Children’s fruit and vegetable consumption
The mean CDQ score for the fruit and vegetable subscale was 14·78 (sd 4·62; range 0–24) out of a maximum score of 28. A total of 63 % of children scored 14 or greater, indicating adherence to dietary guidelines for fruit and vegetable intake( Reference Magarey, Golley and Spurrier 11 ).
Children’s non-core food consumption
The mean CDQ score for the non-core foods subscale was 2·53 (sd 1·12; range 0·29–5·71) out of a possible 10·3. A total of 64 % of children had a score equal to or exceeding 2, indicating they were exceeding dietary guidelines for non-core foods( Reference Magarey, Golley and Spurrier 11 ).
The associations between children’s dietary intakes and the parent time spent in provision and cost of food are displayed in Table 2. From the simple regression models, it was found that there were significant positive associations between the CDQ scores for non-core foods and parental investment of time for food preparation (P=0·032) and cost of procurement (P=0·043). However, the magnitude of the effects was small (estimate=0·003 and 0·001, respectively). For fruit and vegetable consumption, there were no significant positive associations.
Table 2 Associations between Children’s Dietary Questionnaire subscale scores and parental investment of time and cost in the provision of food; parents (n 396) with a child aged 3–5 years attending a pre-school participating in the Healthy Habits Trial, Hunter Region of New South Wales, Australia, April–October 2010 (baseline data)
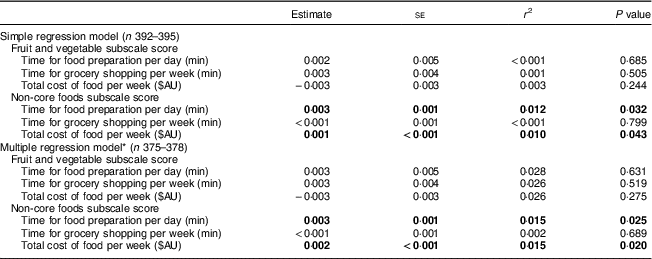
Significant results are indicated in bold font.
* Adjusted for annual household income, parent education level and number of children less than 16 years of age in the household.
The multiple regression model included input variables (time spent preparing food for household per day, time spent procuring household groceries per week and cost of procurement per week), outcome variables and the potential confounders of parental education level, household income and number of children less than 16 years of age. The multiple regression model indicated there were significant positive associations between the CDQ scores for non-core foods and parental investment of time for food preparation (estimate=0·003, P=0·025) and cost of procurement (estimate=0·002, P=0·020); however, the magnitude of the effect was small. Parent education level was found to be significantly associated with children’s intake of fruits and vegetables when taken into consideration with time spent on food preparation (P=0·013), time spent procuring food (P=0·016) and cost of procurement (P=0·027).
Discussion
The current study aimed to investigate the associations of parent-reported time and cost of the provision of food with the consumption of fruits and vegetables and non-core foods in a sample of Australian children of pre-school age. From the study sample of 396 Australian parents, it was found that there were no associations between the fruit and vegetable consumption of pre-schoolers and parental investment of time and cost spent on the provision of food. In addition, despite associations in other studies( Reference Sausenthaler, Kompauer and Mielck 36 , Reference Cooke, Wardle and Gibson 37 ), household income and number of children were not significantly associated with pre-schoolers’ fruit and vegetable consumption in this sample. However, similar to previous research, the study found that higher parent education level was associated with higher fruit and vegetable consumption in pre-schoolers( Reference Sausenthaler, Kompauer and Mielck 36 , Reference Cooke, Wardle and Gibson 37 ). Regarding the second outcome variable, greater consumption of non-core foods was positively associated with the amount of time parents spend on food preparation and cost spent on procurement, although the magnitude of the effect was small. Therefore, our original study hypothesis that more time and cost spent on the provision of food would be associated with higher consumption of fruits and vegetables and lower consumption of non-core foods was not supported by the results.
In the current sample, it was identified that 64 % of the pre-school children were reported to be consuming an excessive amount of non-core foods (exceeding the dietary guidelines), which is in accordance with previous reports of Australian pre-school children’s consumption( Reference Rangan, Randall and Hector 15 ). Comparatively, 63 % of pre-school children in the sample were reported be consuming adequate amounts of fruits and vegetables to meet the dietary guidelines, which is substantially higher than the national average of 5·1 %( 9 ), indicating that the current sample may not have been representative in terms of fruit and vegetable consumption.
The mean cost spent on food each week in this sample ($AU 238 per week) is comparable to the national average of $AU 237 per week for household expenditure on foods and beverages( 39 ). Cost of household food in the present study included groceries, eating out and takeaways, and the study found that higher consumption of non-core foods was positively associated with cost of food procurement. The association might be attributed to more incidences of eating out and more money spent on non-core foods (i.e. fast foods( 40 )) compared with the money spent on fruits and vegetables( 41 ). It is recommended that future research explores the composition of total expenditure on food via tracking of receipts and that it investigates the contribution made by eating out, which may explain the higher cost associated with consumption of these foods. In addition, identifying more frequently consumed categories of non-core foods and their associated costs might help to better understand the cost breakdown (i.e. more money spent on sweetened beverages or on takeaways) and help to identify targets of specific categories of non-core foods for future interventions. Furthermore, surveying multiple parents and carers within a family, rather than one parent, may provide a more accurate estimate of total household expenditure on foods and beverages. This may in part explain why this relatively wealthy sample was spending only equivalent to the national average. Qualitative and quantitative research would also be of use to understand the reasons behind provision of non-core foods despite the high costs of these foods. For pre-school children from families of higher socio-economic status, there may be benefit in increased focus on interventions that aim to reduce consumption of non-core foods, rather than increasing consumption of fruits and vegetables.
In the current study, parental investment of time on food preparation was positively associated with consumption of non-core foods in pre-school children, although the magnitude was small. These results contradict findings in the adult population, whereby less time spent on food preparation was associated with more money spent on food procurement and eating out( Reference Monsivais, Aggarwal and Drewnowski 30 ). The high time investment reported by parents in the study might be attributable to the type of food cooked (i.e. slow cooking, stewing or baking requires more time compared with stir-frying or preparing simple foods that do not require cooking such as a sandwich). Hence, the lack of association between time spent on food preparation and consumption of fruits and vegetables may arise as some of these foods can be consumed whole with little or no preparation, and vegetables can be eaten raw, as salads or pre-packed and ready to use. Furthermore, some non-core foods that are often considered ‘convenience foods’ can still require a substantial amount of time to prepare prior to eating but require less effort (i.e. more ‘passive’ preparation) compared with the more ‘active’ preparation (e.g. chopping of vegetables and stir-frying) commonly required to prepare healthier foods. For example, a frozen pizza or meat pie would still be required to be cooked in the oven, following a period of pre-heating (e.g. 15 min pre-heating and 20 min cooking time, therefore total of 35 min spent). However, the time involved mostly consists of waiting time rather than active preparation. Since food preparation is a subjective term and could mean different things to different participants, further research is needed to explore time usage for food preparation in more detail; for example, the steps or cooking methods involved could greatly influence time reported in a survey. Clearer definitions of food preparation could be considered because cooking food in an oven, where nothing needs to be done, is a passive process but still could be counted by participants as ‘preparing’; however, actively stir-frying and adding ingredients is more active and truer of food preparation. Another influence on the time spent preparing meals might be related to parent confidence and knowledge of cooking. For example, parents with more experience and familiarity with cooking would require less time to be spent on food preparation( Reference Soliah, Walter and Jones 23 , 41 – Reference Winkler and Turrell 44 ). Lack of cooking skills and food preparation knowledge may result in greater reliance on eating out or takeaway foods or buying of convenience meals( Reference Soliah, Walter and Jones 23 , Reference Reicks, Trofholz and Stang 42 ). Further research can quantitatively and qualitatively explore the reasons behind such barriers.
Previous studies have reported components of the food provision cycle (i.e. time and cost for acquisition, preparation and cooking of foods) as barriers to fruit and vegetable intake in young children. Findings from the present cross-sectional study, however, suggest that there were no associations between these barriers and consumption. Further exploration of such associations using validated measures are warranted to better inform the design of future parent-targeted interventions to improve child dietary intake.
The present study is among the first to investigate these associations using multiple regression analysis with a measure of fruit and vegetable and non-core food consumption in children. There are several limitations to the study that have to be considered. First, the study is based on cross-sectional data and the findings cannot indicate causality. Second, due to the nature of the recruitment process (relying on supervisors to distribute study information and research assistants approaching a convenience subset of parents during the hours they attended the service), we cannot accurately report a recruitment rate and the sample may not be typical or representative of the population. In comparison to a random sample of pre-school children’s parents in the region, more parents are tertiary-level educated and have an annual household income above the regional average( Reference Wolfenden, Hardy and Milat 45 ) and a greater proportion of the children sampled meet or exceed dietary guidelines for the consumption of fruits and vegetables. Third, the data are based on parent report of the pre-school child’s consumption and hence parents might be over- or under-reporting their child’s dietary intake. The CDQ used in the present study demonstrated low to moderate levels of accuracy; however, at the time of the study, it was the only tool with established reliability and validity in samples of Australian children that could be administered over the telephone. Fourth, there may be selection bias as parents more interested in nutrition/health-related issues may be more likely to volunteer to the study. Furthermore, the validity and reliability of reporting time spent on food preparation, time spent on grocery shopping and cost spent on food are unknown as they were created specifically for the Healthy Habits Trial. Future studies should consider assessing the total number of adults and children in the household, so the total amount of money spent could be more meaningfully and accurately represented. The present study explored the combined consumption of fruits and vegetables and did not allow for separate analysis with parental investment of time and cost for the provision of food. Furthermore, collecting information from other parents and carers within the family who may also be involved in food preparation and shopping for food may find stronger associations. Future research should be conducted prospectively to investigate if the weak associations with non-core food consumption can be replicated across a time span, and then to determine if they are maintained across families from more diverse socio-economic backgrounds. It is recommended that future studies seek to address these limitations.
Conclusion
The present study found no associations between the fruit and vegetable consumption of children of pre-school age and the time and cost invested by their parents in preparing and procuring foods. It found that although non-core food consumption in pre-school children was associated with increased time and money spent on preparing and procuring food, the magnitude of the effect was small. As such, further investigation into the time spent in food preparation and the cost spent on food procurement and their associations with non-core foods in other samples of young children is warranted, as this could help address the increased consumption of non-core foods in pre-school children contributing to the overall public health issue of childhood obesity.
Acknowledgements
Acknowledgements: The authors would like to acknowledge the Healthy Habits Research Team and Advisory Group, the parents and children who participated in the study, and the telephone interviewers who collected the data. Financial support: The cluster-randomised controlled trial from which these data were collected was supported by the Cancer Institute New South Wales (grant number 08/ECF/1-18). Infrastructure support was provided by the Hunter Medical Research Institute and in-kind support was provided by Hunter New England Population Health. Conflict of interest: None of the authors reported a conflict of interest. Authorship: S.X.J.L., R.W., T.B. and S.Y. conceived of the study; S.X.J.L. cleaned and analysed the data and led the writing of the manuscript. All authors contributed to drafts of the manuscript and read and approved the final version. Ethics of human subject participation: This study was conducted according to the guidelines laid down in the Declaration of Helsinki and all procedures involving human subjects were approved by the Hunter New England Human Research Ethics Committee (reference number 08/10/15/5.09) and the University of Newcastle Human Research Ethics Committee. Written informed consent was obtained from all subjects.


