


The Pacific Island region comprises a wide area of diverse nations that suffer from some of the highest rates of non-communicable diseases (NCD) globally( 1 ). NCD, including CVD and diabetes, account for about 70 % of all deaths in the region, most of which occur before the age of 60 years( 2 ). In fact, NCD are the primary cause of premature deaths in all Pacific Island countries( 1 ). Alarmingly, NCD rates are expected to increase given existing risk factors( 1 ) and the transition from traditional diets based on locally grown foods( Reference Hughes 3 , Reference Thow, Heywood and Schultz 4 ) to modern diets characterized by imported foods and refined oils, sugar and confectionery, and processed meats( Reference Snowdon and Thow 5 , Reference Charlton, Russell and Gorman 6 ).
In 2013, the WHO recommended that all Member States develop policy measures for promoting a healthy diet, as part of efforts to reduce premature mortality from NCD by 25 % by 2025( 7 ). Recommendations include policies to reduce population intakes of salt, SFA, trans-fats, and free and added sugars( 7 ). In Pacific Island countries, several initiatives have already been implemented such as changes in trade policy including import bans on carbonated soft drinks in Tokelau( Reference McDonald 8 ); sales ban on mutton flaps in Fiji( Reference Thow, Swinburn and Colagiuri 9 ); import tariffs or excise taxes on sugary drinks in twelve Pacific Island countries( Reference McDonald 8 , Reference McDonald 10 ); regional food-based dietary guidelines( 11 ); and support for local agriculture and efforts to improve food security( Reference Iese, Paeniu and Pouvalu 12 ). Evaluation of some of these efforts showed barriers to success including insufficient engagement from other sectors( Reference Thow, Swinburn and Colagiuri 9 ), and there has been no evidence of significant decline in NCD rates in the region although stabilization of some risk factors is being seen( 13 ).
A good nutrition monitoring system is important for developing and strengthening policies and actions and evaluating health interventions, especially in the Pacific where resources are scarce( Reference Tolley, Snowdon and Wate 14 ). As such, data on current intakes of fat, sugar and salt are needed for setting realistic goals and plans for strategies to reduce consumption of these nutrients. These data are critical to lay the foundation of evidence-based interventions and for monitoring impact of interventions. While there have been reviews on dietary patterns and intakes in Pacific Island countries( Reference Hughes 3 , Reference Hughes and Lawrence 15 , Reference McGregor, Bourke and Manley 16 ), no reviews have been done in the last 10 years. Thus, we aimed to systematically review and synthesize recent literature on dietary intakes of Pacific Island adult populations, with a specific focus on fat, sugar and salt intake.
Methods
A search protocol was developed based on the Preferred Reporting Items for Systematic Reviews and Meta-Analyses (PRISMA) guidelines for systematic reviews. This included a defined search strategy, methods for data extraction and synthesis, and assessment of quality of the studies.
Search protocol and databases
A search for published literature was conducted using PubMed, Scopus, Science Direct and Global Health between 2005 and January 2018, limited to English language and human studies. The search strategy comprised three groups of search terms: nutrient terms (salt, sugar and fat), intake terms (eat, consumption, ingest and intake) and country terms (each of the twenty-two Pacific Island countries and areas, Pacific Islands, and Micronesia, Polynesia or Melanesia). A grey literature search was also performed using Google Scholar, Open Grey, Prism Survey and WHO databases, limited to the first ten pages of results. Key stakeholders, including experts, researchers and relevant organizations working to address diet-related issues in the Pacific Islands, were contacted to obtain information about unpublished documents or data sets.
Study selection
All search results were imported to EndNote X7.7.1 (Thomas Reuters, 2016) for title and abstract screening. Two authors (J.A.S. and B.M.) independently screened the titles and abstracts, and the full texts of potentially related articles were obtained and assessed further for eligibility. Disagreements at any stage of eligibility assessment (title and abstract screening, full-text review stage) were discussed by the two authors until agreement was reached. Studies not meeting the inclusion criteria as well as those not available electronically were excluded.
Inclusion criteria
Studies of any design were included if the primary or secondary outcomes provided information relevant to dietary patterns or preferences or intakes of fat, sugar and salt carried out on a general Pacific Island adult population (15–64 years of age). Countries of studies included were American Samoa, Commonwealth of the Northern Mariana Island (CNMI), Cook Islands, Federated States of Micronesia (FSM), Fiji, French Polynesia, Guam, Kiribati, Nauru, New Caledonia, Niue, Palau, Papua New Guinea (PNG), Pitcairn Island, Republic of the Marshall Islands (RMI), Samoa, Solomon Islands, Tokelau, Tonga, Tuvalu, Vanuatu, and Wallis and Futuna.
Exclusion criteria
Studies focusing on fortification, fishing, agriculture, disaster conditions, and those that included sick populations only were excluded. Studies specifically conducted in women who were lactating were excluded. Studies that only reported on data collected before 2005 were also excluded, regardless of the publication date.
Data extraction and synthesis
Data extraction was done by two authors (J.A.S. and B.M.) using a data extraction form designed for the present review. Information on study year, country of study, research design, type of participants and sample size, dietary assessment methods, and intake (e.g. description of intake or absolute intake, if reported) of fat, sugar and salt were extracted.
Where applicable, quality of the included studies was assessed by a modified tool for evaluating dietary intake studies( Reference Whalan, Farnbach and Volk 17 ). This tool was originally used to evaluate intake studies conducted among Aboriginal and Torres Strait Islanders in Australia. For the purpose of the present review, seven domains were employed, including: (i) involvement of Pacific Islanders in the study during conception, design or conduct of research; (ii) representativeness of sample of the underlying population; (iii) participation rate; (iv) reliability and validity of the dietary assessment tool; (v) quality of dietary assessment tool based on a set of criteria; (vi) accuracy of the food composition tables; and (vii) completeness and usability of results. More details on how each quality domain was scored are available in the online supplementary material, Supplemental Table 1. Two authors (J.A.S. and B.M.) assessed the quality of the studies and a third author (K.T.) was consulted for any disagreements in assessment. Each study was rated as low, high or unclear quality for each quality domain.
A narrative synthesis of findings was based on all included studies. A descriptive approach was undertaken due to the heterogeneous nature of the reported outcomes.
Results
Search results
The search identified 1529 records (1472 from the peer-reviewed and fifty-seven from the grey literature search and key stakeholders), of which 121 were considered potentially relevant (Fig. 1). Of these, seven full texts were not available and eighty-three were excluded. The reasons for excluding the studies were: no clear data on fat, sugar or salt intake (n 46); data collected before 2005 (n 10); not relevant (n 19); did not meet the age criteria (n 7); and duplicate (n 1). Ultimately, thirty-one studies met the criteria.

Fig. 1 Flowchart of studies included in the present systematic review on the contribution of fat, sugar and salt to diets in the Pacific Islands
Description of the studies
Study design varied across the included studies, ranging from cross-sectional (n 20) to pre–post intervention studies (n 4), dietary modelling (n 4), use of secondary data (n 2) and case–control (n 1; Table 1). Three studies( Reference Kaufer, Englberger and Cue 18 – Reference Land, Webster and Ma 20 ) included women only. Eleven studies used households as the unit of analysis( 21 – 31 ), fourteen reported the results at the individual level( Reference Kaufer, Englberger and Cue 18 – Reference Land, Webster and Ma 20 , Reference Dela Cruz and Cash 32 – Reference Konishi, Watanabe and Umezaki 40 ) (two unpublished results: Fiji National Nutrition Survey 2017 and Vanuatu Ministry of Health 2017), while the rest described intake at a population level( Reference Martyn, Yi and Romeo 41 – Reference Micha, Khatibzadeh and Shi 46 ). Sample sizes ranged from 150 to 4479 households and from thirty-four to 3220 individuals. Three studies( Reference Estime, Lutz and Strobel 44 – Reference Micha, Khatibzadeh and Shi 46 ) included multiple Pacific Island countries, while the others involved a single country. Among the single-country studies, six were done in Samoa; three each in FSM, Solomon Islands and Vanuatu; two each in Fiji, Guam and Tonga; and one each in CNMI, Cook Islands, Nauru, New Caledonia, Palau, PNG and Tuvalu. No data were obtained from six countries: American Samoa, French Polynesia, Niue, Pitcairn Island, Tokelau, and Wallis and Futuna. Lastly, more than half (n 17) of the studies were from the grey literature and these were mainly government surveys.
Table 1 Dietary study characteristics and reported data on fat, sugar and salt intake

CNMI, Commonwealth of the Northern Mariana Islands; FSM, Federated States of Micronesia; PNG, Papua New Guinea; NCD, non-communicable disease; HIES, Household Income and Expenditure Survey; 24H-FR, 24 h food recall; 24H-UNa, 24 h urine collection; EX, household expenditure; BE, dietary behaviour; AI, absolute intake; PC, percentage contribution to energy intake; MS, main sources; AV, availability.
* Only estimates for the control group were included.
Quality of studies
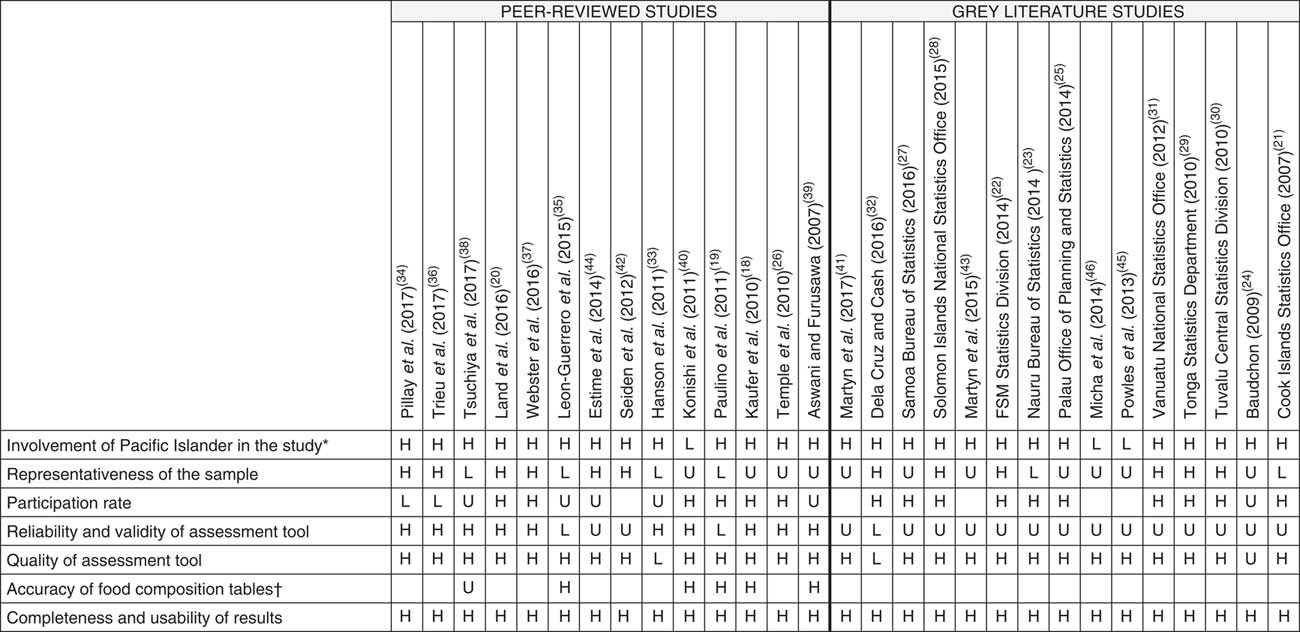
A summary of the quality assessment of studies included in the current review is presented in Fig. 2. Only two studies( Reference Land, Webster and Ma 20 , Reference Webster, Su’a and Ieremia 37 ) were of high quality across all domains. The number of studies where quality was unclear or low was similar for peer-reviewed and grey literature in four domains: involvement of Pacific Islanders in the study (n 1 v. 2); representativeness of the sample (n 8 v. 9); quality of dietary assessment tool (n 1 v. 2); and completeness and usability of results (both n 0). The number of studies where quality was unclear or low based on participation rate was higher for peer-reviewed compared with grey literature (n 7 v. 1), while the opposite was true for reliability and validity of the dietary assessment tool (n 4 v. 15).

Fig. 2 Summary of quality assessment (H, high quality; U, unclear quality; L, low quality; blank, not applicable) of studies included in the present systematic review on the contribution of fat, sugar and salt to diets in the Pacific Islands (note, quality assessment of two unpublished results was not completed: Fiji National Nutrition Survey 2017 and Vanuatu Ministry of Health 2017). *Refers to involvement during conception, design, conduct of research, including pre-testing and data collection, and distribution of results. †Assessed based on the appropriateness of the food composition database used to analyse the data, and whether a second person checked the linking of foods to the food composition table (FSM, Federated States of Micronesia)
Dietary assessment method and type of outcome data reported
Use of Household Income and Expenditure Survey (HIES) data, comprised of a two-week diary and records of expenditure on food, was the most common method for assessing dietary intake in studies (n 10), followed by 24 h food recall (n 6) and 24 h urine collection (n 4) and diet questionnaire (n 4). Other assessment methods employed were FFQ, dietary modelling, review of data from past surveys, food weighing, spot urine collection and food records. Five studies( Reference Kaufer, Englberger and Cue 18 , Reference Leon-Guerrero, Chong and Novotny 35 , Reference Webster, Su’a and Ieremia 37 , Reference Konishi, Watanabe and Umezaki 40 ) (one unpublished results: Vanuatu Ministry of Health 2017) used more than one method to measure dietary intake. Twenty-two studies published information on fat intake, seventeen on sugar intake and fourteen on salt intake. Overall, six types of outcomes regarding intake of fat, sugar or salt were reported: (i) absolute intake; (ii) household expenditure; (iii) percentage contribution to total energy intake; (iv) main sources; (v) availability (i.e. foods available for consumption, per capita); and (vi) dietary behaviours.
Absolute intake, main sources and percentage contribution of fat, sugar and salt to total energy intake were commonly measured by 24 h food recall, FFQ or dietary modelling. To measure salt intake, four studies from two countries (one in Fiji and three in Samoa)( Reference Land, Webster and Ma 20 , Reference Pillay, Trieu and Santos 34 , Reference Trieu, Ieremia and Santos 36 , Reference Webster, Su’a and Ieremia 37 ) utilized the gold standard 24 h urine collection, while others employed spot urine collection and salt weighing. Household expenditure was measured using HIES data. Information on availability or access was either from secondary data or dietary modelling, while behaviours were assessed through 24 h food recall, FFQ or diet questionnaire.
Fat, sugar and salt intake
Absolute intake
Results for each outcome measure are presented in Table 2 (fat intake), Table 3 (sugar intake) and Table 4 (salt intake). Information on absolute intake of fat and salt was available in six and ten countries, respectively, while only one country (Guam)( Reference Paulino, Leon Guerrero and Novotny 19 ) had data on absolute intake of added sugar (47 g/d). Compared with total fat intake in Solomon Islands (25 g/d)( Reference Tsuchiya, Tagini and Cafa 38 ), intake in other countries was high (mean intake of 99 g/d in Guam( Reference Leon-Guerrero, Chong and Novotny 35 ), 97 g/d in Fiji (Fiji National Nutrition Survey 2017, unpublished results), 75 g/d in Vanuatu( Reference Martyn, Yi and Fiti 43 ), 63 g/d in FSM( Reference Kaufer, Englberger and Cue 18 ), 107 g/d for males and 88 g/d for females in Tonga( Reference Konishi, Watanabe and Umezaki 40 )).
Table 2 Fat intake by type of outcome reported and country

FSM, Federated States of Micronesia; PNG, Papua New Guinea; RMI, Republic of the Marshall Islands; 24H-FR, 24 h food recall.
* Values reported as mean total fat intake, unless stated otherwise;
† Values reported as percentage contribution of total fat to energy, unless stated otherwise.
Table 3 Sugar intake by type of outcome reported and by country

FSM, Federated States of Micronesia; CNMI, Commonwealth of the Northern Mariana Islands; 24H-FR, 24 h food recall; SSB, sugar-sweetened beverage.
* Values reported as percentage contribution of sugar to energy, unless stated otherwise.
† Confectionery.
‡ Sugar, jam, honey, chocolate, confectionery.
§ Sugar alone.
║ Sugar and confectionery.
Table 4 Salt intake by type of outcome reported and by country

FSM, Federated States of Micronesia; PNG, Papua New Guinea; RMI, Republic of the Marshall Islands; CNMI, Commonwealth of the Northern Mariana Islands; 24H-FR, 24 h food recall; 24H-UNa, 24 h urine collection.
* Values were converted to salt in g/d (393·4 mg sodium=1 g salt).
Of the ten countries with data on absolute salt intake, only two (Fiji and Samoa) were based upon 24 h urine collection. Four countries (Fiji, PNG, Samoa and Vanuatu) had multiple data points, but differences in study design, assessment methods and sampling did not allow for assessment of change over time. Five countries (FSM, Kiribati, RMI, Solomon Islands and Tonga) had salt intake estimates solely based from modelling( Reference Powles, Fahimi and Micha 45 ). The most recent data on intake of fat, sugar and salt, and the dietary assessment method used, are shown in Table 5.
Table 5 Most recent fat, sugar and salt intake estimates and dietary assessment method used

FSM, Federated States of Micronesia; RMI, Republic of the Marshall Islands; M, males; F, females; 24H-FR, 24 hour food recall; 24H-UNa, 24 h urine collection.
Household expenditure
Ten countries had household expenditure data on fats and oils, which ranged from 0·01 % in Vanuatu( 31 ) to 3·4 % in Cook Islands( 21 ). On the other hand, eleven countries had expenditure data on sugar although how it was reported varied, with studies reporting on sugar alone (n 4), sugar and confectionery (n 3), sugar, jam, honey, chocolate and confectionery (n 6), and one on confectionery alone. Expenditure on sugar, jam, honey, chocolate and confectionery ranged from 2·1 % in FSM to 8·0 % in Tuvalu. Expenditure on sugar alone ranged from 0·6 % in New Caledonia( Reference Baudchon 24 ) to 13·0 % in Kiribati( Reference Estime, Lutz and Strobel 44 ). Only two countries (Cook Islands and Vanuatu) had data on household expenditure on salt (0·1( 21 ) and 1·8 %( 31 ), respectively).
Sources of fat, sugar and salt
Four countries had data on sources of fat and these were coconut products, oils, meat products and fish products. A study in Tonga( Reference Konishi, Watanabe and Umezaki 40 ) reported that imported food products including meats and processed foods contributed 65 % of total daily fat intake. Three countries had data on sources of salt. Bread (15·4 %) was found to be the highest contributor of dietary salt in Vanuatu( Reference Martyn, Yi and Fiti 43 ), while table salt was common in Fiji (13·7 %; Fiji National Nutrition Survey 2017, unpublished results) and Samoa (39·0 %)( Reference Martyn, Yi and Romeo 41 ). Meat and fish products were consistently among the top sources of salt in these three countries. There were no data on the sources of sugar, but studies in CNMI and FSM reported frequent consumption of sugar-sweetened beverages( Reference Dela Cruz and Cash 32 , Reference Hanson, Englberger and Duncan 33 ).
Percentage contribution to energy intake
Percentage contribution of total fat to total energy intake varied across the four countries with data (14·5 % in Solomon Islands( Reference Tsuchiya, Tagini and Cafa 38 ), 23·3 % in FSM( Reference Kaufer, Englberger and Cue 18 ), 27·5 % in Guam( Reference Paulino, Leon Guerrero and Novotny 19 ), 33 % for males and 31 % for females in Tonga( Reference Konishi, Watanabe and Umezaki 40 )). Nine countries estimated percentage contribution of saturated fat to total energy intake from modelling and it ranged from 22·8 % in Tonga to 27·5 % in Samoa( Reference Micha, Khatibzadeh and Shi 46 ). A study in Guam( Reference Paulino, Leon Guerrero and Novotny 19 ) reported the percentage contribution of saturated fat on a regular day (7·9 %) and a feast day (11·4 %) based on 24 h food recall. On the other hand, percentage contribution of sugar to total energy intake appeared similar in two countries (3·6 % in Vanuatu( Reference Martyn, Yi and Fiti 43 ) and 2 % in Solomon Islands( Reference Estime, Lutz and Strobel 44 )) but was notably high (34 %) in Kiribati( Reference Estime, Lutz and Strobel 44 ). A study in Samoa reported that brown sugar contributed 8 % to total energy intake but did not provide information on total sugar( Reference Martyn, Yi and Romeo 41 ).
Availability of fat, sugar and salt for consumption (per capita)
There was very little information on availability of fat, sugar and salt. In fact, only Samoa had data on this outcome which showed that there was high availability of fats in the country as well as excessive access to sodium( Reference Martyn, Yi and Romeo 41 , Reference Seiden, Hawley and Schulz 42 ).
Dietary behaviours
Dietary behaviour data from FSM and Solomon Islands indicated that foods high in fats and oils were consumed frequently( Reference Kaufer, Englberger and Cue 18 , Reference Hanson, Englberger and Duncan 33 , Reference Tsuchiya, Tagini and Cafa 38 ). Sugar was also consumed frequently with 75 %( Reference Dela Cruz and Cash 32 ) and 50 %( Reference Hanson, Englberger and Duncan 33 ) of adults in CNMI and FSM, respectively, reporting drinking one or more sugar-sweetened beverages per day. Studies in Samoa( Reference Webster, Su’a and Ieremia 37 ) and Vanuatu (Vanuatu Ministry of Health 2017, unpublished results) using the WHO STEPwise approach to surveillance of NCD risk factors (STEPS) instrument( 47 ) reported salt-related behaviours including not adding salt at the table (44 and 61 %), not adding salt when cooking (49 and 74 %), avoiding processed foods (59 and 77 %), looking at Na labels on foods (43 and 32 %), buying low-salt alternatives (55 and 69 %), using spices other than salt (44 and 61 %) and avoiding eating out (61 and 16 %).
Discussion
The current systematic review found that while dietary data were available on fat, sugar and salt intakes in Pacific Island countries, some countries had limited or no data, and most countries lacked high-quality data. In fact, only Fiji has a recent comprehensive nutrition survey. The absence of quality nutrition data is concerning, given high rates of NCD in the region( 1 ) and changing dietary patterns from traditional diets toward a more Western-style diet as shown by historical trends from previous studies( Reference Thow, Heywood and Schultz 4 , Reference Charlton, Russell and Gorman 6 ). Furthermore, changes in local food production, population growth, environmental conditions, increased reliance on processed and imported foods, and lack of policies( Reference Iese, Paeniu and Pouvalu 12 , Reference Snowdon, Raj and Reeve 48 ) also put Pacific Islanders at a higher risk for NCD. There is a need for better data on Pacific diets to establish benchmark consumption levels, to better inform initiatives to improve diets. Also, quality parameters should be considered when interpreting existing data.
The percentage contribution to total energy intake from fat was below the recommended 30–35 % of total energy( 49 ) for four countries, although in the case of Solomon Islands( Reference Tsuchiya, Tagini and Cafa 38 ) energy from fat was at the minimum level of 15 % recommended for adequate population consumption of energy( 49 ). Furthermore, it is important to note that absolute intake of total fat was about 100 g/d in Fiji, Guam and Tonga, similar to intakes reported in developed countries( 50 ). In terms of saturated fat intake, the modelling study by Micha et al.( Reference Micha, Khatibzadeh and Shi 46 ) showed that the nine Pacific Island countries with data had the highest intakes of this nutrient (average of 23·5 %), far exceeding the recommended limit of <10 % of total energy( 49 ) and the global average of 9·4 %. A review of data from forty countries in 2013 found that total fat intake is correlated with saturated fat intake, but not with polyunsaturated fat intake( Reference Harika, Eilander and Alssema 51 ). This suggests that interventions aimed at lowering fat intake should focus not only on lowering saturated fat intake, but also increasing polyunsaturated fat intake( Reference Harika, Eilander and Alssema 51 , Reference Jakobsen, O’Reilly and Heitmann 52 ).
There was not enough information about absolute intake of sugar, although based on household expenditure and percentage contribution to energy intake data it appeared that Kiribati had high sugar intakes relative to other Pacific Island countries. Unfortunately, there was no information available about sources of sugar or consumption patterns to further explain this finding, although an earlier study reported that sugar-sweetened beverage consumption in Kiribati was moderate (less than 23 % of 11- to 18-year-olds consuming soft drinks daily and import of less than 40 litres per person( Reference McDonald 8 )).
All countries with data appeared to be exceeding the WHO recommended limit of less than 5 g salt/person per day, contributing to the high rates of morbidity and mortality due to CVD( Reference Strazzullo, D’Elia and Kandala 53 ). As such, salt reduction initiatives and policies are essential to lower population salt intake and reduce the burden of NCD( 54 ). A systematic review of salt reduction initiatives around the world in 2015 reported that only a few Pacific Island countries engage in actions to reduce salt intake (e.g. food reformulation and front-of-pack labelling)( Reference Trieu, Neal and Hawkes 55 ), and a separate review showed that while there has been good progress in terms of planning strategies, barriers such as the lack of capacity to accurately measure salt intake and effectively implement activities hinder further progress( Reference Christoforou, Snowdon and Laesango 56 ). The population-based multisectoral salt reduction interventions implemented in Fiji( Reference Pillay, Trieu and Santos 34 ) and Samoa( Reference Trieu, Ieremia and Santos 36 ) both showed a non-significant change in salt intake following the interventions. The authors identified reasons for the null effect such as the short intervention duration (18 months), low intervention dose, lack of participation from other government sectors and limited engagement with the food industry. These suggest the need for stronger and more active mechanisms for multisectoral governance and partnership; engaging with the food industry; and planning, monitoring and evaluation of interventions to reduce salt intake in the region.
Although not specifically covered in the present review, a common theme noted in the identified studies was the increasing reliance of Pacific Islanders on processed foods. This was evident in countries with data on main sources and behaviours, which showed that the consumption of these foods (e.g. canned meat and fish, rice, sugar-sweetened drinks and instant noodles, among others) was frequent and common. This trend may also be reflected at feasts. Paulino et al.( Reference Paulino, Leon Guerrero and Novotny 19 ) found that the type of foods served during feast days in Guam has shifted from low-energy foods to predominantly high-energy foods such as ‘meats, desserts, sodas and other sweetened beverages’. Further studies are warranted to confirm this in other countries. A review of processed foods in Pacific Island countries reported that most are heavily dependent upon food imports with only a small proportion of foods produced locally( Reference Snowdon, Raj and Reeve 48 ). Previous studies have shown that an increasing reliance on energy-dense nutrient-poor imported foods is associated with increases in NCD( Reference Hughes and Lawrence 15 , Reference Ulijaszek 57 , Reference Brownell and Yach 58 ). This demonstrates the wide scope for potential strategies including regulations on imported products, food safety and labelling in the Pacific Islands( Reference Snowdon, Raj and Reeve 48 , 59 ).
The current review revealed a range of different dietary assessment methods employed by studies. This variation limits comparison of intakes between countries and over time within a country. Data were available from HIES however, including in five countries where HIES was the only source of nutrition data. In the absence of other national surveys using standardized methodologies, these surveys may provide a good proxy measure of dietary intake( Reference Smith, Dupriez and Troubat 60 ). If HIES are used in this manner, standardization and reporting of methods may need to be strengthened as most reports did not provide information on standardization methods. We also observed country differences in the way foods were grouped and reported which made them unsuitable for comparison. For instance, sugar intake was reported as sugar alone or confectionery alone, sugar and confectionery combined, or sugar, jam, honey, chocolate and confectionery.
Differences in quality between peer-reviewed studies and grey literature studies were observed. Peer-reviewed studies generally used direct approaches to measuring diet but had poor participation rates, while grey literature studies, which were generally reports of national surveys, had better participation rates but often employed indirect approaches to measure dietary intake. Furthermore, grey literature studies were larger scale (national) compared with peer-reviewed studies which were usually implemented at a community or village level. This suggests that strengthening the quality of nutrition data in the Pacific will require the use of more direct dietary methods in national surveys and efforts to link large- and small-scale studies. This was achieved in Samoa( Reference Webster, Su’a and Ieremia 37 ) where 24 h urine collection was measured from a subset of STEPS participants (i.e. targeted 500 individuals out of 2800 STEPS participants) and demonstrated that it was feasible to incorporate salt intake measurements into a population-based national survey without large additional costs. This is important since the WHO has recommended the integration of salt intake monitoring through urine collection into its STEPS surveys( 47 ).
Strengths of the present review include the systematic approach, the breadth of databases searched, multiple search strategies and extensive grey literature searches, and stakeholder input. All Pacific Island countries were individually searched within the published literature. Quality assessment was conducted at the dietary assessment and study methodology level, which, to the authors’ knowledge, has not been done before in a review of dietary intakes of Pacific Island countries. Limitations of the review include the restriction by language and publication date. Given several of the countries included are French-speaking and that all Pacific Island countries have English as a second language, it is likely that nutrition data are reported in other languages that we have missed. Synthesis was also only based on studies that collected data in 2005 and thereafter, and a meta-analysis would have strengthened the analysis but was deemed inappropriate due to the heterogeneity across the studies. Within each type of outcome, it was also not possible to pool the results due to different assessment methods and analytical approaches. The review also focused on adults only. A number of Pacific countries are implementing health promotion programmes in schools, so a similar review of children and adolescents may be helpful.
Conclusions
In summary, the present study reviews the availability and quality of information on dietary fat, sugar and salt intake in the Pacific Islands. Although varying methods and quality meant that it was difficult to assess and compare studies, the review suggests that intakes of fat, sugar and salt are generally high in countries across the region, with the exception of relatively low salt and fat intakes measured in Solomon Islands. More research of high quality is required throughout the Pacific Islands in order to understand health risks attributable to the diets of its people and inform effective policy interventions.
Acknowledgements
Acknowledgements: The authors wish to thank Emalie Sparks for her contribution in the technical aspects of the manuscript. Financial support: J.W. is supported by a National Health and Medical Research Council (NHMRC)/National Heart Foundation Career Development Fellowship (grant number #1082924) on international strategies to reduce salt. J.W. has funding from WHO, the Victorian Health Promotion Foundation (VicHealth) and NHMRC for research on salt reduction. J.W. is supported through an NHMRC Centre of Research Excellence on food policy interventions to reduce salt (grant number #1117300). K.T. is supported by an NHMRC postgraduate scholarship (grant number #1115169) and VicHealth for work on salt reduction. C.B. is a researcher within an NHMRC Centre of Research Excellence in obesity policy and food systems (grant number #1041020). The funders had no role in the design, analysis, interpretation or writing of this article. Conflict of interest: J.W. is Director of the WHO Collaborating Centre on Population Salt Reduction with a remit to support countries to implement and evaluate salt reduction programmes in line with the WHO target for all countries to reduce population salt intake by 30 % by 2025. All other authors declare no conflicts of interest related to this study. Authorship: J.A.S., J.W., K.T. and B.M. conceived the study. W.S., J.S. and C.B. provided information on available data in Pacific Island countries. J.A.S. and B.M. conducted the risk of bias assessment. J.A.S. wrote the first draft of the paper. All other authors provided comments on the drafts and approved the final paper. Ethics of human subject participation: Not applicable.
Supplementary material
To view supplementary material for this article, please visit https://doi.org/10.1017/S1368980018003609


 Open access